A T8.5 Brown Dwarf Member of the Xi Ursae Majoris System
Abstract
The Wide-field Infrared Survey Explorer has revealed a T8.5 brown dwarf (WISE J111838.70+312537.9) that exhibits common proper motion with a solar-neighborhood (8 pc) quadruple star system - Xi Ursae Majoris. The angular separation is 8.5′, and the projected physical separation is AU. The sub-solar metallicity and low chromospheric activity of UMa A argue that the system has an age of at least 2 Gyr. The infrared luminosity and color of the brown dwarf suggests the mass of this companion ranges between 14 and 38 for system ages of 2 and 8 Gyr respectively.
1 Introduction
The effective temperature and thus spectrum of a brown dwarf evolves with time as it cools as a degenerate object (Kumar, 1962). For an isolated brown dwarf, determination of mass and age are intertwined, such that a broad locus of mass and age will be consistent with a single measured effective temperature (Burrows et al., 2003). In rare instances brown dwarfs may reside in close binary systems, resolving this ambiguity with a direct dynamical mass estimation (Konopacky et al., 2010; Cardoso et al., 2009). In the absence of a dynamically measured mass, spectral modeling can significantly constrain a brown dwarf’s mass if there exists sufficient restriction on the object’s age. Constraints on age and metallicity are available if the brown dwarf is a member of a multiple star system. In this case, the properties of the primary, particularly chromospheric activity and kinematics, provide an indication of age.
The Wide-field Infrared Survey Explorer mission (WISE, Wright et al., 2010) has been a productive engine for the discovery of the coolest brown dwarfs. The WISE W1(3.4 m) and W2 (4.6 m) filters are optimally tuned to select the coolest candidates, specifically those with spectra significantly shaped by methane absorption at low effective temperature (Mainzer et al., 2005). To date spectroscopic follow-up of WISE-selected sources has revealed more than 100 ultracool brown dwarfs (Kirkpatrick et al., 2011) including several exceptionally cool Y-dwarfs (Cushing et al., 2011; Kirkpatrick et al., 2012; Tinney et al., 2012) demonstrating that WISE colors provide for reliable photometric selection of ultra-cool brown dwarf candidates.
WISE J111838.70+312537.9, hereafter WISE 1118+31, easily meets the WISE brown dwarf color selection criterion (Kirkpatrick et al., 2011) with a W1-W2 color of 2.85 compared to a selection threshold of 2.0. Few confusing objects meet these selection restrictions. In addition this source lies 8.5′ from one of the nearer stars to the Sun, UMa, prompting an investigation into a possible system membership. This paper reports the spectral characterization of WISE 1118+31 and the analysis of a series of astrometric observations spanning 26 months aimed at determining whether this source exhibits common proper motion with UMa. These observations demonstrate that WISE 1118+31 is a newly found member of this already remarkable multiple star system. The characteristics of the primary system provide an indication of the metallicity and age of the newly discovered ultra-cool brown dwarf constraining the mass of this object.
2 Observations
2.1 WISE
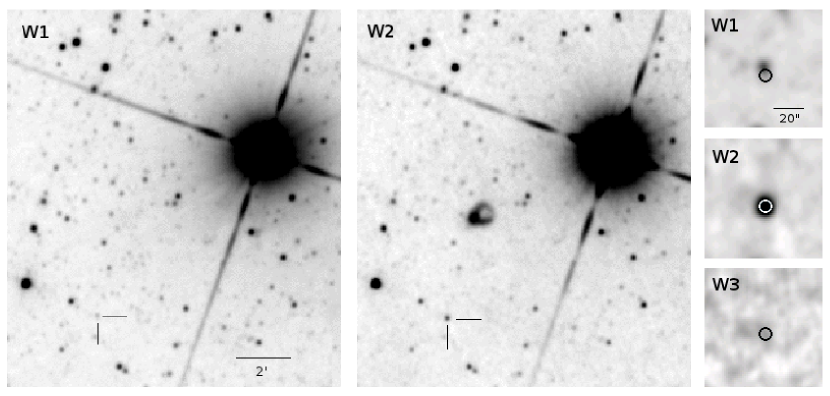
WISE imaged the region of the sky containing WISE 1118+31 on twenty occasions between 21 May 2010 04:20 UT and 25 May 2010 09:39 UT. The WISE All-Sky Catalog reports this source as well detected in W1 and W2, with marginal signal at the position of the W1/2 source in W3 (12 m) and only an upper limit in W4 (22 m). Of the twenty apparitions, eighteen were sufficiently separated from a detector edge to permit source extraction. In all eighteen cases the source was detected in W2, producing a combined SNR=34 detection with W2=13.31. Because exceptionally cool brown dwarfs are considerably fainter in W1, which was optimized to produce a substantial flux difference between W1 and W2, WISE 1118+31 is detected in W1 in only 12 of the 18 opportunities with a combined SNR=15 and W1=16.16, yielding a color of W1-W2=2.85. Figure 1 shows portions of the WISE image atlas covering both WISE 1118+31 and UMa.
2.2 Follow-up Imaging
| Filter | Vega Magnitude | Instrument |
|---|---|---|
| Y(MKO) | FanCam | |
| J(MKO) | WHIRC | |
| J | Bigelow | |
| J | FanCam | |
| H(MKO) | WHIRC | |
| H | Bigelow | |
| Ks(MKO) | WHIRC | |
| W1 | WISE | |
| ch1 | IRAC | |
| ch2 | IRAC | |
| W2 | WISE | |
| W3 | WISE | |
| W4 | WISE |
Multiple epochs of near-infrared imaging provide the astrometric data for WISE 1118+31 needed to confirm common proper motion with UMa. Photometric information from these images in summarized in Table 1 while the astrometric data are listed in Table 2. No corrections for non-linearity were applied to the ground-based photometry because the sky is brighter (Sánchez et al., 2008) than both WISE 1118+31 and the faint 2MASS objects used as calibrators. The absolute calibration uncertainties of 3% for Spitzer (Reach et al., 2005) and 2.4, 2.8, 4.5 & 5.7% for W1..4 (WISE Explanatory Supplement §IV.4.h.v) relative to Spitzer have not been included in the errors quoted in Table 1.
2.2.1 Fan Mountain Observatory/FanCam
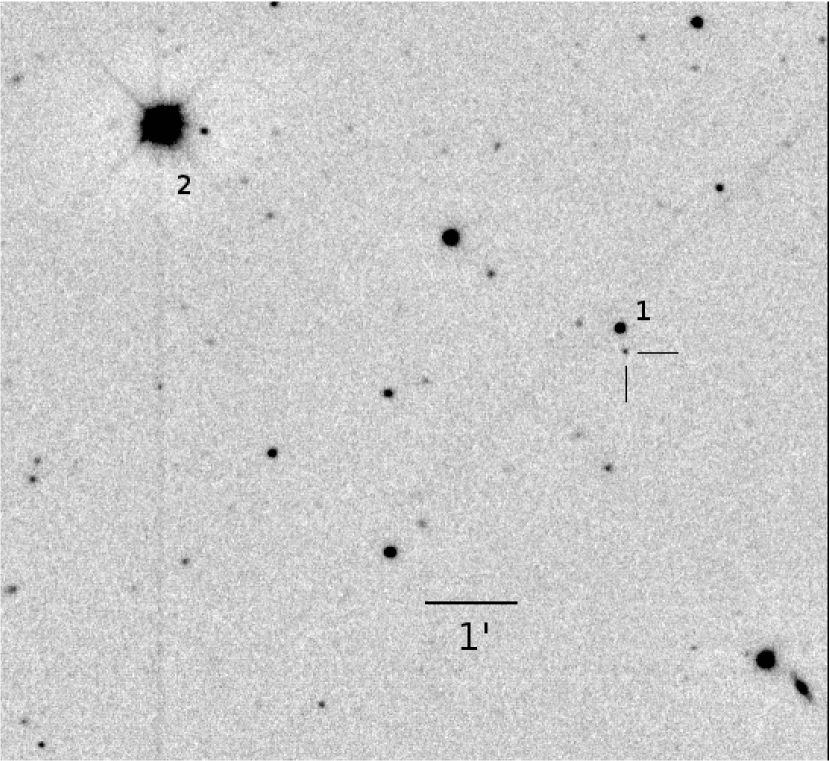
photometry and astrometry of WISE 1118+31 were obtained at various epochs between 28 Nov 2010 and 15 Mar 2012 with FanCam, a HAWAII-1 based near-infrared imager operating at the University of Virginia’s Fan Mountain 31-inch telescope (Kanneganti et al., 2009). The source position was dithered by approximately 10′′ between 30 s exposures comprising total exposure times ranging from 60 to 80 minutes. The FanCam field of view (FOV) is 8.7′ (0.51′′/pixel). The central (Figure 2) of the combined, dithered exposures was fully covered, providing several 2MASS stars for photometric and astrometric reference. A median sky frame was subtracted from each individual exposure prior to flat fielding with the median background level subsequently restored to the image. aperture photometry was computed using an aperture with a radius of 3 pixels. The zero points for the -band were computed using stars in the FOV with measured 2MASS magnitudes since the -band filter in FanCam are based on the 2MASS system. In order to derive the -band zero point, we first computed the -band magnitudes of stars in the FOV using their 2MASS and magnitudes and the transformation given by Hamuy et al. (2006). The final uncertainty in the magnitudes include the photon noise from the sky and source, the read noise, and the uncertainty in the zero point due to the computed -band magnitudes of the calibrators. The resulting magnitudes and uncertainties are given in Table 1.
2.2.2 Mount Bigelow/2MASS
The former 2MASS camera on the 1.54 m Kuiper Telescope on Mt. Bigelow, Arizona, has three 256256-pixel NICMOS3 arrays simultaneously observing in 2MASS , , and filters (Milligan et al. 1996). The plate scale for all three arrays is 1.65′′/pixel, resulting in a 7′ field of view. Exposures of 10s duration, 216 in all, of WISE 1118+31 were obtained on 20 May 2011 using 6 repeats of a box dither pattern, with four consecutive images taken at each of the nine dither positions. The data were reduced using custom IDL routines implementing standard near-infrared flat fielding, background removal, and co-addition techniques. Flat fields in each band were constructed using on-source frames. 2MASS stars provided photometric reference in all three bands, leading to the magnitudes reported in Table 1.
2.2.3 WIYN/WHIRC
broad-band imaging of WISE 1118+31 was obtained on UT 31 Dec 2011 with the WIYN High-Resolution Infrared Camera (WHIRC, Meixner et al., 2010) and the WIYN 3.5-m Observatory. The data quality is excellent: both seeing ( with 0.1′′ pixel scale) and photometric stability conditions were optimal. For each band, individual frames had exposure times of 120, 120 and 40 seconds, for , and , respectively. WHIRC uses MKO filters for . Using an efficient on-array dither pattern, a total of 7, 9 and 43 frames for , and , respectively, were obtained, thus providing a total exposure time of 840, 1080 and 1720 seconds for the , and mosaics respectively.
Individual frames were corrected for pupil-ghosts, dark and median sky flat subtracted, normalized by dome flat, and distortion corrected using information from the WHIRC user information guide. Astrometric and photometric solutions using 2MASS standards were then found. The fully reduced frames were combined into a deep mosaic, with outlier (bad pixel) rejection applied using temporal statistics. A final astrometric and flux calibration was then applied to the deep mosaic. The photometric uncertainty (comparing with the 2MASS PSC) was typically better than 5% for each mosaic produced. The achieved spatial resolution was for the final mosaics, and the astrometric uncertainty was . The target source, WISE 1118+31, was detected in all three bands. Using a 1.1′′ radius circular aperture, the background-subtracted integrated (Vega) magnitudes found are reported in Table 1. Note that WHIRC uses MKO filters, and the expected difference for a T8.5 brown dwarf is mag (Stephens & Leggett, 2004). If we correct the values by this amount we get three values for : 17.79, 17.86 & 18.01. The mid-range of these values in which we adopt, giving .
2.2.4 Spitzer
The Infrared Array Camera (IRAC) (Fazio et al., 2004) onboard the Spitzer Space Telescope employs 256256-pixel detector arrays to image a field of view of 5252 (12 pixel-1). IRAC was used during the warm Spitzer mission to obtain deeper photometry in its 3.6 and 4.5 m channels (hereafter, ch1 and ch2, respectively) than WISE was able to take in its W1 and W2 bands. These observations were made as part of Cycle 7 and Cycle 8 programs 70062 and 80109 (Kirkpatrick, PI). Our standard data acquisition and reduction methodology for IRAC observations is outlined in Kirkpatrick et al. (2011).
2.2.5 Keck Adaptive Optics Imaging
High resolution imaging observations of WISE 1118+31 were obtained using the Keck II LGS-AO system (Wizinowich et al., 2006; van Dam et al., 2006) with NIRC2 on 14 April 2012 (UT). WISE 1118+3125 is not bright enough to serve as the tip-tilt reference star for the LGS-AO system, so we used the nearby 2MASS star (# 1 on Figure 2), which has =16.7 and is located about 7′′ from the target. The seeing was generally very good throughout the night (03–05, however high clouds were present during the observations of WISE 1118+31. We used the MKO filter and narrow plate scale (0.009942′′/pixel for a single-frame field-of-view of ) for the observations. The data were obtained by using a 3-point dither pattern that avoided the noisy, lower left quadrant of the array. Each image had an integration time of 120 s and the dither pattern was repeated five times to give a total exposure time of 1800 s.
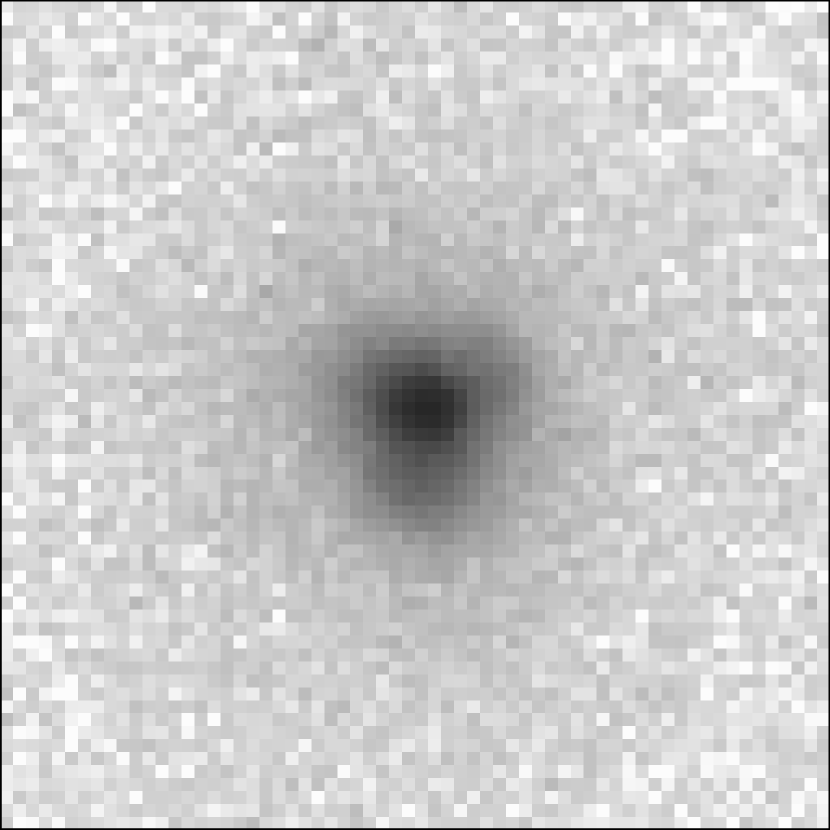
The images were reduced in a standard fashion using custom IDL scripts. These steps included dark frame subtraction, flat fielding (using a dome flat), and sky subtraction from a sky frame created from the dithered science frames. The individual frames were then shifted to move WISE 1118+31 to the center of the array and the stack was median averaged to create the final mosaic seen in Figure 3. The FWHM in the final mosaic is 54 mas and shows no irregularities or evidence for a close companion.
2.3 Spectroscopy
2.3.1 LBT-LUCIFER
We obtained an - and -band spectrum of WISE 1118+31 on 2012 Dec 12 (UT) using the Large Binocular Telescope (LBT) Near-Infrared Spectroscopic Utility with Camera and Integral Field Unit for Extragalactic Research (LUCIFER, Mandel et al., 2008). A series of twelve 300 s exposures was obtained at different positions along the 4′ slit to facilitate sky subtraction. The A0 V star HD 97034 was also observed for telluric correction and flux calibration purposes. A series of halogen lamp exposures were also obtained for flat fielding purposes.
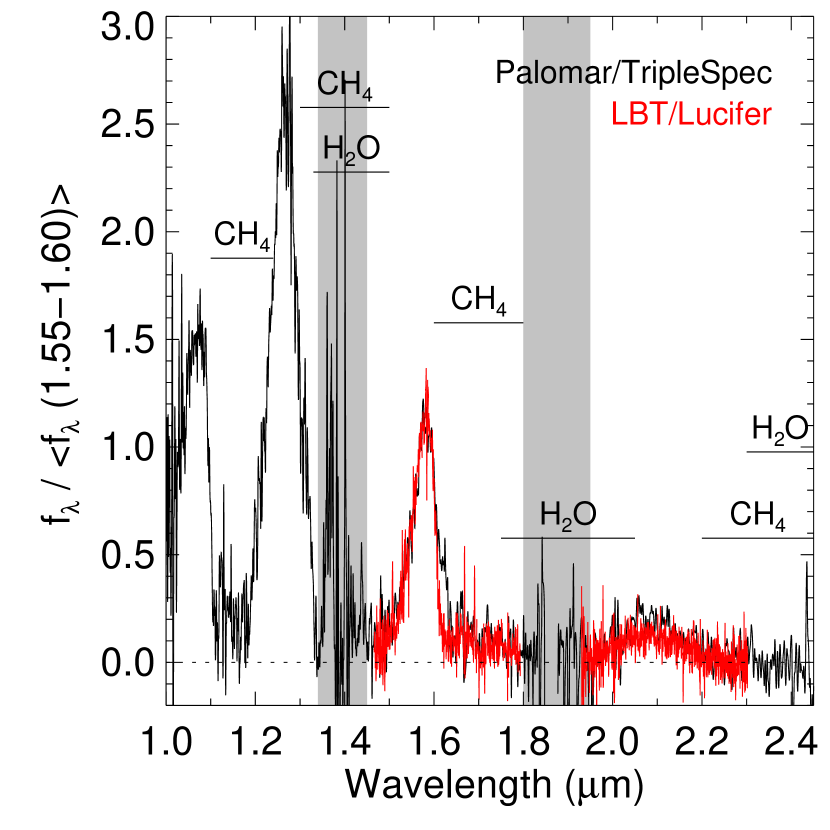
The data were reduced using custom Interactive Data Language (IDL) software based on the Spextool data reduction package (Cushing et al., 2004). Pairs of images taken at two different positions along the slit were first subtracted and flat-fielded. The spectra were then extracted and wavelength calibrated using sky emission lines of OH and CH4. The twelve spectra are combined and then corrected for telluric absorption and flux calibrated using the technique described by Vacca et al. (2003). The final spectrum is shown in Figure 4.
2.3.2 Hale - TripleSpec
A 12.5 m spectrum of WISE 1118+31 was obtained with the Triple Spectrograph (Triplespec, Herter et al., 2008) at the 5.08 m Hale Telescope at Palomar Observatory. The 12.5 m range is covered over four cross-dispersed orders which are imaged simultaneously on the 1024 2048 HAWAII-2 array. The 1′′-wide slit provides a resolving power of . A series of eight, 300 s exposures were obtained at two different positions along the 30′′-long slit to facilitate sky subtraction. The A0 V star HD 99966 was observed for telluric correction and flux calibration purposes and dome flats were obtained at the start of the night.
The data were reduced using a modified version of the Spextool (Cushing et al., 2004) package; a detailed description of the reduction steps can be found in Kirkpatrick et al. (2011). Briefly, a two-dimensional wavelength solution is derived using sky emission features of OH and CH4. Spectra are then extracted from pair-subtracted, flat-fielded images. The resulting spectra are combined and corrected for telluric absorption and flux calibrated on an order-by-order basis. Finally, the spectra from each order are stitched together to form a complete 12.5 m spectrum. The spectrum was then flux calibrated as described in Rayner et al. (2009) using the photometry in Table 1. The final spectrum is shown in Figure 4.
3 Discussion
3.1 Properties of the Central Star System
Ursae Majoris111also Alula Australis, HR 4374/5, Gl 423, HD 98230/1 is a complex stellar system with at least 4, and possibly 5 components (Mason et al., 1995) known prior to the discovery of WISE 1118+31. Visible to the unaided eye a short distance from the Big Dipper, this telescopic double star was among the first to be recognized as a gravitationally bound binary system (Herschel, 1804). Given the 60 year period of the visual pair it was not until 23 years later that Struve (1827) calculated a formal orbit. Subsequently both components of the visual pair with (Mason et al., 1995) were found to be spectroscopic binaries. Heintz (1967) finds periods of 669.1 days for the Aa system and 3.9805 days for the Bb system. Griffin (1998) gives velocity amplitudes, km/sec and km/sec in the 60 year orbit which lead to a dynamical parallax estimate of .
However Söderhjelm (1999) re-analyzed the Hipparcos data combined with other data for visual binaries and gives for the parallax of UMa, and total mass for the AaBb system of 2.62 .
The weighted mean of the dynamical parallax and the Hipparcos parallax is but with for 1 degree of freedom in the fit for the mean, so we inflate the errors by a factor of and adopt for the parallax.
Since the possible 5th component, seen by Mason et al. (1995) separated by 56 milli-arcseconds from the B component of the visual binary, was only detected at one epoch we will not consider it to be a member of the system.
Bakos et al. (2002) give a proper motion of /yr in position angle , based on a 29 year interval. These values resolve into /yr in RA and /yr in Dec which we adopt.
3.1.1 Spectral Types and Metallicities of the Central Stars
Cayrel de Strobel et al. (1994) used high resolution spectroscopy to find effective temperatures and gravities of K, for UMa A; and K, for B. These temperatures and gravities are consistent with spectral types of F8.5V and G2V assigned to UMa A and B by Keenan & McNeil (1989). Cayrel de Strobel et al. (1994) found that both stars had slightly sub-solar iron abundances, [Fe/H] dex.
3.1.2 Chromospheric Activity and Age of the Central Stars
Cayrel de Strobel et al. (1994) see chromospheric calcium emission lines for UMa B but not for UMa A. They propose that the short 4 day period orbit of the Bb system is driving the chromospheric activity in B. From the lack of emission in A, Cayrel de Strobel et al. (1994) conclude that UMa is older than stars in the cluster NGC 752, which has an age of 2 Gyr. Ball et al. (2005) report X-ray observations of UMa which show that all of the observed X-ray emission is coming from the 4 day period binary Bb. X-ray flux from component A is more than 2 orders of magnitude fainter, implying . Since component A is close to solar luminosity, the ratio of X-ray to bolometric flux is which gives an age greater than 4 Gyr using Equation(A3) in Mamajek & Hillenbrand (2008). The low space velocity km/sec calculated by Karataş et al. (2004) implies that UMa is a member of the thin disk, so ages much greater than 8 Gyr are unlikely. Finally Cayrel de Strobel et al. (1994) found that the luminosities and effective temperatures were consistent within the errors with the masses derived by Heintz (1967) for a 5 Gyr isochrone calculated with sub-solar abundance.
3.2 Astrometry of the Companion
Astrometric information was extracted from the observed images at the various epochs using the standard maximum likelihood technique in which a point spread function (PSF) was fit to each source profile. The positional uncertainties were estimated using an error model which includes the effects of instrumental and sky background noise and PSF uncertainty. The PSF and its associated uncertainty map were estimated for each image individually using a set of bright stars in the field. In order to minimize systematic effects, our astrometry was based on relative positions, using as a reference the nearby star 2MASS J11183876+3125441 at a separation of approximately 6.5′′ (star 1 in Figure 2). This is sufficiently close that systematic errors due to such effects as focal-plane distortion, plate scale, and rotation errors cancel out in the relative position to an accuracy much greater than the random estimation errors. We do, however, assume that the proper motion and parallax of the reference star are negligible compared to those of WISE 1118+31. In support of this assumption, we find no significant difference in relative motion of WISE 1118+31 when the differential astrometry is repeated using more distant 2MASS reference stars, at separations of 69′′ and 105′′. The astrometric estimation procedure is discussed in more detail by Marsh et al. (2012).
Table 2 gives the measured position offsets which were input to a parallax and proper motion code that handles both Earth-based and Spitzer observations. Table 3 gives the output from the code for three different sets of free parameters. In one case the proper motion and parallax were forced to zero. In the second case they were forced to match UMa. In the final case the proper motion and parallax were left as free parameters.
| Date | Observatory | Band | ||
|---|---|---|---|---|
| 2010.39 | WISE | W | ||
| 2010.91 | FanMt | Y | ||
| 2010.91 | WISE | W | ||
| 2011.05 | Spitzer | ch2 | ||
| 2011.12 | FanMt | J | ||
| 2011.24 | FanMt | J | ||
| 2011.38 | MtBglw | J | ||
| 2011.38 | MtBglw | H | ||
| 2011.85 | FanMt | J | ||
| 2012.00 | WIYN | J | ||
| 2012.00 | WIYN | H | ||
| 2012.00 | WIYN | K | ||
| 2012.20 | FanMt | Y | ||
| 2012.15 | Spitzer | ch2 | ||
| 2012.52 | Spitzer | ch2 |
| Type | #df | [′′/yr] | [′′/yr] | [′′] | |
|---|---|---|---|---|---|
| Fixed | 270.836 | 28 | 0 | ||
| Forced to UMa | 29.856 | 28 | |||
| Free | 28.579 | 25 |
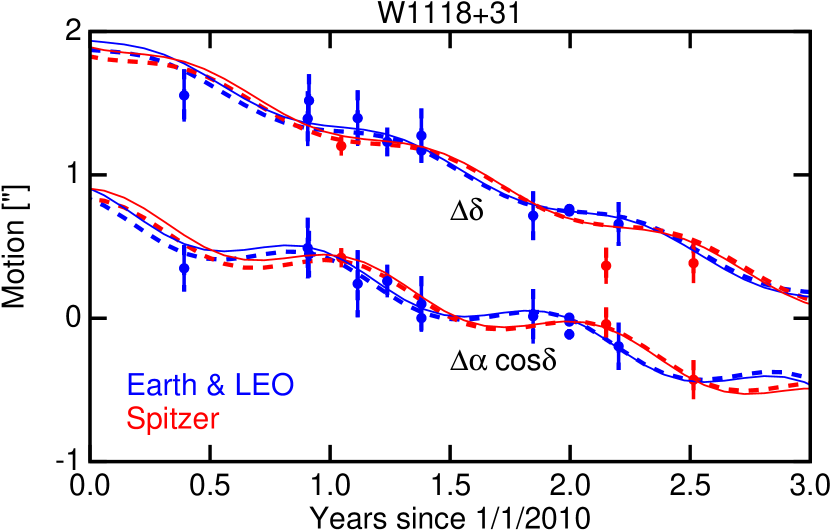
The astrometric fits for WISE 1118+31 are a very good match to the motion of UMa. The between the best fit and a fit with a fixed position shows that the motion of WISE 1118+31 has been detected with a SNR of 15.5, while the for 3 extra degrees of freedom between the best fit and a fit forced to match the proper motion and parallax of UMa is perfectly consistent with WISE 1118+31 being a bound member of the UMa system. Figure 5 shows two fits: one forced to match UMa and one with the proper motion and parallax as free parameters.
3.3 The Nature of the Companion
3.3.1 Spectral Classification
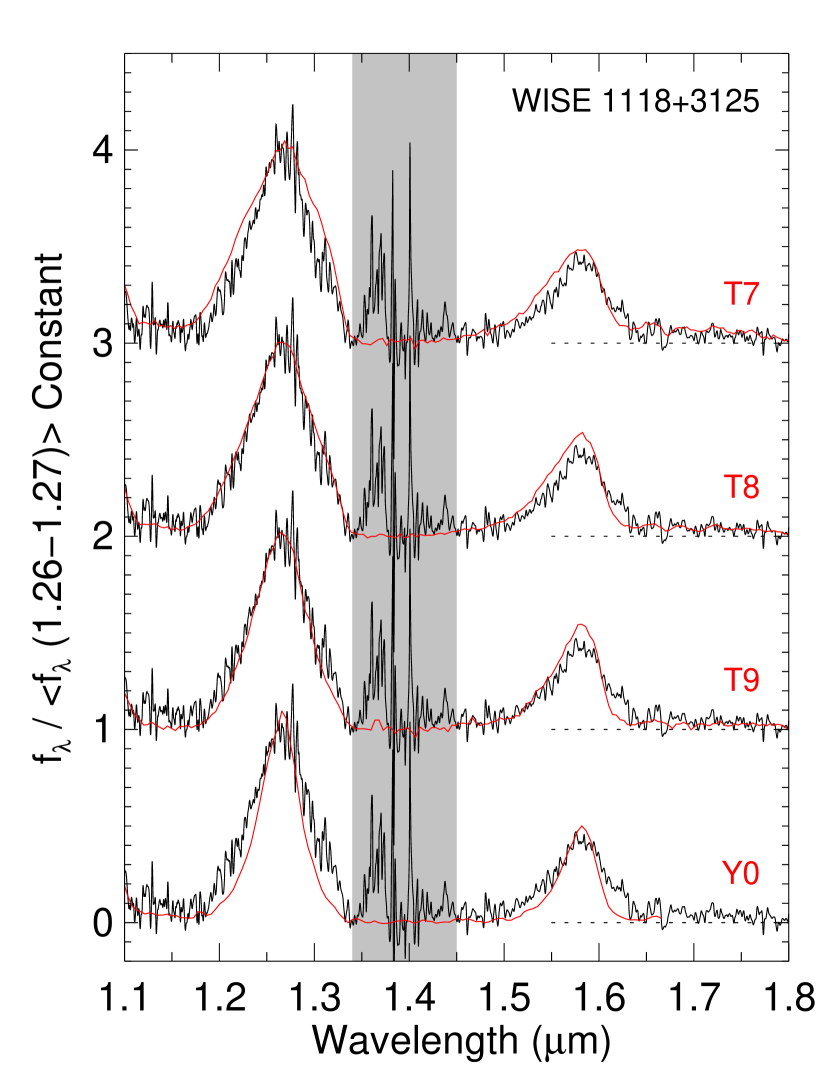
As shown in Figure 4, the spectrum of WISE 1118+31 exhibits deep absorption bands of CH4 and H2O indicative of T dwarfs. We derive a more precise spectral type using the spectral classification schemes of Burgasser et al. (2006) and the extension to this system by Cushing et al. (2011) whereby UGPS J072227.51-054031.2 (hereafter UGPS 072205, Lucas et al., 2010) is defined as the T9 spectral standard and WISE 1738+2732 is defined as the Y0 spectral standard. As shown in Figure 6, WISE 1118+31 has a spectral type of T8.5 based on the width of the J-band peak at 1.27 m.
3.3.2 Absolute magnitude, Luminosity and Mass
For our adopted parallax the absolute magnitude is . This agrees very well with the vs. type relation in Kirkpatrick et al. (2011) which gives for a spectral type of T. The vs. type relation in Kirkpatrick et al. (2012) with W1828+2650 excluded gives which also agrees with the observed W2 flux. This implies at 4.6 m.
To convert to we need the factor , which is equivalent to the bolometric correction, since (Wright et al., 2010) which is erg/cm2/sec for W2=0 with a spectrum, and , so
| (1) |
Thus
| (2) | |||||
Note that is non-negative and also normalized since by definition. Since the normalization integral is dominated by the brightest peaks, errors in the faint parts of the spectral energy distribution (SED) have only small effects on the derived value of or equivalently the bolometric correction. The brightest peaks in for late T dwarfs are in the band and the band, so if we get the color right then our value of will be fairly accurate.
We will use a model spectrum to evaluate in order to fill in the gaps between the photometric passbands, but we are only using the shape of the spectrum to calculate the bolometric correction. Thus, even if the effective temperature is a parameter of the model, that does not imply that the model parameter is the actual of the star.
Given a model spectrum , the ratio is given by
| (3) |
where is the response per photon (Wright et al., 2010). The model we use is a linear combination of sulfide cloud models from Morley et al. (2012) with K, . We form the sum of 0.2 times the flux from the cloudless model and 0.8 times the flux from the model. Physically this is a brown dwarf that is 20% covered by clear zones and 80% covered by cloudy bands. This linear combination gives , , , , and . The model matches the observed color by design but is too bright in and too faint in . If we make an ad hoc correction to the SED by making the wavelength range from 3.0 to 3.8 m covering the band 0.4 mag brighter that would match the color and change the normalization integral by 2%. If we make the wavelength range from 2.0 to 2.3 m covering the band 0.8 mag fainter, then the color matches the data and the normalization integral changes by -1.3%. Thus we adopt with a 10% uncertainty to allow for such errors in the model, giving and so for WISE 1118+31. Interpolating the vs. and figures in Saumon & Marley (2008) gives this luminosity for masses of 14 to 31 MJ with ages of 2 and 8 Gyr using the cloudy models, and 17 to 38 MJ for the cloudless models.
Even though the model parameters do not necessarily apply to the actual star, we find that they do give a mass and luminosity consistent with those derived above. The K, models of Hubeny & Burrows (2007) have radii of , and a mass . The luminosity calculated directly from and is so this model is reasonably self-consistent. Calculating the temperature from and gives K.
3.4 Another Binary?
If something like the Morley et al. (2012) sulfide clouds is not causing the red color of WISE 1118+31, then there is a tension between the absolute magnitude , which requires a fairly high , and the colors and spectral type which suggest a lower temperature. This could be ameliorated if WISE 1118+31 were an equal mass binary which would increase the total radiating area. In this case the absolute magnitude of one component of the binary would be and the colors would remain the same. The best fitting Hubeny & Burrows (2007) model is then a non-chemical equilibrium model with K and . This model has , W1-W2 = 4.43, J(MKO)-W2 = 4.57, and . in the W2 band for this model, so the luminosity of a single component is . The mass range for ages from 2 to 8 Gyr in the Saumon & Marley (2008) cloudless models is 12 to 29 MJ, while the cloudy models give 10 to 25 MJ. Thus the range of total masses is 21 to 59 MJ under the equal mass binary hypothesis, which is not much different than the range under the single object hypothesis. However, the absolute magnitude of the components would no longer agree with the vs. type relation (Kirkpatrick et al., 2011, 2012).
As stated in §2.2.5, we saw no evidence for binarity in the 14 Apr 2010 NIRC2 images of WISE 1118+31. To determine the upper limit on the separation of an equal brightness companion, we added a shifted copy of the mosaic to the original mosaic. At separations 4 pixels, we are unable to convincingly establish the presence of the companion because of the difficulty in differentiating between an irregular PSF caused by an off-axis tip-tilt reference star and an elongated PSF caused by a companion when no other stars are present on the array. At separations of 5 pixels (50 mas), the presence of a companion is obvious. Therefore, we set the upper limit on the separation to 50 mas, slightly less than the FWHM of the image. If this was not due to a temporary conjunction, so the actual separation were less than 0.4 AU, then the orbital period could be less than 2 years.
3.5 The View from the Neighborhood of WISE 1118+31
With a projected separation of 4100 AU from the four main components of the UMa system, WISE 1118+31 has a distant but interesting perspective. The two binaries that form the 2′′ visual pair as seen from the Earth are separated by 20 AU, or by an angular scale of 15′ from the distant perspective of WISE 1118+31. At that distance the A and B components would each shine with an apparent visual magnitude of -9, one hundred times brighter than Venus in the skies of Earth.
Given the complexity of the UMa system, it is reasonable to speculate that WISE 1118+31 could be a component that was once more closely bound to the system, which was thrown into an orbit with a very large apocenter during a three body interaction that tightened the UMa Bb binary. This would make WISE 1118+31 similar in history to an Oort Cloud comet, formed at a radius of tens of AU from the central star system, lifted into an orbit with a high apocenter by multi-body perturbations, followed by galactic tides raising the pericenter (Duncan et al., 1987). Given an orbital period of order years, the orbital eccentricity of WISE 1118+31 may ultimately be detectable. With an apparent orbital radius of 8.5′ the orbital motion will amount to tens of milliarcseconds per year relative to the primary system, and a radial velocity difference of about 1 km/sec. Characterizing this motion, specifically the differential proper motion between WISE 1118+31 and its primary, is tractable given modern infrared and visual astrometric capability, and certainly will be accomplished with the passage of time.
4 Conclusions
Alula Australis ( UMa), a solar neighborhood visual binary where each component is itself a spectroscopic binary, possesses an ultra-cool brown dwarf (T8.5) companion at a projected separation of 4100 AU. This system is similar to, but somewhat more complex than, the binaries studied by Allen et al. (2012), who found that 1 in 5 spectroscopic binary systems had distant common proper motion companions. Faherty et al. (2010) found that wide companions were much more likely with binary or tertiary central objects, and UMa is a continuation of that trend. Thus the UMa system is uncommon primarily in the apparent magnitude of the central star system, due to its proximity to the Sun. The UMa system provides a very accurate absolute magnitude for a T8.5 brown dwarf, but both the age of the system and the mass of the brown dwarf are uncertain due to the difficulty of determining the age of a star in the middle of its main sequence lifetime. WISE 1118+31 appears to be slightly less luminous and redder than the T8 dwarf WISEP J1423+01 which is a common proper motion companion to BD+01 2920 (Pinfield et al., 2012).
The UMa system is amenable to detailed study since it is quite close to the Sun. An accurate (sub km/sec) radial velocity for WISE 1118+31 would be valuable information for determining its orbit around UMa. Improved proper motions for both WISE 1118+31 and the center of mass of the central quadruple star system are also needed for orbit characterization.
There is a tension between the red J-W2 color of WISE 1118+31 and its absolute magnitude when fitting to older models. This discrepancy could be relaxed if WISE 1118+31 were a binary, but one AO observation showed no evidence for binarity. Thus the new types of clouds considered by Morley et al. (2012) may well be significant, and we conclude that model spectra need to be updated to fit the observations of WISE 1118+31 and the many other late T and Y dwarfs found in the WISE data.
Mt. Bigelow/Kuiper-2MASS, WIYN/WIRC, Keck/NIRC2-LGSAO.
References
- Allen et al. (2012) Allen, P. R., Burgasser, A. J., Faherty, J. K., & Kirkpatrick, J. D. 2012, AJ, 144, 62
- Bakos et al. (2002) Bakos, G. Á., Sahu, K. C., & Németh, P. 2002, ApJS, 141, 187
- Ball et al. (2005) Ball, B., Drake, J. J., Lin, L., Kashyap, V., Laming, J. M., & García-Alvarez, D. 2005, ApJ, 634, 1336
- Burgasser et al. (2006) Burgasser, A. J., Geballe, T. R., Leggett, S. K., Kirkpatrick, J. D., & Golimowski, D. A. 2006, ApJ, 637, 1067
- Burgasser et al. (2002) Burgasser, A. J., Kirkpatrick, J. D., Brown, M. E., Reid, I. N., Burrows, A., Liebert, J., Matthews, K., Gizis, J. E., Dahn, C. C., Monet, D. G., Cutri, R. M., & Skrutskie, M. F. 2002, ApJ, 564, 421
- Burrows et al. (2003) Burrows, A., Sudarsky, D., & Lunine, J. I. 2003, ApJ, 596, 587
- Cardoso et al. (2009) Cardoso, C. V., McCaughrean, M. J., King, R. R., Close, L. M., Scholz, R.-D., Lenzen, R., Brandner, W., Lodieu, N., & Zinnecker, H. 2009, in American Institute of Physics Conference Series, Vol. 1094, American Institute of Physics Conference Series, ed. E. Stempels, 509–512
- Cayrel de Strobel et al. (1994) Cayrel de Strobel, G., Cayrel, R., Friel, E., Zahn, J.-P., & Bentolila, C. 1994, A&A, 291, 505
- Cushing et al. (2011) Cushing, M. C., et al. 2011, ApJ, 743, 50
- Cushing et al. (2004) Cushing, M. C., Vacca, W. D., & Rayner, J. T. 2004, PASP, 116, 362
- Duncan et al. (1987) Duncan, M., Quinn, T., & Tremaine, S. 1987, AJ, 94, 1330
- Faherty et al. (2010) Faherty, J. K., Burgasser, A. J., West, A. A., Bochanski, J. J., Cruz, K. L., Shara, M. M., & Walter, F. M. 2010, AJ, 139, 176
- Fazio et al. (2004) Fazio, G. G., et al. 2004, ApJS, 154, 10
- Griffin (1998) Griffin, R. F. 1998, The Observatory, 118, 273
- Hamuy et al. (2006) Hamuy, M., et al. 2006, PASP, 118, 2
- Heintz (1967) Heintz, W. D. 1967, Astronomische Nachrichten, 289, 269
- Herschel (1804) Herschel, W. 1804, Royal Society of London Philosophical Transactions Series I, 94, 353
- Herter et al. (2008) Herter, T. L. et al. 2008, in Society of Photo-Optical Instrumentation Engineers (SPIE) Conference Series, Vol. 7014, Society of Photo-Optical Instrumentation Engineers (SPIE) Conference Series
- Hubeny & Burrows (2007) Hubeny, I. & Burrows, A. 2007, ApJ, 669, 1248
- Kanneganti et al. (2009) Kanneganti, S., Park, C., Skrutskie, M. F., Wilson, J. C., Nelson, M. J., Smith, A. W., & Lam, C. R. 2009, PASP, 121, 885
- Karataş et al. (2004) Karataş, Y., Bilir, S., Eker, Z., & Demircan, O. 2004, MNRAS, 349, 1069
- Keenan & McNeil (1989) Keenan, P. C. & McNeil, R. C. 1989, ApJS, 71, 245
- Kirkpatrick et al. (2011) Kirkpatrick, J. D. et al. 2011, ApJS, 197, 19
- Kirkpatrick et al. (2012) Kirkpatrick, J. D. et al. 2012, ApJ, 753, 156
- Konopacky et al. (2010) Konopacky, Q. M., Ghez, A. M., Barman, T. S., Rice, E. L., Bailey, III, J. I., White, R. J., McLean, I. S., & Duchêne, G. 2010, ApJ, 711, 1087
- Kumar (1962) Kumar, S. S. 1962, AJ, 67, 579
- Lucas et al. (2010) Lucas, P. W. et al. 2010, MNRAS, 408, L56
- Mainzer et al. (2005) Mainzer, A. K., Eisenhardt, P., Wright, E. L., Liu, F.-C., Irace, W., Heinrichsen, I., Cutri, R., & Duval, V. 2005, in Presented at the Society of Photo-Optical Instrumentation Engineers (SPIE) Conference, Vol. 5899, UV/Optical/IR Space Telescopes: Innovative Technologies and Concepts II. Edited by MacEwen, Howard A. Proceedings of the SPIE, Volume 5899, pp. 262-273 (2005)., ed. H. A. MacEwen, 262–273
- Mamajek & Hillenbrand (2008) Mamajek, E. E. & Hillenbrand, L. A. 2008, ApJ, 687, 1264
- Mandel et al. (2008) Mandel, H. et al. 2008, in Society of Photo-Optical Instrumentation Engineers (SPIE) Conference Series, Vol. 7014, Society of Photo-Optical Instrumentation Engineers (SPIE) Conference Series
- Marsh et al. (2012) Marsh, K. A., Wright, E. L., Kirkpatrick, J. D., Gelino, C. R., Cushing, M. C., Griffith, R. L., Skutskie, M. F., & Eisenhardt, P. R. M. 2012, ApJ, TBD
- Mason et al. (1995) Mason, B. D., McAlister, H. A., Hartkopf, W. I., & Shara, M. M. 1995, AJ, 109, 332
- Meixner et al. (2010) Meixner, M., et al. 2010, PASP, 122, 451
- Morley et al. (2012) Morley, C. V., Fortney, J. J., Marley, M. S., Visscher, C., Saumon, D., & Leggett, S. K. 2012, ApJ, 756, 172
- Pinfield et al. (2012) Pinfield, D. J. et al. 2012, MNRAS, 422, 1922
- Rayner et al. (2009) Rayner, J. T., Cushing, M. C., & Vacca, W. D. 2009, ApJS, 185, 289
- Reach et al. (2005) Reach, W. T. et al. 2005, PASP, 117, 978
- Sánchez et al. (2008) Sánchez, S. F., Thiele, U., Aceituno, J., Cristobal, D., Perea, J., & Alves, J. 2008, PASP, 120, 1244
- Saumon & Marley (2008) Saumon, D. & Marley, M. S. 2008, ApJ, 689, 1327
- Söderhjelm (1999) Söderhjelm, S. 1999, A&A, 341, 121
- Stephens & Leggett (2004) Stephens, D. C. & Leggett, S. K. 2004, PASP, 116, 9
- Struve (1827) Struve, F. G. W. 1827, Catalogus novus stellarum duplicium et multiplicium (Dorpati [Tartu] : typis J. C. Schuenmanni)
- Tinney et al. (2012) Tinney, C., Faherty, J., Kirkpatrick, J. D., Wright, E., Gelino, C., Cushing, M., Griffith, R. & Slater, G. 2012, ApJ, 759, 60.
- Vacca et al. (2003) Vacca, W. D., Cushing, M. C., & Rayner, J. T. 2003, PASP, 115, 389
- van Dam et al. (2006) van Dam, M. A., et al. 2006, PASP, 118, 310
- Wizinowich et al. (2006) Wizinowich, P. L., et al. 2006, PASP, 118, 297
- Wright et al. (2010) Wright, E. L. et al. 2010, AJ, 140, 1868