Energy deposition profiles and entropy in galaxy clusters
Abstract
We report the results of our study of fractional entropy enhancement in the intracluster medium (ICM) of the clusters from the representative XMM-Newton cluster structure survey (REXCESS). We compare the observed entropy profile of these clusters with that expected for the ICM without any feedback, as well as with the introduction of preheating and cooling. We make the first estimate of the total, as well as radial, non-gravitational energy deposition upto for this large, nearly flux-limited, sample of clusters. We find that the total energy deposition corresponding to the entropy enhancement is proportional to the cluster temperature (and hence cluster mass). The energy deposition, scaled by , per particle as a function of gas mass shows a similar profile in all clusters, with its being more pronounced in the central region than in the outer region. Our results support models of entropy enhancement through AGN feedback.
Subject headings:
galaxies: clusters : general — X-rays: galaxies : clusters1. Introduction
Models of structure formation in the universe have been successful in predicting the average properties of galaxy clusters. Using these characteristics, such as gas temperature, XRay luminosity, SZ-flux and richness, it is possible to draw cosmological conclusions from surveys of galaxy clusters (e.g., Reiprich & Böhringer (2002); Vikhlinin et al. (2009); Gladders et al. (2007); Khedekar, Majumdar & Das (2010); Rozo et al. (2010); Sehgal et al. (2011); Benson et al (2011). The detailed properties of the intracluster medium (ICM) however, need more input to the physics of baryonic gas than its falling into a dark matter potential (e.g. Shaw et al. (2010); Battaglia et al. (2011); Trac, Bode & Ostriker (2011); Chaudhuri & Majumdar (2011)). It is believed that feedback from galaxies, including active galactic nuclei (AGNs), and/or radiative cooling of the ICM gas, modify the X-ray properties of the gas (see McNamara & Nulsen (2007, 2012)). These non-gravitational processes tend to increase the entropy of the ICM gas, thereby making it tenuous, and consequently, under-luminous in X-rays, especially in low temperature (and mass) clusters.
Recent observations of profiles of entropy (defined as , where is the electron number density and , the Boltzmann constant 111We write for the entropy popularly defined in X-ray literature, and denote the thermodynamic entropy as ) allow one to compare them with theoretically expected profiles with or without feedback, and allow one to determine the nature and degree of feedback. Entropy as defined above is well suited for this sort of analysis as it is a record of the accretion of gas into the cluster, as well as the modifications shaped by the processes of gas cooling and feedback. Voit et al. (2005) had shown that in the absence of any feedback and cooling processes, simulations tend to predict a power-law radial profile for the entropy outside the core, with a scaling .
Since entropy per particle is a Lagrangian quantity, it is more sensible to study the distribution of entropy not with the radial distance, but with gas mass, taking into account the movement of gas shells due to a change in entropy. Voit et al. (2005) suggested the comparison of entropy as a function of gas mass in order to determine the enhancement of entropy from non-gravitational processes (see also Nath & Majumdar (2011)). Here, we study the entropy profiles of clusters from the REXCESS sample and compare with the baseline profiles of ICM without any feedback. For these clusters, Pratt et al. (2010) studied the radial entropy profiles and after comparing with the initial profile, found that entropy enhancement is evident in the inner radii, and that it extends up to a large radii for low mass systems, while large mass clusters do not show entropy deviation at very large radii. In this Letter, we focus on the entropy profiles as functions of gas mass contained inside a given shell. We determine , where is the fractional deviation of the observed entropy from the benchmark theoretically calculated entropy, which is a measure of the energy deposition per unit gas particle, and investigate the profile of this energy deposition for low and high temperature clusters.
We adopt a CDM cosmology with km s-1 Mpc-1, and .
2. The cluster sample
The REXCESS survey (Böhringer et al., 2007) uses the REFLEX cluster catalog as a parent sample. REFLEX is a nearly complete flux limited cluster sample, covering 4.24 ster in the southern extragalactic sky (Böhringer et al., 2004). This sample consists of 31 local clusters in the redshift range . The clusters are selected on the basis of their X-Ray luminosity, erg in the keV band, with a homogeneous coverage in the chosen luminosity range, and no preference for any morphology type. The selected luminosity range provides clusters with a temperature keV, and does not include galaxy groups. As Pratt et al. (2010) have noted, the properties of the REXCESS sample allow one to study the variation of entropy profiles across a range of cluster masses, especially because the distances were chosen such that fell within the XMM-Newton field of view, which increased the precision of measurements at large radii. They also subdivided the sample into cool-core and non cool-core systems, defining the clusters with central density cm-3 as cool-core systems ( being the ratio of the Hubble constant at redshift to its present value).
In this work, we use the entropy profiles of 25 clusters from the whole REXCESS sample of 31 clusters (see Pratt et al. (2010), their Table1). We use only those clusters with data at a minimum of 5 radial points outside the core radii, thus excluding clusters number 2, 13, 23, 25 & 27 (ordered top-to-down respectively in the table). We also leave out cluster number 14 whose errors on observed entropy far exceed those of other clusters.
3. Entropy profiles
3.1. Initial entropy - radial profile
In order to assess the entropy enhancement in observed clusters, we first discuss the profile expected without any non-gravitational processes. Voit et al. (2005) presented an analytic form for the baseline entropy profile which they obtained by analyzing the entropy profiles of clusters from non-radiative simulations. Their simulated SPH profiles, when fitted in the range, scatter about a median scaled profile described by a baseline power law relation,
| (1) |
with approximately dispersion. These profiles however are found to flatten within a radius of , and they find that the agreement of the above fit with both their SPH and AMR simulations is better than beyond a radius of .
3.2. Initial entropy profile with gas mass
In this paper, we would like to study the entropy as a function of gas mass. In order to calculate the initial entropy profile as a function of gas mass, we use the initial radial entropy profile, in conjunction with the assumption of hydrostatic equilibrium. We assume the Navarro-Frenk-White (NFW) profile for the dark matter halo (, 1997). For the concentration parameter that we adopt222This value is measured for a morphologically relaxed cluster sample by Pointecouteau et al. (2005), also used by Pratt et al. (2010)., the corresponding relation for eqn 1 at becomes, (Pratt et al., 2010)
| (2) |
The equation of hydrostatic equilibrium can be written as,
| (3) |
where , is the gas pressure. For boundary conditions, we set the total gas fraction inside to be the universal baryon fraction, = . Eqns 2 & 3 are solved for the pressure profile ; this gives the density profile and hence . One can then invert to get .
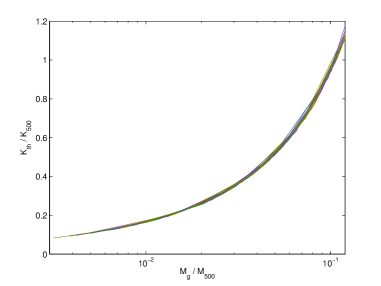
We show the results in Figure 1 (Upper Panel) that plots the theoretical profiles of scaled by , the characteristic entropy (eq 3 in Pratt et al. (2010)), for clusters of different temperature bins. The figure shows that is self similar to a good approximation. We have fitted the profile with a simple parameterization, , in the range . The scatters in the slopes and normalization for different values of are found to be small. The index for the whole sample. The value of the parameter was determined to be .
3.3. Observed entropy - radial profile
Pratt et al. (2010) have fit the REXCESS data to the form,
| (4) |
where is interpreted as the excess of core entropy above the best fitting power law at large radii. They scaled the quantities to , the effective limiting radius for high quality observations from XMM-Newton and Chandra, which they estimated iteratively from the updated calibration of the relation, by including the REXCESS data for morphologically relaxed systems. Interior to , the observed entropy is always higher than the baseline prediction. At , they find the median dimensionless entropy is and that this is higher than but consistent with the baseline prediction.
3.4. Observed entropy profiles with gas mass
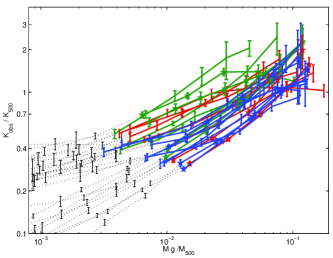
Next, we express the observed entropy profiles of REXCESS clusters as a function of . Figure 1 (Lower Panel) shows these profiles for all 25 clusters in our sample in different temperature ranges respectively. We fit the profiles by an expression of the form , in the range . We give mean and rms of the best fit values in Table 1. Note that the power-law indices for the observed entropy-gas mass relation are shallower than expected from the theoretical expectation. Interestingly this index (logarithmic slope) does not differ much in the whole cluster sample. The values of and show that cool-core clusters are entropy deficient.
| Sample | |||
|---|---|---|---|
| Total sample (25 clusters) | |||
| cool-core (9) | |||
| Non cool-core |
4. Effects of only preheating and cooling
Voit et al. (2002) discussed three types of modifications to the initial entropy profile, namely: (i) a truncation in the entropy profile owing to removal of gas, approximating the effect of gas cooling and dropping out of the ICM, (ii) a shift in the profile, mimicking the effect of preheating, and (iii) lowering the entropy profile due to radiative cooling. Assuming a form of the cooling function of the type for group temperatures keV), it was shown that across the cluster is reduced by an amount , where is a critical entropy. Johnson et al. (2009) suggested a combination of the effects of preheating and cooling, expressed as
| (5) |
, (their eqn 14) describes the cooling. They calculated the constant preheating shift by evaluating eqn 5 at their outermost radial point.
For the 28 nearby galaxy groups from the XMM-Newton survey, Johnson et al. (2009) found that while this ’preheating + cooling’ model matches the observations better than a simple shift/truncation, it still fell short of being a reasonable representation of the observed profiles.
We have fitted models of the form of eqn 5 to our sample, where we have used the entire profile and , rather than just one radial point for the fit. We attempted three different types of fits for each cluster, described below: (i) is evaluated using the full radial temperature profile instead of mean temperature; (ii) A fit using the constant for each cluster; (iii) We assume that a fraction of the gas mass is lost from the ICM, and try two fits with varying fractions of the total gas mass, . The temperature , and the expression used for the fitting is: .
We find that the number of clusters for which none of fits are good far exceeds the clusters for which any of fits can be called reasonable (reduced ). The lack of a good fit to the preheating+cooling model in most of the clusters in the sample suggests that a major component of entropy enhancement occurs beyond simple preheating and radiative cooling.
5. Fractional entropy deviation and energy input
In order to determine the amount of energy deposition associated with the entropy enhancement, we use the quantity , where . This is because the thermodynamic entropy of an ideal gas is related to , as and the change in energy per unit mass (see also eqn 3 of Finoguenov et al. (2008)).
In an isochoric process, (see also (Lloyd-davies et al., 2000)),
| (6) |
In an isobaric process, however, (for )
The ratio of the changes in energy for a given fractional change and , is given by,
| (8) |
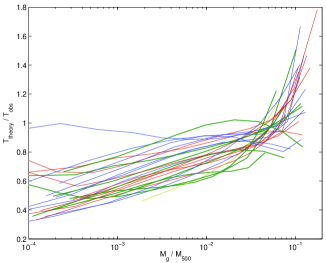
For a value of , the ratio is . This implies that if the observed temperature deviates from the theoretically calculated value by a factor , then the two above mentioned estimates of energy input per unit mass differ by only a factor of . Figure 2 shows the ratio for clusters in the sample. One can see that the two temperature profiles vary within a factor of ; hence, we choose the expression for the isochoric process in our estimates.
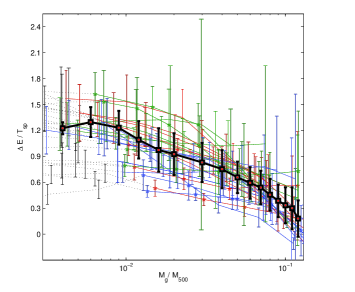
We first estimate the energy per particle, , for each cluster. Fig 3 shows the profiles for , the ratio of the non-gravitational energy injection to the gravitational potential of the clusters in three temperature bins. While the detailed profiles differ from cluster to cluster, generally has a decreasing profile with a similar trend. Albeit with a large scatter within each temperature group, we find that the mean value of is the highest for the lowest temperature group and vice versa. For all clusters, non-gravitational energy is already comparable to gravitational energy at core radii. Moreover, the profiles decrease by a factor of % for keV clusters and % for keV clusters. Thus, on average, the profiles for higher masses decrease faster than those for lower masses. Our calculations, as mentioned earlier, are valid outside the core .
We determine the mean profile after averaging over all the profile fits for the individual clusters.333To this end, we use the fit The mean profile with the scatter is shown in fig 3 . The mean profile decreases by roughly a factor of 4 between and .
The total amount of energy deposited, for the whole cluster is ,
| (9) |
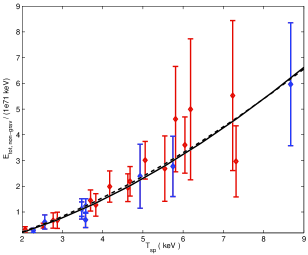
for between the limits . We use the fits obtained above to calculate the integral and the results are shown in Figure 4. Clearly is proportional to the cluster mass. A fit results in the following scaling relations for the whole sample:
| (10) |
If the cool-core clusters are omitted, then one obtains a slope of , a constant term of and first coefficient as .
Dividing the energy by the total number of particles in the ICM, we estimate the mean energy to be keV per particle.
6. Discussions
We can compare the value of keV per particle as a measure of the energy input corresponding to the observed entropy enhancement, with those inferred from other considerations. We note that the earlier observations of entropy enhancement in the ICM, mostly inferred from the deviations of several cluster scaling relations, were interpreted in terms of an entropy floor. It was thought that elevating the ICM gas to an entropy floor of a few hundred keV cm2 would explain the observations. This entropy floor can be associated with an amount of energy if the density of the gas at the epoch of energy input is known. For example, simulations by Borgani et al. (2001) showed that an entropy floor of keV cm2 was adequate to explain the observations. They found this corresponds to keV per particle if the heating was assumed to have taken place at .
Interestingly, (2004) showed for their model of AGN feedback from black holes that X-ray observations could be explained with an energy input proportional to cluster mass. In their model of AGN feedback through buoyant bubbles of relativistic plasma, which deposit energy into the ICM through work, convection and thermal conduction, this proportionality implied a linear relation between the black hole mass of the central AGN and the cluster mass. We find that in order to explain the correlation in Figure 4, we need the black hole mass , where the energy available from the AGN is characterized by an efficiency .
Simulations by Gaspari et al. (2012) also show that the energy deposition is centrally peaked within the core of the cluster. We note however that our results pertain only to regions outside the core radius.
We have estimated the energy input corresponding to the entropy enhancement differently from previous works: Firstly, we have not used any cluster scaling relations which depend on the average properties of the ICM. We have also used the distribution of the X-ray entropy () with gas mass, since entropy per unit mass () is a Lagrangian quantity. Furthermore, instead of determining an entropy floor and then estimating an amount of energy assuming a certain density, we have estimated the energy input from first principles.
Our result implies that the effect of energy deposition in low and high temperature clusters is remarkably similar although the entropy enhancement processes may differ substantially in these systems. Secondly, the gas mass profiles of energy deposition per particle show that the processes responsible for entropy enhancement in clusters affect the gas in the central regions more than in the outer regions. Moreover, profiles for higher masses decreases faster than those for lower masses. The basic similarity (modulo some dependence on the cluster masses) in the profiles can provide a test for future simulations.
Taken together, our results indicate that the energy associated with entropy enhancement is proportional to cluster mass. Furthermore, their effect in all clusters is centrally peaked. This suggests an energy source which must satisfy both requirements simultaneously. As mentioned earlier, AGN feedback models satisfy the first requirement (, 2004). It is also plausible that the effect of the feedback is more pronounced in the inner regions, driving most of its gas outside the inner region (McCarthy et al., 2010; Gaspari et al., 2012).
7. Summary
We have looked at the fractional entropy enhancement in the ICM for a sample of REXCESS clusters by comparing the observed entropy profiles to those expected from gravitational collapse only. We first show that this entropy excess cannot be explained by only preheating plus cooling models of entropy enhancement. Since, this entropy excess must be sourced from non-gravitational processes, we connect this excess to any non-gravitational energy deposition in the ICM. We report, to our knowledge, the first energy deposition profiles in a large sample of clusters and also estimate the total non-gravitational energy that has been dumped into the ICM. We find that this excess energy is proportional to cluster temperature (and hence cluster mass). We show that the entropy enhancement process in the ICM is centrally peaked and is relatively larger in low temperature clusters than in high temperature clusters. Our results support models of entropy enhancement through AGN feedback.
Acknowledgements
The authors would like to thank Gabriel Pratt for providing the data on which this work is based. AC would like to thank RRI for hospitality.
References
- Battaglia et al. (2011) Battaglia, N., Bond, J. R., Pfrommer, C., & Sievers, J. L., 2011, Arxiv/1109.3711
- Benson et al (2011) Benson, B. A., et al, 2011, Arxiv/1112.5435
- Böhringer et al. (2004) Böhringer, et al. 2004, A&A, 425, 367
- Böhringer et al. (2007) Böhringer, et al. 2007, A&A, 469, 363
- Borgani et al. (2001) Borgani, S., Governato, F., Wadsley, J., Menci, N., Tozzi, P., Lake, G., Quinn, T., Stadel, J. 2001, ApJ, 559, L71
- Cavagnolo et al. (2009) Cavagnolo, K. W., Donahue, M., Voit, G. M., & Sun, M. 2009, ApJS, 182, 12
- Chaudhuri & Majumdar (2011) Chaudhuri, A., & Majumdar, S., 2011, ApJ, 728, L41
- Finoguenov et al. (2008) Finoguenov, A., Ruszkowski, M., Jones, C., Bruggen, M., Vikhlinin, A., Mandel, E. 2008, ApJ, 686, 911
- Gaspari et al. (2012) Gaspari, M., Ruszkowski,, M., Sharma, P.. ApJ, 746, 94
- Giodini et al. (2010) Giodini, S. et al. 2010, ApJ, 714, 218
- Gladders et al. (2007) Gladders, M D., Yee, H. K. C., Majumdar, S., Barrientos, L. F., Hoekstra, H., Hall, P. B., & Infante, L., 2007, ApJ, 655, 128
- Haarsma et al. (2010) Haarsma, D. B. et al. 2010, ApJ, 715, 881
- Johnson et al. (2009) Johnson, R., Ponman, T. J., & Finoguenov, A. 2009, MNRAS, 395, 1287
- Khedekar, Majumdar & Das (2010) Khedekar, S., Majumdar, S., & Das, S., 2010, Phys. Rev. D, 82, 041301
- Lloyd-davies et al. (2000) Lloyd-Davies, E. J., Ponman, T. J., & Cannon, D. B. 2000, MNRAS, 315, 689
- McCarthy et al. (2010) McCarthy, I. G. et al. 2010, MNRAS, 406, 822
- McNamara & Nulsen (2007) McNamara, B. R., Nulsen, P. E. J. 2007, ARA&A, 45, 117.
- McNamara & Nulsen (2012) McNamara, B. R., Nulsen, P. E. J. 2007, 2012, arxiv/1204.006.
- Nath & Majumdar (2011) Nath, B. B., Majumdar, S. 2011, MNRAS, 416, 279
- (20) Navarro, J. F., Frenk, C. S., White, S. D. M. 1997, ApJ, 490, 493
- Pointecouteau et al. (2005) Pointecouteau, E., Aranaud, M., Pratt, G. W. 2005, A&A, 435, 1
- Pratt et al. (2010) Pratt, G. W., et al. 2010, A&A, 511, A85
- Reiprich & Böhringer (2002) Reiprich, T., & Böhringer, H., 2002, ApJ, 567, 716
- (24) Roychowdhury, S., Ruszkowski, M., Nath, B. B., Begelman, M. C. 2004, ApJ, 615, 681
- Rozo et al. (2010) Rozo, E., et al., 2010, ApJ, 708, 645
- Sehgal et al. (2011) Sehgal, N., et al., 2011, ApJ, 732, 44
- Shaw et al. (2010) Shaw, L. D., Nagai, D., Bhattacharya, S., & Lau, E. T., 2010, ApJ, 725, 1452
- Trac, Bode & Ostriker (2011) Trac, H., Bode, P., & Ostriker, J. P., 2011, ApJ, 727, 94
- Voit et al. (2002) Voit, G. M., Bryan, G. L., Balogh, M. L., Bower, R. G. 2002, ApJ, 596, 601
- Voit et al. (2003) Voit, G. M., Balogh, M. L., Bower, R. G., Lacey, C. G., Bryan, G. L. 2003, ApJ, 593, 272
- Vikhlinin et al. (2009) Vikhlinin et al., 2009, ApJ692, 1060
- Voit et al. (2005) Voit, G. M., Kay, S. T., Bryan, G. L. 2005, MNRAS, 364, 909