11email: mrequena@mpifr-bonn.mpg.de 22institutetext: Department of Astronomy, University of Maryland, College Park, MD 20742, USA 33institutetext: Centro de Astrobiología (CSIC-INTA), Ctra. deTorrejón Ajalvir, E-28850 Torrejón de Ardoz, Madrid, Spain 44institutetext: I. Physikalisches Institut der Universität zu Köln, Zülpicher Stra e 77, 50937 Köln, Germany
GREAT confirms transient nature of the circumnuclear disk
We report SOFIA/GREAT, Herschel/HIFI, and ground-based velocity-resolved spectroscopy of carbon monoxide (CO) rotational transitions from J=2-1 to J=16-15 toward two positions in the circum-nuclear disk (CND) in our Galactic center. Radiative transfer models were used to derive information on the physical state of the gas traced by CO. The excitation of the CO gas cannot be explained by a single physical component, but is clearly the superposition of various warm gas phases. In a two-component approach, our large velocity gradient (LVG) analysis suggests high temperatures of 200 K with moderate gas densities of only 104.5 cm-3 for the bulk of the material. A higher excited phase, carrying 20-30 of the column densities, is warmer (300-500 K) but only slightly denser (105.3 cm-3). These densities are too low to self-stabilize the clumps against their high internal turbulence and fall below the Roche density (107 cm-3) at 1.5 pc galactocentric distance. We conclude that the bulk of the material in the CND is not organized by self-gravity nor stable against tidal disruption, and must be transient.
Key Words.:
ISM: clouds - ISM: kinematics and dynamics - ISM: molecules - Galaxy: center - Radio lines: ISM1 Introduction
At a distance of only 8.5 kpc, our Galactic center (GC) is a unique laboratory for studying the physical processes that also occur within extragalactic nuclei in general. The innermost central parsecs contain all the ingredients and processes that also affect the gas in other nuclei that are too distant for detailed study. Here we are most concerned with the massive gas clouds that lie within a few parsecs of the Galactic center’s black hole, SgrA∗. It is only in our own Galaxy’s center that we can spatially resolve and study these likely reservoirs of matter that fuel the center’s episodic activity.
The global distribution of the interstellar matter in the very center of the Galactic nucleus is a 1-1.5 pc radius ionized cavity centered on SgrA∗. The cavity’s outer boundary forms the sharp inner edge of the circum-nuclear disk (CND), a thin disk-like structure composed of dense molecular gas in filaments and streamers that extend to radius 5 pc. Ionized material is present also in the cavity in the form of streamers with a “mini-spiral” shape. These streamers have high radial velocities and carry material deep into the central cavity and close to SgrA∗ (for more detailed references we refer to the review by Genzel et al. 2010).
Despite many investigations, the physical characteristics of the neutral gas remains a topic of debate. Estimates of the CND’s molecular gas mass range between 104 (from dust) and 105-6 M⊙ (derived from gas tracers). Depending on the probe, density estimates for the dense clumps are 105-8 cm-3 and gas temperatures run from 50 to a few hundred K. The range of physical parameters leaves open many questions about the nature and fate of the CND, for instance whether the clumps’ densities exceed the Roche limit and make them stable against tidal disruption, or whether they are fully transient features.
A prerequisite for a quantitative comparison between these competing scenarios is an in-depth investigation of the temperature and density distribution in this clumpy, filamentary ring. Early work from Genzel et al. (1985) detecting CO(16-15) with the KAO, clearly indicated the existence of a gas phase with high temperatures. Harris et al. (1985) tied low-, mid-, and high-J observations together for a full CO excitation analysis that gave Tkin 300 K and n(H2) 104.5 cm-3. Bradford et al. (2005), revisiting these data with new CO(7-6) observations derived warm 200–300 K and moderate densities 5–7104. White et al. (2003) used infrared ISO/LWS data to find gas with Tkin 900 - 1400 K and n(H2) 104 - 104.5 cm-3.
In this contribution we present initial results of a systematic and comprehensive investigation of the CND, combining velocity-resolved heterodyne spectroscopic observations with the far-infrared spectrometers GREAT111GREAT, the German REceiver for Astronomy at Terahertz frequencies, is a development by the MPI für Radioastronomie and the KOSMA Universität zu Köln, in cooperation with the MPI für Sonnensystemforschung and the DLR Institut für Planetenforschung. on board of SOFIA and HIFI/PACS on Herschel, supplemented by data of lower-J CO transitions from APEX and the IRAM-30m telescope.
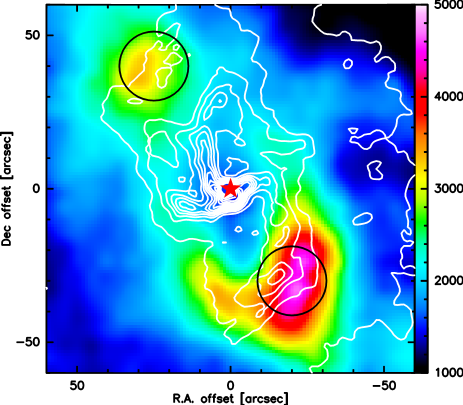
Here we perform an in-depth CO excitation analysis toward the prominent northern and southern lobes of the CND (Fig. 1). The CO spectral energy distribution is from line-resolved observations of most transitions of the CO rotational ladder up to J = 16-15, and additional 13CO isotopologues to confine the optical depth of the CO lines.
2 Observations
The GREAT observations were performed during two SOFIA Basic Science flights in 2011. On April 08, GREAT was operated at 42700 ft altitude in its L1a/L2 configuration (Heyminck et al. 2012), tuned to the CO(11-10) and CO(16-15) lines. In the second flight, on July 16, (13)CO(13-12), and CO(16-15) were observed in the L1b/L2 channels (40000 ft). We used the Fast Fourier Transform spectrometers (FFTs, Klein et al. 2012) for back-ends; each provided 212 kHz spectral resolution across a bandwidth of 1.5 GHz. At the high observing frequencies, GREAT’s bandwidth is insufficient to cover all velocities in the Galactic center in one observation. A single setup does cover velocities from the individual positions, however, and we made two separate receiver tunings offset by +75 and -75 km/s relative to rest to cover each position.
The observations were performed in double-beam switching mode, with a throw of 360′′ at a position angle of 45∘ (CCW to R.A.), at a rate of 1 Hz. We made 53 and 33 raster maps on an 8′′ grid in equatorial coordinates for CND-S and CND-N, respectively. Optical guide cameras established pointing to an accuracy of . The beam width is 22.5′′ at the frequency of CO(11-10), 19.1′′ for CO(13-12) and 15.6′′ for CO(16-15). The main beam and forward efficiencies are =0.54 (L1) and 0.51 (L2), with =0.95. The data were calibrated with the KOSMA/GREAT calibrator (Guan et al. 2012), carefully removing residual telluric lines, and further processed with the GILDAS222http://www.iram.fr/IRAMFR/GILDAS packages CLASS and GREG.
| Transition | Eup[K] | [THz] | Td [K km/s] | ||
|---|---|---|---|---|---|
| CND-S | CND-N | ||||
| 12CO(2-1) | 5.5 | 0.230 | 797.4 | 670.4 | I |
| 13CO(2-1) | 5.3 | 0.220 | 49.0 | 21.2 | I |
| 12CO(3-2) | 16.6 | 0.346 | 1668.3 | 852.9 | A |
| 12CO(4-3) | 33.2 | 0.461 | 2199.6 | 1023.5 | A |
| 12CO(6-5) | 83.0 | 0.691 | 1782.3 | 786.7 | A |
| 13CO(6-5) | 79.3 | 0.661 | 165.5 | 67.2 | A |
| 12CO(7-6) | 116.2 | 0.807 | 1753.0 | 708.6 | A |
| 12CO(10-9) | 248.9 | 1.152 | 841.5 | 242.1 | H |
| 12CO(11-10) | 304.2 | 1.267 | 818.8 | 218.0 | G |
| 12CO(13-12) | 431.3 | 1.497 | 391.6 | 77.0 | G |
| 13CO(13-12) | 412.3 | 1.431 | 26.5 | G | |
| 12CO(16-15) | 663.4 | 1.841 | 188.2 | 34.4 | G |
To confine the CO excitation of the CND we have mapped during recent years all CO mm/submm transitions, 2 Jup 7 with APEX and the IRAM-30m telescope,that are accessible from these large ground-based facilities. These data will be presented elsewhere (Requena-Torres et al., in prep.); for this study we extracted the spectra necessary for a comparison with the new SOFIA/GREAT FIR observations. We also included a CO(10-9) data point from the HexGal key program on the Galactic center (PI: R.Güsten). Table 1 gives transition information and velocity-integrated line intensities for the two positions in the CND we analyze here, CND-S and CND-N (see Fig. 1). All spectra were convolved from our Nyquist-sampled maps to the same angular resolution (22.5′′, of the CO(11-10) observations), thereby defining a uniquely coherent data base.
3 Results and analysis

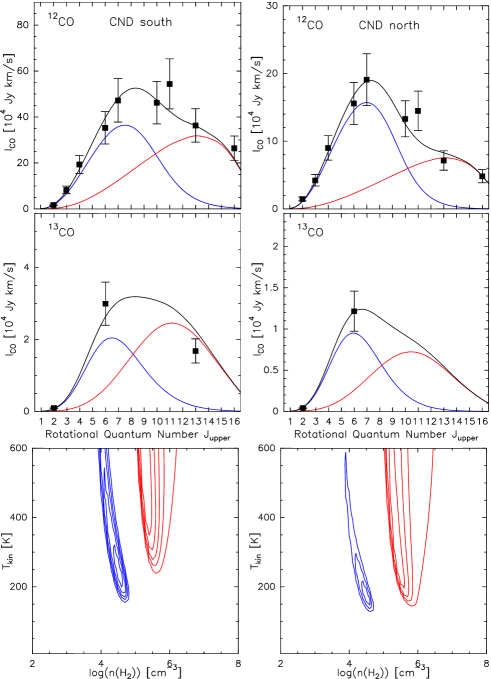
Fig. 2 compares the high-J 12CO spectra observed with GREAT with those of lower rotational transitions. At negative velocities all low-rotational lines are strongly affected by deep line-of-sight absorption features; these are negligible for Jup (Eup 116 K). The FIR lines (Jup 10) show clean emission profiles from the CND only. To recover the flux affected by these absorptions, we fitted a high-order polynomial to the broad emission masking the absorptions, and used the fit to estimate the underlying emission. Similarly, line contributions from the massive GC clouds (at and below +50 km/s) disappear for Jup 10. Comparison of the observed isotopic line ratios (10-20, Table 1) with the isotopic abundance ratio determined for Galactic center clouds, [12C]/[13C] 25 (Güsten et al. 1985; Wilson & Rood 1994; Martín et al. 2012) indicates that the CO emission from the CND is only marginally optically thick, with opacities on the order of unity.
The line profiles of the high-J CO lines show higher intensities for the most negative velocities in the line wings of CND-S as the J increases. The rotation curve of the CND shows that velocity rises toward SgrA∗ until just beyond the CND-S and CND-N positions, so the increased velocity indicates that the higher-J lines are displaced toward the sharp inner edge of the CND. While this could indicate heating by the central sources, the lack of a strong shift at CND-N suggests that local heating is also important. Combined with the broader lines toward the brighter CND-S position, this suggests that shocks from turbulence within the CND might provide substantial local heating; Christopher et al. (2005) also reported concentrations of dense HCN gas cores associated with 2.2 m emission from shock-excited H2 at these positions (see, Yusef-Zadeh et al. 2001). Shocks will allow material to drop into the central cavity, while radiative excitation will drive material out of the cavity.
Velocity-integrated brightness temperatures, corrected for line-of-sight absorption in multi-component Gaussian fits, are compiled in Table 1. The integration is limited to velocity ranges characteristic for the southern [-150 to -30 km/s] and northern [80 to 150 km/s] lobe, respectively, thereby excluding velocities with heavy line-of-sight absorption and contributions from the massive GC clouds. In Fig. 2 the corresponding CO line spectral energy distributions (SED) are displayed. The peaks of the SEDs at J 7, 155 K above ground reflect the existence of gas at high temperatures, and the width of the distribution requires contributions from more than a single gas phase. Assuming local thermal equilibrium (LTE), we can estimate the optical depth ( 1.8, Table 1) and the excitation temperature of the bulk emission from the 12CO and the 13CO(6-5) lines . Toward CND-S (clump ”Q” of Montero-Castaño et al. (2009) and ”O” of Christopher et al. (2005), with size of 8′′) the main beam temperature Tmb 50 K observed in the original 8.9′′ APEX beam translates into an R-J corrected clump excitation temperature of 135 K. This provides a lower limit for the kinetic temperature in this clump.
The CO excitation was investigated using a large velocity gradient (LVG) model in a similar manner as described in Weiß et al. (2007). The CO abundances in the GC region are well constrained by [12CO]/[H2] = (see Bradford et al. 2005, for details) and, as commented before, the carbon isotopic ratio [12CO]/[13CO] = 25. Furthermore, the velocity gradient () in the inner CND can be estimated from clump sizes and line widths observed in high spatial resolution HCN and CS interferometry, which yields km s-1 pc-1 (Christopher et al. 2005; Montero-Castaño et al. 2009). Then our model only has three free parameters for each gas component, namely the H2 density, the kinetic temperature Tkin, and the effective source solid angle (filling factor) expressed as equivalence clump radius r0. In this reduced parameter space the line opacities, which are most critical to fit the observed 12CO to 13CO line ratios, are directly proportional to the H2 density ([CO]/[H2] n(H2) ). As such our models have high constraining power on the gas density while Tkin and r0 are partly degenerated.
The best-fit LVG model parameters to the SEDs are presented in Table 2 and displayed in Fig. 2. The main conclusion toward the two selected bright rim positions are that
-
•
the broad, structured SEDs cannot be fitted by a single gas component. We must describe the distribution by at least a two-component fit as an approximation to a likely continuous temperature/density distribution.
In our two component approach the high-J (10) transitions are entirely driven by the high excitation component. This component is more pronounced in the south than in the north position. Our models suggest that the difference is mainly due to a larger source size of this component in the southern lobe (Table 2). The physical parameters of the two gas phases are similar between CND-N and CND-S. The 12CO line temperatures (with increasing line brightness up to J=4-3, Table 1) reflect the lines’ low optical depth, driven by the high turbulence. The LVG optical depths in the 12CO(6-5) lines are consistent with our LTE estimates above and predict optically thin () emission for the two lowest CO transitions. -
•
Densities are tightly constrained in the reduced parameter space. We find H2 gas densities of log(n) = 4.5 cm-3 for the low-excitation component for both regions. The gas density of the high-excitation component in the southern lobe is log(n) = 5.2. Owing to the absence of a 13CO(13-12) measurement toward CND-N, the parameters for its high-excitation gas are less well constrained. Values in Table 2 assume the same (low) opacity for this line as derived for CND-S. Higher gas densities are excluded because they would overestimate the line opacities. As such our models strongly suggest gravitational unbound clouds.
-
•
Molecular gas masses (for the restricted velocity ranges, Table 1) in the beam toward CND-S are M = 280 (105) M⊙ for the lower (higher) excitation phase, and M = 165 (40) M⊙ toward CND-N. Assuming that the CO(7-6) emission at all velocities [-150,150] traces CND gas only (hence no contributions from l-o-s gas) the total gas masses toward these two positions are 795 and 590 M⊙. Next, assuming comparable excitation conditions throughout the inner CND (defined by an outer disk radius of 3.3 pc), we can estimate its total gas mass by scaling the masses derived in the two beams (1385 M⊙) with the ratio of the total (spatially) integrated flux of the CO 7-6 transition across the CND (Fig. 1) to the CO(7-6) flux observed in these two beams. We derive a mass of the inner CND of 1.2 M⊙ - this is very comparable to the mass obtained by Genzel et al. (1985) and, more recently, by Etxaluze et al. (2011), but much lower than results based on dense gas tracers (see discussion).
-
•
Kinetic temperatures for the low-excitation gas are on the order of 200 K, and 300-600K for the high-excitation component. The lower limit for Tkin of 150 K in all components arises because that lower temperatures would require gas densities in excess of the limits discussed above. Kinetic gas temperatures as low as the dust temperatures of 24/45 K derived from recent Herschel observations (Etxaluze et al. 2011) are inconsistent with our isotopic line ratios even if we consider models with a lower [12CO]/[13CO] abundance ratio of only 40. Our models therefore strongly support shock heating as the most important mechanism because shocks are the only mechanism to drive the kinetic temperature significantly above the dust temperature.
| gas phase | r0 (pc) | Tkin | log n(H2) | log N(H2) | |
|---|---|---|---|---|---|
| CND-S | low exc. | 0.31 | 200 | 4.5 | 22.64 |
| high exc. | 0.08 | 500 | 5.2 | 23.34 | |
| CND-N | low exc. | 0.32 | 175 | 4.5 | 22.35 |
| high exc. | 0.06 | 325 | 5.3 | 23.15 |
4 Discussion
The gas densities derived from our CO excitation analysis clearly imply that the CO emitting gas cannot be gravitationally stable against tidal shear because they are much below the Roche limit of 107 cm-3. This comparison and because the observed velocity gradient is much higher than motions expected for virialized clouds at our densities strongly suggest that the CND clouds are transient features. This is in contrast to conclusions gained from studies of dense gas tracers such as HCN and HCO+ (e.g. Christopher et al. 2005; Montero-Castaño et al. 2009). These studies derive much higher gas densities (107 cm-3), albeit under the assumption of virialization. As a consequence, these studies yield molecular gas masses on the order of M⊙ for the CND, roughly two orders of magnitude above our estimate. We note that these differences cannot be explained by the different critical densities between CO and HCN/HCO+ because our high-J CO transitions have values comparable to those of the low-J HCN line and even exceed those of HCO+.
To resolve the obvious discrepancy between these classical density
tracers, a more rigorous investigation of the HCN/HCO+ excitation
will be performed - including those higher excitation submm and FIR
transitions that have not been considered so far. Complementary
isotopologues shall be observed to constrain the opacity of
the lines. Infrared pumping via the strong
14 m radiation field in the CND will be studied In the
excitation models (see Sakamoto et al. 2010; Weiß et al. 2007,
for an evaluation of the effect). Observationally one
should aim to constrain this excitation path, and hence the value of
HCN to trace dense gas in the CND, by searching for the
vibrationally excited rotational transitions.
Based on our GREAT/SOFIA data we conclude that the (inner) CND is
best described by a collection of transient filamentary streamers and
clumps (Güsten et al. 1987). Its mass is comparatively low, few 104
M⊙, which has implications on the mass accretion rate toward
the central object (Genzel et al. 2010).
Acknowledgements.
We thank the SOFIA engineering and operations teams whose support has been essential for the GREAT accomplishments during Early Science. Based [in part] on observations made with the NASA/DLR Stratospheric Observatory for Infrared Astronomy. SOFIA Science Mission Operations are conducted jointly by the Universities Space Research Association, Inc., under NASA contract NAS2-97001, and the Deutsches SOFIA Institut under DLR contract 50 OK 0901.References
- Bradford et al. (2005) Bradford, C. M., Stacey, G. J., Nikola, T. et al. 2005, ApJ, 623, 866
- Christopher et al. (2005) Christopher, M. H., Scoville, N. Z., Stolovy, et al. 2005, ApJ, 622, 346
- Etxaluze et al. (2011) Etxaluze, M., Smith, H. A., Tolls, V., et al., 2011, AJ. 142, 134
- Genzel et al. (1985) Genzel, R., Watson, D.M., Crawford, M.K, Townes, C.H. 1985, ApJ, 297, 766
- Genzel et al. (2010) Genzel, R., Eisenhauer, F., Gillessen, S. 2010, RvMP, 82, 3121
- Guan et al. (2012) Guan, X., Stutzki, J., Graf, U.U., et al. 2012, this volume
- Güsten et al. (1985) Güsten, R., Henkel, C., Batrla, W. 1985, A&A, 149, 195
- Güsten et al. (1987) Güsten, R., Genzel, R., Wright, M. C. H., et al. 1987, ApJ, 318, 124
- Harris et al. (1985) Harris, A.I., Jaffe, D.T., Silber, M., & Genzel, R. 1985, ApJ, 294, L93
- Heyminck et al. (2012) Heyminck, S., Graf, U. U., Güsten, R., et al., 2012, A&A, this volume
- Klein et al. (2012) Klein, B., Hochgürtel, S., Krämer, I., et al. 2012, A&A, this volume
- Martín et al. (2012) Martín, S., Martín-Pintado, J., et al. 2012, A&A, 539, 29
- Montero-Castaño et al. (2009) Montero-Castaño, M., Herrnstein, R. M., Ho, P. 2009, ApJ, 695, 1477
- Sakamoto et al. (2010) Sakamoto, K., Aalto, A., Evans, A.S., et al. 2010, ApJ, 725, L228
- White et al. (2003) White, G.J., Smith, H.A. et al., 2003, arXiv:astro-ph/0311611
- Weiß et al. (2007) Weiß A., Downes, D., Neri, R., et al. 2007, A&A 467, 955
- Wilson & Rood (1994) Wilson, T. L. & Rood, R. 1994, ARA&A, 32, 191
- Yusef-Zadeh & Morris (1987) Yusef-Zadeh, F. & Morris, M. 1987, ApJ, 320, 545
- Yusef-Zadeh et al. (2001) Yusef-Zadeh, F., Stolovy, S. R., Burton, M., et al. 2001, ApJ, 560, 749