THE INFRARED PROPERTIES OF SOURCES MATCHED IN THE WISE ALL-SKY AND HERSCHEL ATLAS SURVEYS
Abstract
We describe the infrared properties of sources detected over 36 deg2 of sky in the GAMA 15-hr equatorial field, using data from both the Herschel Astrophysical Terahertz Large-Area Survey (H-ATLAS) and Wide-field Infrared Survey (WISE). With point-source depths of 34 and 0.048 mJy at m and m, respectively, we are able to identify % of the H-ATLAS sources in the WISE survey, corresponding to a surface density of deg-2. Approximately two-thirds of these sources have measured spectroscopic or optical/near-IR photometric redshifts of . For sources with spectroscopic redshifts at , we find a linear correlation between the infrared luminosity at m and that at m, with % scatter over orders of magnitude in luminosity, L⊙. By contrast, the matched sources without previously measured redshifts () have -m flux density ratios that suggest either high-redshift galaxies () or optically faint low-redshift galaxies with unusually low temperatures (). Their small -m flux ratios favor a high-redshift galaxy population, as only the most actively star-forming galaxies at low redshift (e.g., Arp 220) exhibit comparable flux density ratios. Furthermore, we find a relatively large AGN fraction (30%) in a m flux-limited subsample of H-ATLAS sources, also consistent with there being a significant population of high-redshift sources in the no-redshift sample.
Subject headings:
surveys – cosmology: observations — galaxies: high-redshift – infrared radiation – galaxies: statistics – galaxies: general1. INTRODUCTION
The advent of submillimeter astronomy has opened a new window into the Universe, allowing us to probe dusty star-forming galaxies at high redshift, as well as cold dust in nearby galaxies. Along with the recent success of the balloon-borne BLAST experiment (Pascale et al., 2008; Eales et al., 2009), the launch of the Herschel Space Observatory111Herschel is an ESA space observatory with science instruments provided by European-led Principal Investigator consortia and with important participation from NASA. (Pilbratt et al., 2010) allows us to probe wavelengths from to m to a spatial resolution of 10″. Its largest open-time key project, the Herschel Astrophysical Terahertz Large-Area Survey (H-ATLAS, Eales et al., 2010a), will observe 550 deg2 of sky and detect more than 300,000 galaxies.
Based upon a preliminary cross-identification with the Galaxy and Mass Assembly survey (GAMA, Driver et al., 2011) and Sloan Digital Sky Survey (SDSS, Abazajian et al., 2009), 50% of the sources detected in the H-ATLAS survey are at (Smith et al., 2011). In addition, an analysis of the FIR colors of the remaining H-ATLAS sources with flux densities above 35 mJy at m and detections at m and m suggests an average redshift of (Amblard et al., 2010; Lapi et al., 2011).
Another method of constraining the redshift distribution of FIR-selected sources is to look for counterparts in the near and mid infrared (NIR and MIR). Fleuren et al. (in prep) have performed source matching to survey data from the VISTA Kilo-degree Infrared Galaxy survey (VIKING, Sutherland et al., in prep), but these data only extend to m. Starting in December 2009, the Wide-field Infrared Survey Explorer222For a description of the WISE mission, see http://wise2.ipac.caltech.edu/docs/release/prelim/expsup/ (WISE, Wright et al., 2010) began its mission to observe the entire sky in four bands, ranging from to m, at 12″ resolution. Following the first public data release in April 2011, 24,000 deg2 of IR images and source catalogs became available to the public, including deg2 of sky in the equatorial plane covered by the H-ATLAS survey.
The purpose of this letter is to describe the infrared properties of identified WISE counterparts to H-ATLAS sources within the GAMA 15-hr field (G15). Throughout we will assume a concordance cosmology with km s-1 Mpc-1, , and (Spergel et al., 2007). In a subsequent paper, we will report WISE cross-identifications over the entire H-ATLAS area and perform spectral energy distribution (SED) fits to the matched sources.
2. DATA AND METHODOLOGY
Herschel observations of the G15 field include imaging data at , , and m from the SPIRE instrument, with respective beam FWHM of , , and (Griffin et al., 2010), as well as and m imaging from the PACS instrument (Poglitsch et al., 2010). The field subtends approximately 12∘ in right ascension and 3∘ in declination and is centered on the equatorial plane at hm. The H-ATLAS G15 source catalogue (Dunne et al., in prep) is constructed using the same method as the Science Demonstration Phase catalogue (Rigby et al., 2011). It contains 27,481 sources detected at in any of the three SPIRE bands and reaches point-source depths of , , and mJy at , , and m, respectively.
The WISE first public data release contains four-band coverage of the entire G15 field to point-source depths of , , , and mJy at , , , and m. The angular resolution in these bands is , , , and , respectively (Wright et al., 2010). There are 240,000 WISE sources within G15 detected at in at least one of the four WISE bands, corresponding to 0.14 WISE sources per ″-radius aperture. In the WISE preliminary release catalog, close pairs of sources are not deblended for separations 9″, so when a background or foreground source appears near an H-ATLAS source position, it will often be blended with the true counterpart.
In addition to the infrared data from WISE and H-ATLAS, the G15 region has spectroscopic redshifts from the GAMA survey (, Driver et al., 2011), and photometric redshifts obtained using optical/NIR photometry from SDSS, VIKING, and the UK Infrared Deep Sky Survey Large Area Survey (UKIDSS-LAS, Lawrence et al., 2007). These photometric redshifts are derived following Smith et al. (2011) and have typical redshift uncertainties of . Of the 27,481 H-ATLAS sources in the region, % have reliable spectroscopic redshifts and % have photometric redshifts.
As a result of the high space density of m sources, a naive matching to the H-ATLAS source positions will result in a non-negligible number of misidentifications. A significant fraction of these misidentifications will be foreground stars that are blue in all WISE bands and undetectable in H-ATLAS, so we can reduce the contamination rate of our matched catalog by considering only WISE sources with . The magnitude distribution of all background/foreground WISE sources is such that 20% are bluer than this limit, as compared to % of sources within ″ of an H-ATLAS position.
To estimate the fraction of H-ATLAS sources with detectable counterparts in the remainder of the WISE source catalog, we use the method of Fleuren et al., in prep, where the detection rate is given by,
| (1) |
where is the fraction of unmatched positions in the H-ATLAS catalog and is the fraction of unmatched random positions. Matching all WISE sources within ″ (within which we expect % of the true matches to lie) and using random positions within the G15 field, we find . This is larger than the value found in the SDSS galaxy catalog (, Smith et al., 2011), but smaller than in the VIKING band (, Fleuren et al., in prep). By contrast, we find within the subset of WISE sources with , suggesting that this color cut was effective in removing stars.
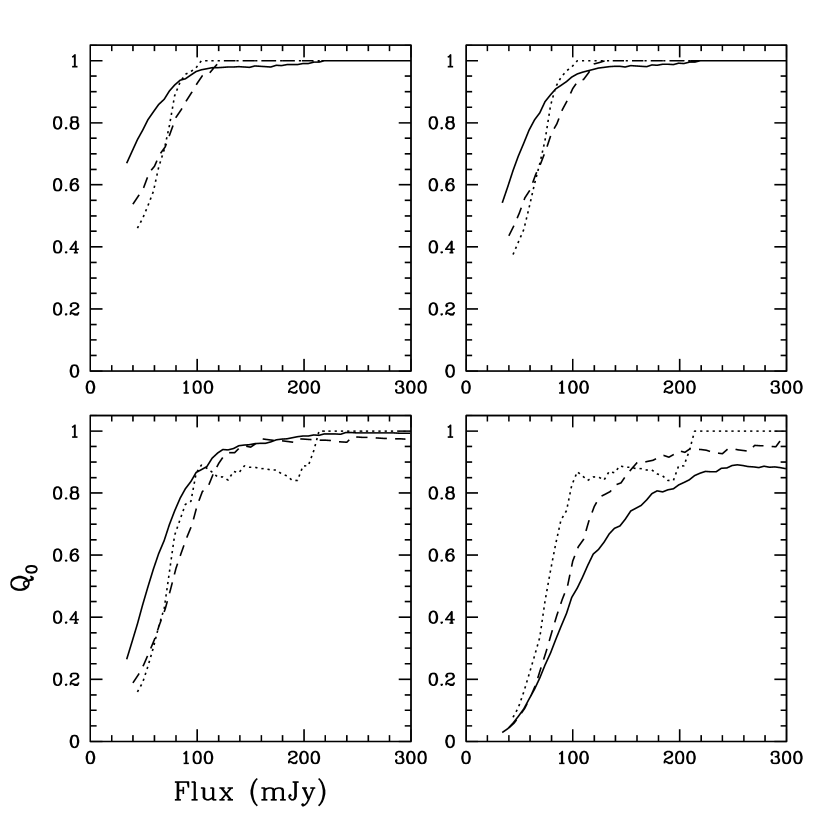
In Fig. 1, we use Eq. 1 to estimate the IR detection rate as a function of FIR flux density. For sources brighter than mJy at m, we find a WISE m counterpart % of the time. The majority of these sources (%) have measured spectroscopic or photometric redshifts , suggesting that the low-redshift mode of star-forming galaxies dominates sub-mm sources above this flux density. Below this FIR flux density, the NIR and MIR detection rates drop rapidly as the high-redshift mode accounts for an increasing fraction of the sub-mm sources (see Fig. 2).
Approximately % of the objects in our m-selected sample (Negrello et al., 2007), including % of sources brighter than mJy at m (Negrello et al., 2010; Hopwood et al., 2011), are expected to be strongly-lensed galaxies. Of the 46 such sources in the G15 region, 20% are undetected at and m, most likely because the m bandpass shifts higher in the blackbody curve at high redshift, while the rest-frame MIR flux density declines blueward of m (e.g., Rieke et al., 2009).
The identification of individual NIR and MIR counterparts is more subtle, as we want to eliminate as many of the false matches as possible. Here, we use the likelihood ratio technique of Sutherland & Saunders (1992), which was implemented for the H-ATLAS survey in Smith et al. (2011, hereafter S11). The likelihood that a given WISE source is a counterpart to an H-ATLAS source is a function of the radial probability distribution, , the m magnitude distribution of non-counterparts, , and the m magnitude distribution of detected H-ATLAS counterparts, :
| (2) |
where is given by
| (3) |
We measure directly from the WISE preliminary release catalog, while we determine by first measuring the magnitude distribution of m sources within ″ of the H-ATLAS source positions and then subtracting the magnitude distribution of background/foreground sources normalized by the area within this radius.
Following S11, we assume the astrometric uncertainty to be circularly symmetric and to have a dependence on the m signal-to-noise ratio (SNR) given by,
| (4) |
where FWHM″ is the Herschel beam width. While the WISE random astrometric uncertainties are negligible (), the WISE positions in the preliminary release catalog are known to suffer from highly non-Gaussian systematic offsets that can be as large as ″, so we apply a lower limit of ″.
Once we have computed the likelihood, , for a possible counterpart , we determine the reliability by summing over all possible counterparts,
| (5) |
We consider any m source with to be a reliable counterpart. After performing this procedure separately for WISE sources with star- and galaxy-like colors, we obtain a combined total of 13,898 WISE counterparts, or % of the H-ATLAS catalog. The expected number of false matches can be obtained with
| (6) |
We estimate that there are 369 false identifications in our sample, corresponding to a contamination rate of %. The majority of our IDs have galaxy-like colors, but we were able to identify objects with star-like colors () that weren’t already identified as galaxies with SDSS matching. This corresponds to an upper limit of % for the fraction of H-ATLAS sources identified as stars and detected in WISE.
Comparing the individual WISE identifications to SDSS cross-identifications, we find that % of the G15 H-ATLAS sources with SDSS identifications also had WISE identifications. The median separation between the WISE and SDSS sources is , consistent with the astrometric uncertainties in the current version of the WISE catalog. In addition, 6% of these sourcess have separations 3″, consistent with the expected contamination rates of the WISE (3%) and SDSS (5%) matched samples.
3. DEMOGRAPHICS
The redshift distribution of m-selected sources is likely bimodal, with populations of both moderately-star-forming galaxies at and high-redshift starburst galaxies at (Smith et al., 2011; Lapi et al., 2011). Because the latter are typically faint in the observed-frame optical and UV, the vast majority of objects with measured spectroscopic or photometric redshifts are in the low-redshift mode. Of the H-ATLAS sources with spectroscopic and photometric redshifts (see the inset of Fig. 3), we successfully identify % in WISE.
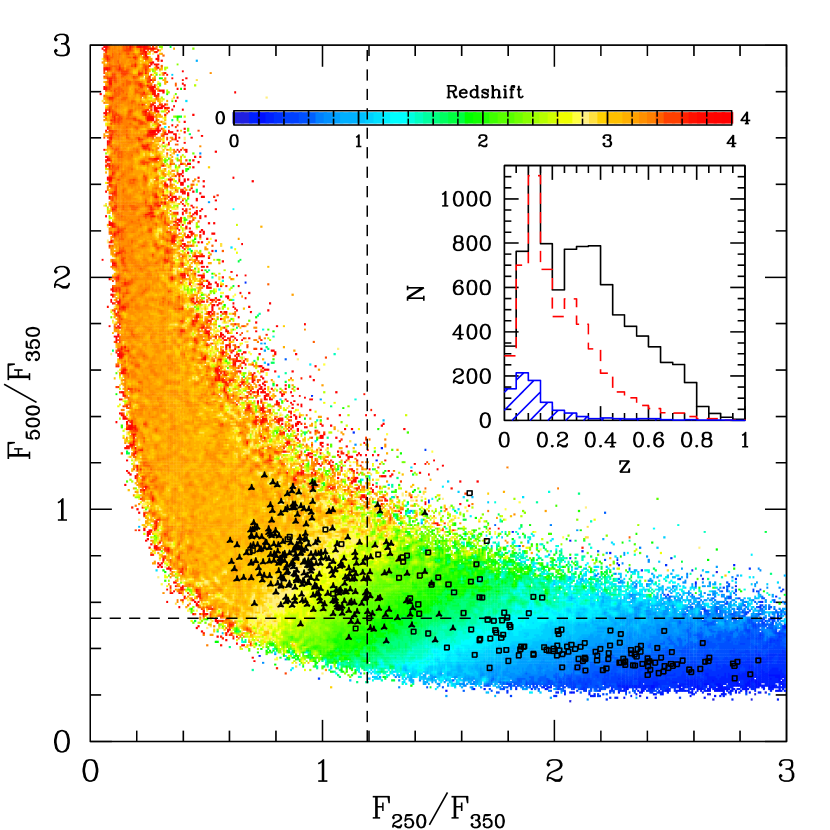
Although most of the WISE identifications with known redshifts are at (98%), such a sample is biased toward low redshift because redshift measurements require detectable flux in the UV, optical, or near-infrared. Approximately one-third (%) of the identified sources have reliable spectroscopic redshift and two-thirds (%) have photometric redshifts from optical/NIR data. For the remaining sources, we can estimate redshifts using their FIR flux density ratios (e.g., Amblard et al., 2010; Schulz et al., 2010), which give an indication of the location of the peak of the FIR dust emission. In Fig. 3, we compare the SPIRE colors of our matched catalog to a suite of modified blackbody spectral energy distributions (Amblard et al., 2010). We indicate on the plot the median flux density ratios of the H-ATLAS sources with WISE identifications but no redshifts (“no-redshift” sample, dashed lines), as well as the individual flux density ratios of 311 such sources with 3 detections in all three SPIRE bands.
The no-redshift sample has median FIR colors suggesting , while the subset with three-band SPIRE detections may have even higher redshifts, perhaps as large as . The redshifts derived using the Amblard et al. (2010) technique are highly uncertain, as redshift is degenerate with dust temperature and it is possible that these galaxies have typical dust temperatures different than K (which is typical of high-z SMGs, e.g. Chapman et al., 2005). However, in order for the no-redshift sample to be at , they would need to have very cold dust temperatures ( K) in addition to being very faint in the optical (). Although temperatures as low as K have been seen in H-ATLAS galaxies at , K is more typical (Dye et al., 2010). If the no-redshift sample has median temperatures typical of these low-redshift H-ATLAS galaxies, then our redshift estimate drops to .
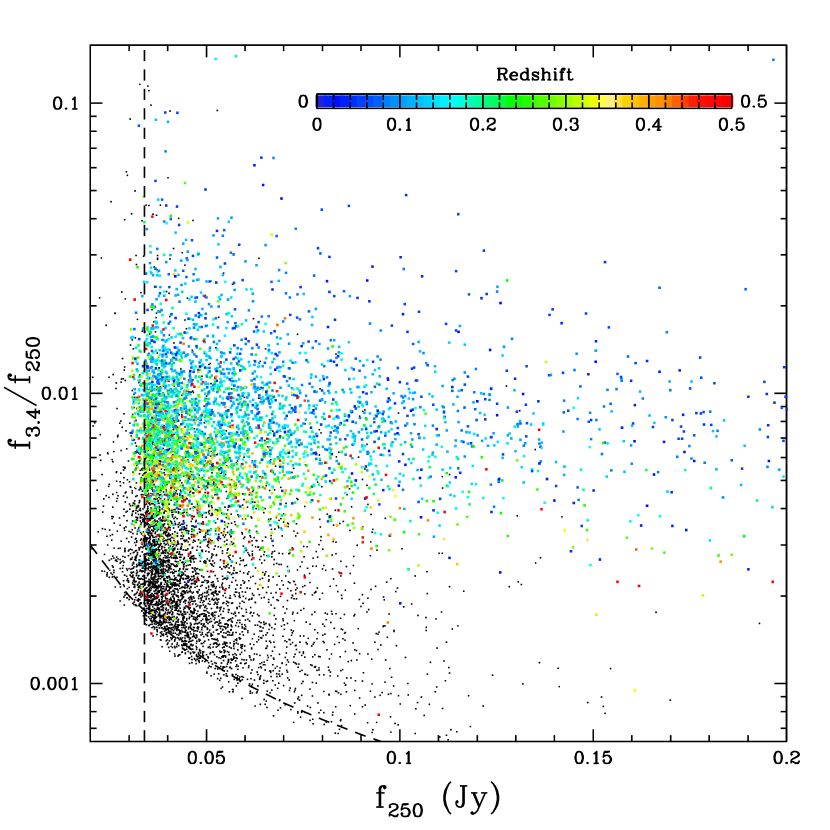
Further evidence that the no-redshift sources are at can be found in the -m ratios (see Fig. 2). H-ATLAS sources with GAMA redshifts have NIR-FIR flux density ratios that decrease from 0.009 at to 0.006 at . This trend, which continues toward higher redshift, is due primarily to the larger -correction at m than at m (e.g., Rieke et al., 2009). The median flux density ratio for the no-redshift sources, by comparison, is . Although low-redshift galaxies will occasionally exhibit such small NIR-FIR flux density ratios – Arp 220, for example, has – such objects are rare, actively star-forming, and unlikely to have dust temperatures as small as 15 K.
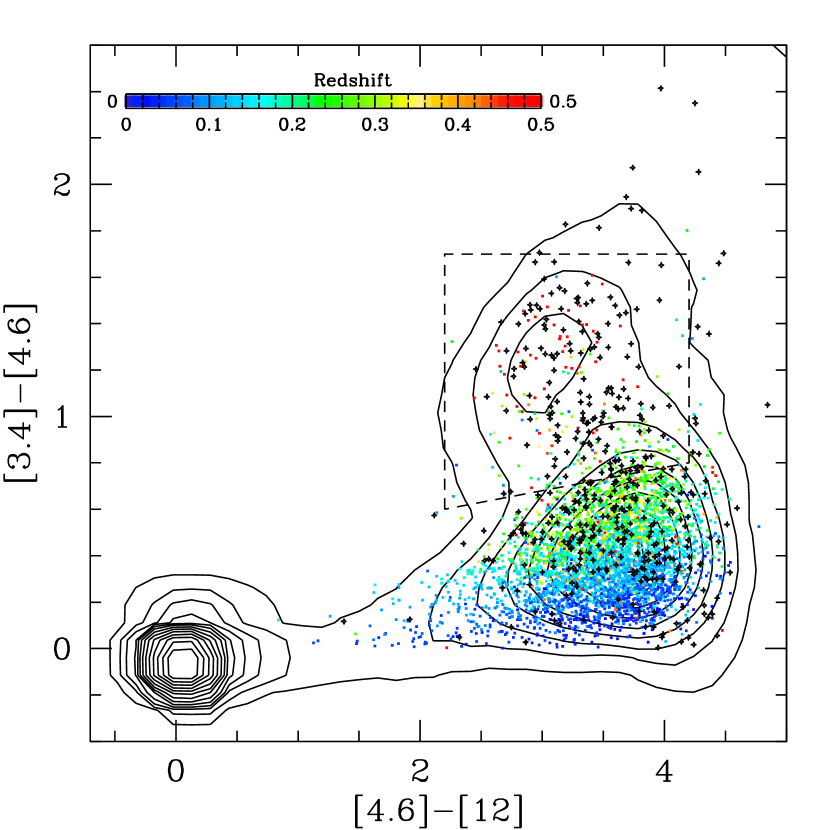
We can shed even further light on the properties of the no-redshift sample by examining their position in WISE color space (see Fig. 4). The technique is similar to those developed for a set of IRAC filters at comparable wavelengths (Sajina et al., 2005; Stern et al., 2005). It was demonstrated that the diagram can be divided into stars and early-type galaxies (lower left corner, ), star-forming galaxies (lower right corner), and active galactic nuclei (AGNs), where AGNs are selected largely based on their power-law emission in the NIR and MIR. This was adapted for WISE by Jarrett et al. (2011),
| (7) | |||
Of the 4,959 H-ATLAS sources with WISE identifications, , and detections in , , and m, the majority are star-forming galaxies, with % main sequence stars (which is consistent with the SDSS/H-ATLAS matching done by Thompson et al., 2010), and a small AGN fraction (),
For the % of no-redshift sources with three-band WISE photometry, we find a much larger AGN fraction (), but are subject to a selection bias toward AGNs due to their additional flux from warm dust at m (Hainline et al., 2011). Furthermore, emission from polycyclic aromatic hydrocarbons in high-redshift star-forming galaxies can occasionally mimic AGNs in their IRAC colors, leading to contamination in our AGN samples (e.g. Lacy et al., 2004; Donley et al., 2012). For comparison, Coppin et al. (2010) performed SED fits on a set of blank-field SMG samples and estimated that 15% of SMGs are dominated by an AGN in the mid-infrared.
4. FIR-NIR PROPERTIES
Emission from dust in the FIR is often used as an indicator of the total star formation rate in galaxies (e.g., Kennicutt, 1998), under the assumption that most of the dust heating is provided by young stars and that the star-forming regions are optically thick. The m bandpass samples the cooler dust emission, which can arise from both star-forming clouds and diffuse regions in the ISM (e.g., Eales et al., 2010b; Dunne et al., 2011). By contrast, m emission is dominated by stellar sources and is a probe of the stellar mass for galaxies without a strong AGN contribution (e.g., Stern et al., 2005).
In Fig. 5, we plot m luminosity as a function of m luminosity for H-ATLAS sources with spectroscopic redshifts, . We -correct m using a power law interpolation of the color. For the m flux densities, the majority of the galaxies in our sample do not have sufficient FIR flux density to obtain reliable dust temperatures, as is needed for a proper correction. Instead, we use the median dust temperature of K found by Dye et al. (2010) using PACS and SPIRE data from the H-ATLAS SDP of 1,346 sources. Although the limit of the GAMA spectroscopic survey restricts the range of luminosities that can appear on the plot, we estimate that GAMA misses only % of matched galaxies based upon the deeper () subsample of H-ATLAS galaxies with photometric redshifts.
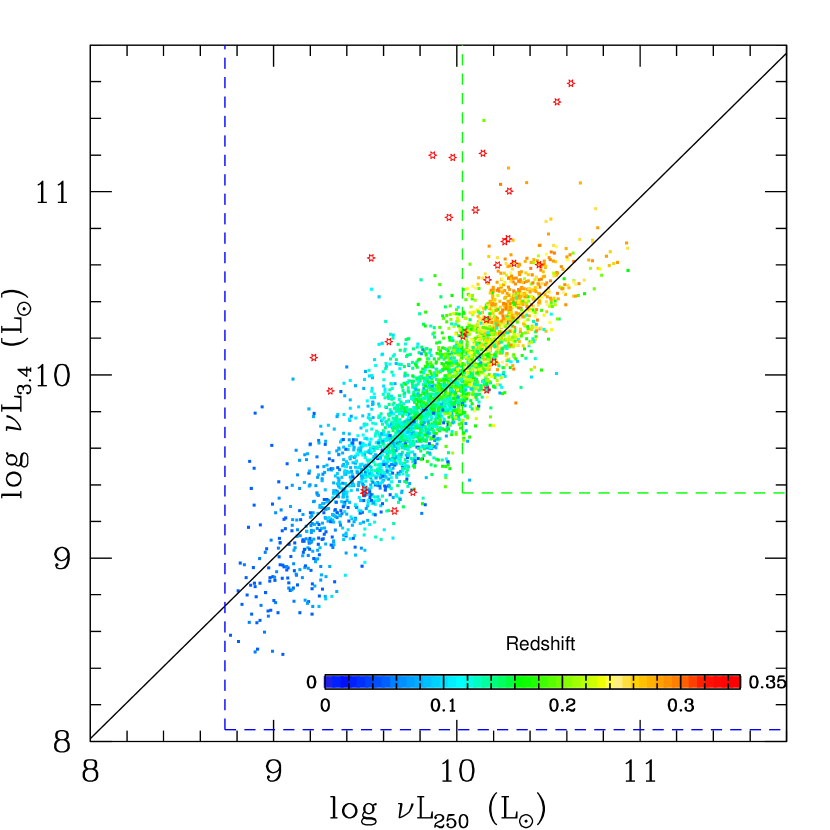
We find that the majority of the IR-color-selected AGN (red points) lie above the relationship for star-forming galaxies, as will contain a non-negligible contribution from hot dust emitting near the central black hole in addition to emission from low-mass stars. However, if we exclude AGNs, we find an approximately linear correlation, with a best-fit power law index, . The quoted systematic uncertainties on the power law index were determined by allowing for a range of possible dust temperatures, K, when performing m -corrections. The intrinsic scatter about this relationship is dex, or 50%.
The existence of a linear correlation between and across one and a half decades in luminosity suggests a close relationship between the cold dust probed by the FIR and the stellar mass probed by the NIR. Previous indications with Herschel have shown the m luminosity density to tightly correlate with both the m luminosity density, a star formation rate indicator, and the total infrared luminosity (Elbaz et al., 2010). This fact, coupled with a linear correlation between stellar mass and star formation rate for the general star-forming galaxy population (Daddi et al., 2007; Elbaz et al., 2007; Noeske et al., 2007, Donoso et al., in prep), suggests that the majority of the low-redshift H-ATLAS sources are actually “normal” star-forming galaxies.
References
- Abazajian et al. (2009) Abazajian, K. N. et al. 2009, ApJS, 182, 543
- Amblard et al. (2010) Amblard, A. et al. 2010, A&A, 518, L9+
- Chapman et al. (2005) Chapman, S. C., Blain, A. W., Smail, I., & Ivison, R. J. 2005, ApJ, 622, 772
- Coppin et al. (2010) Coppin, K. et al. 2010, ApJ, 713, 503
- Daddi et al. (2007) Daddi, E. et al. 2007, ApJ, 670, 156
- Donley et al. (2012) Donley, J. L. et al. 2012, arXiv:astro-ph/1201.3899
- Driver et al. (2011) Driver, S. P. et al. 2011, MNRAS, 413, 971
- Dunne et al. (2011) Dunne, L. et al. 2011, MNRAS, 417, 1510
- Dye et al. (2010) Dye, S. et al. 2010, A&A, 518, L10+
- Eales et al. (2009) Eales, S. et al. 2009, ApJ, 707, 1779
- Eales et al. (2010a) —. 2010a, PASP, 122, 499
- Eales et al. (2010b) Eales, S. A. et al. 2010b, A&A, 518, L62+
- Elbaz et al. (2007) Elbaz, D. et al. 2007, A&A, 468, 33
- Elbaz et al. (2010) —. 2010, A&A, 518, L29+
- Griffin et al. (2010) Griffin, M. J. et al. 2010, A&A, 518, L3+
- Hainline et al. (2011) Hainline, L. J., Blain, A. W., Smail, I., Alexander, D. M., Armus, L., Chapman, S. C., & Ivison, R. J. 2011, ApJ, 740, 96
- Hopwood et al. (2011) Hopwood, R. et al. 2011, ApJ, 728, L4+
- Jarrett et al. (2011) Jarrett, T. H. et al. 2011, ApJ, 735, 112
- Kennicutt (1998) Kennicutt, Jr., R. C. 1998, ApJ, 498, 541
- Lacy et al. (2004) Lacy, M. et al. 2004, ApJS, 154, 166
- Lapi et al. (2011) Lapi, A. et al. 2011, ApJ, 742, 24
- Lawrence et al. (2007) Lawrence, A. et al. 2007, MNRAS, 379, 1599
- Negrello et al. (2007) Negrello, M. et al. 2007, MNRAS, 377, 1557
- Negrello et al. (2010) —. 2010, Science, 330, 800
- Noeske et al. (2007) Noeske, K. G. et al. 2007, ApJ, 660, L43
- Pascale et al. (2008) Pascale, E. et al. 2008, ApJ, 681, 400
- Pilbratt et al. (2010) Pilbratt, G. L. et al. 2010, A&A, 518, L1+
- Poglitsch et al. (2010) Poglitsch, A. et al. 2010, A&A, 518, L2+
- Rieke et al. (2009) Rieke, G. H., Alonso-Herrero, A., Weiner, B. J., Pérez-González, P. G., Blaylock, M., Donley, J. L., & Marcillac, D. 2009, ApJ, 692, 556
- Rigby et al. (2011) Rigby, E. E. et al. 2011, MNRAS, 415, 2336
- Sajina et al. (2005) Sajina, A., Lacy, M., & Scott, D. 2005, ApJ, 621, 256
- Schulz et al. (2010) Schulz, B. et al. 2010, A&A, 518, L32+
- Smith et al. (2011) Smith, D. J. B. et al. 2011, MNRAS, 416, 857
- Spergel et al. (2007) Spergel, D. N. et al. 2007, ApJS, 170, 377
- Stern et al. (2005) Stern, D. et al. 2005, ApJ, 631, 163
- Sutherland & Saunders (1992) Sutherland, W. & Saunders, W. 1992, MNRAS, 259, 413
- Thompson et al. (2010) Thompson, M. A. et al. 2010, A&A, 518, L134+
- Wright et al. (2010) Wright, E. L. et al. 2010, AJ, 140, 1868