The black hole candidate XTE J1752-223 towards and in quiescence: optical and simultaneous X–ray – radio observations
Abstract
We present optical, X–ray and radio observations of the black hole transient (BHT) XTE J1752-223 towards and in quiescence. Optical photometry shows that the quiescent magnitude of XTE J1752-223 is fainter than 24.4 magnitudes in the i′-band. A comparison with measurements of the source during its 2009-2010 outburst shows that the outburst amplitude is more than 8 magnitudes in the i′-band. Known X–ray properties of the source combined with the faintness of the quiescence optical counterpart and the large outburst optical amplitude point towards a short orbital-period system (P) with an M type (or later) mass donor, at a distance of 3.5d8. Simultaneous X–ray and radio data were collected with Chandra and the EVLA, allowing constraints to be placed on the quiescent X–ray and radio flux of XTE J1752-223. Furthermore, using data covering the final stage of the outburst decay, we investigated the low luminosity end of the X–ray – radio correlation for this source and compared it with other BHTs. We found that XTE J1752-223 adds to the number of outliers with respect to the ‘standard’ X–ray – radio luminosity relation. Furthermore, XTE J1752-223 is the second source, after the BHT H1743322, that shows a transition from the region of the outliers towards the ‘standard’ correlation at low luminosity. Finally, we report on a faint, variable X–ray source we discovered with Chandra at an angular distance of 29 to XTE J1752-223 and at a position angle consistent with that of the radio jets previously observed from the BHT. We discuss the possibility that we detected X–ray emission associated with a jet from XTE J1752-223.
keywords:
stars: individual (XTE J1752-223) — accretion: accretion discs — stars: binaries — X–rays: binaries1 Introduction
XTE J1752-223 was discovered as a transient source in the Galactic Centre region by the Rossi X–ray Timing Explorer (RXTE), on 2009 October 23 (Markwardt et al., 2009b). It was soon proposed to be a Galactic black hole candidate (Markwardt et al., 2009a), i.e., a binary system where a black hole (BH) is accreting matter from a companion star. Most black hole candidates are transient sources (black-hole transients, BHTs) that occasionally undergo outbursts. During outbursts these sources can show a characteristic evolution through various ‘states’, defined on the basis of their strongly correlated spectral and variability properties (see, e.g., Remillard & McClintock 2006, Belloni 2010). After the discovery, XTE J1752-223 was monitored by the RXTE, Swift and MAXI satellites: the X–ray behaviour of the source during the outburst matched the typical phenomenological picture for BHTs, confirming XTE J1752-223 as strong accreting black hole candidate (Nakahira et al. 2010, Muñoz-Darias et al. 2010, Shaposhnikov et al. 2010, Curran et al. 2011). Based on the X–ray spectral and timing properties of XTE J1752-223, Shaposhnikov et al. (2010) also report a mass estimate for the BH, M M⊙ and the distance to the source (although the systematic uncertainties of these estimates could be large).
A bright optical counterpart to XTE J1752-223 was identified by Torres et al. (2009a) based on the Swift position and later confirmed through optical spectroscopy by Torres et al. (2009b). Two radio sources were detected at a position consistent with the optical one (Brocksopp et al., 2010) which were initially interpreted as a decelerated jet and its receding counterpart (Yang et al., 2010). A combination of radio and optical observations with accurate astrometry allowed Miller-Jones et al. (2011b) to locate the radio core of the source, at R.A. = , Dec. = . This position lies to the southeast of the two jet components previously observed, which were then re-interpreted as two ejection events. The core position was recently confirmed by Yang et al. (2011), who also report on the radio detection of a third jet component.
After transiting through all the canonical states of a BHT, XTE J1752-223 faded towards quiescence in July 2010 (Russell et al., 2012).
The quiescent state of BHTs was initially considered as an extension towards low luminosities (1030-1033 ) of the ‘hard state’, i.e. a spectral state where the X–ray spectrum is dominated by a power-law component with index . Later, a number of BHTs were found to show softer spectra in quiescence compared to the hard state, suggesting that the former can be considered a state on its own (e.g., Jonker et al. 2004, Tomsick et al. 2004). Still, because of their low luminosities at all wavelengths, it has been challenging to collect high quality spectral data to constrain the properties of quiescent BHTs.
| Obs ID | Observing | MJD | Time on | Count rate | Detected #source counts |
|---|---|---|---|---|---|
| date | (days; UTC) | source (ks) | 0.3-7 keV (cnt s-1) | 0.3-7 keV | |
| 11053 | 2010 Jul. 12 | 55389.63922 | 6.36 | 44 | |
| 12310 | 2010 Jul. 20 | 55397.07034 | 13.6 | 548 | |
| 11055 | 2010 Jul. 26 | 55403.24697 | 31.4 | 20 | |
| 11056 | 2010 Aug. 02 | 55410.27429 | 88.9 | 79 |
The hard state is also associated with the presence of radio emission, with a flat or slightly inverted spectrum that, owing to the high brightness temperature, is generally thought to originate from a compact jet. The X–ray emitting accretion flow and the radio emitting jet are known to be intimately connected: Gallo et al. (2003) and Corbel et al. (2003) found that several BHTs follow a correlation between the X–ray and radio luminosity (LX and LR respectively) in the form LL. The power-law index was later refined to LL (Gallo et al., 2006). The correlation was initially thought to be universally valid for all BHTs, but in recent years a number of outliers have been found (see Calvelo et al. 2010 for an updated compilation of sources). For most of the outliers it is not established yet whether they follow the correlation at a lower normalization or a correlation with a different slope. The work of Jonker et al. (2010) and Coriat et al. (2011) on the outlier H1743322 has shown that a reconnection of the the ‘outliers branch’ with the standard correlation is also possible: H1743322 in fact lies on a steeper correlation than LL at high luminosity (Jonker et al., 2010), but undergoes a transition back to the canonical correlation as the luminosity decreases below (Coriat et al., 2011).
This indicates a change-over between two accretion regimes when the source moves from a high-luminosity to a low-luminosity hard state. Following the X–ray – radio correlation across a broad range in luminosity for other BHTs may show whether similar transitions are a common feature among this class of sources and provide new elements to our understanding of the accretion mechanism at different accretion rates, including in the low-luminosity quiescent regime. It may also help us understand why different sources follow different X–ray – radio correlations.
Here, we report on contemporaneous Chandra X–ray and Expanded Very Large Array (EVLA) radio observations of XTE J1752-223 aimed at following the X–ray and radio light curves and establishing the X–ray – radio correlation during the final part of the decay towards quiescence. We also present one Very Long Baseline Array (VLBA) detection and optical observations of XTE J1752-223 in quiescence, providing information about the system’s orbital period and distance.
2 Observations, data reduction and results
2.1 Chandra X–ray observations
We observed XTE J1752-223 with the Chandra satellite using the
back–illuminated S3 CCD–chip of the Advanced CCD Imaging
Spectrometer (ACIS) detector (Garmire 1997) on
four occasions during the decay towards quiescence (see Figure 1 and Table 1). During all the observations the ACIS–S3 detector was
windowed, providing a frame time of 0.4104 s.
We have reprocessed and analysed the data using the CIAO
software developed by the Chandra X–ray Center111http://cxc.cfa.harvard.edu/ciao4.3/. Since, by design, the source position falls near the optical
axis of the telescope, the size of the point spread function is smaller
than the ACIS pixel size. Therefore, we follow the method of
Li et al. (2004) implemented in the CIAO 4.3 tool
acis_process_events to improve the image quality of the ACIS
data.
In our analysis we
have selected events only if their energy falls in the 0.3–7 keV
range. All data have been used, as background flaring is very weak or
absent in all data. The last observation (ID 11056) has been performed
with the datamode set to VFAINT. This means that pulse height
information in a 5x5 pixel region around the event is telemetered
down, allowing for a more rigorous cleaning of background events
caused by for instance cosmic rays.
Using wavdetect we detected XTE J1752-223 in each of the observations. We
selected a circular region of 10′′ radius centred on the
accurately known source position (Miller-Jones et al., 2011b) to extract
the source counts for the first two observations (Obs IDs 11053 and
12310). The longer, deeper, exposures of the last two observations
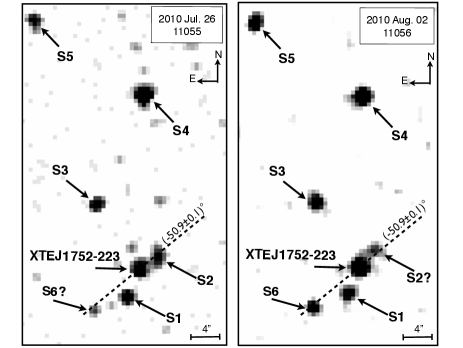
revealed faint sources near the position of XTE J1752-223 (Figure 2). Therefore, we used a smaller extraction radius of 15.
In order to correct the source flux in these latter two observations for the small extraction radius, we used the arfcorr command in CIAO.
For all four Chandra observations, we used a circular
region with a radius of 10′′ on a source-free region of the CCD
to extract background counts. The redistribution response file is the
same for the source and background region but we have made auxilliary
response matrices for the source region of each of the observations
separately. The net, background subtracted, source count rate for each
observation is given in Table 1.
Using xspec version 12.4.0ad (Arnaud 1996) we fit
the spectra of XTE J1752-223 using Cash statistics
(Cash 1979) modified to account for the
subtraction of background counts, the so called
W–statistics222see
http://heasarc.gsfc.nasa.gov/docs/xanadu/xspec/manual/ for all four
observations. We used an absorbed power–law model (pegpwrlw in xspec) to describe the data.
Due to the relatively low number of detected counts, we fixed the interstellar
extinction during the fits to 5 cm-2 found by
Curran et al. (2011). The power-law index and normalisation
were allowed to float. The results of our spectral analysis are listed in Table 2.
We note that the goodness percentage is in all cases far from the nominal 50%. However, by visually inspecting the spectra there is no clear reason to reject the fits. Possibly the low number of counts is responsible for the discrepant goodness values.
| Obs ID | PL index | Unabs. 0.5–10 keV flux | Goodness |
|---|---|---|---|
| erg-1 cm-2 s-1 | percent | ||
| 11053 | 1.60.5 | 0 | |
| 12310 | 1.60.1 | 91 | |
| 11055 | 1.90.5 | 20 | |
| 11056 | 1.70.2 | 11 | |
| 5556a | 1.8 | ( | 10 |
a Fit using the spectra of 11055 and 11056 combined.
2.2 Quiescent X–ray emission from XTE J1752-223
The X–ray spectra we acquired are dominated by a power-law component, indicating that the source was in a hard spectral state at the time of the observations. As shown in Table 2, the power-law index is 1.6 in the first two observations (11053 and 12310), while the last two observations (11055 and 11056) present a slightly softer spectrum (although is consistent with a constant value across the observations at the 1 level).
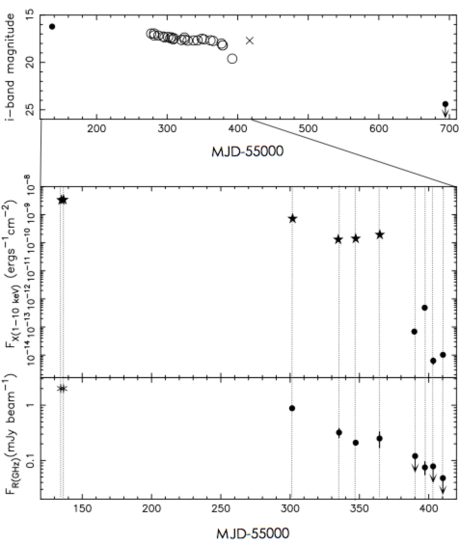
The light curve in Figure 1 shows the unabsorbed X–ray flux from XTE J1752-223, from our Chandra observations at the beginning of the quiescent phase and from RXTE observations performed earlier in the outburst. The unabsorbed flux on 2010 Jul. 12 was the faintest observed from this source since the beginning of the outburst, (7.02.0)10-14 in the 0.5-10 range. In the following week XTE J1752-223 experienced a re-brightening by (nearly) one order of magnitude, reaching (6.40.6)10-13 on 2010 Jul. 20. Six days later, on Jul. 26, the source had faded again down to (1.00.2)10-14 . The flux level at the time of our last observation, on 2010 Aug. 02, is consistent (within 2) with that shown on Jul. 26 (see Table 2), suggesting a flattening of the light curve. Despite the large errorbars, the flux level in the last two observations is in fact inconsistent with a constant decay after the 2010 Jul. 20 flare. This supports the conclusion that the source has reached quiescence (see discussion in Section 3).
| Label | Chandra name | R.A | Dec. | Count rate (cnt s-1) | R.A. | Dec. |
|---|---|---|---|---|---|---|
| (Chandra) | (Chandra) | (i′-band) | (i′-band) | |||
| S1 | CXOU J175215.1-222035 | (2.60.5)10-4 | ||||
| S2 | CXOU J175214.8-222030 | (5.81.3)10-4 | ||||
| S3 | CXOU J175215.4-222023 | (5.60.8)10-4 | ||||
| S4 | CXOU J175215.0-222010 | (8.81.0)10-4 | ||||
| S5 | CXOU J175215.9-222001 | (4.30.7)10-4 | ||||
| S6 | CXOU J175215.4-222036 | (2.10.5)10-4 |
2.3 New Chandra sources in the vicinity of XTE J1752-223
Figure 2 shows the two deepest images we acquired with Chandra, 11055 and 11056 (see Table 1). Six unidentified sources are detected in the vicinity of XTE J1752-223, labeled S1 to S6 (see also Table 3). The closest to XTE J1752-223 is CXOU J175214.8-222030 (S2), detected only in the observation 11055 with 10 net counts at an angular separation of 29 from XTE J1752-223. The source position provided by wavdetect defines a position angle with respect to XTE J1752-223 of -527 degrees. The significance on the flux measurement from wavdetect is 4.1 . In the 0.3-7 band, the probability of finding the source by chance is less than 310-15, corresponding to more than 8 in Gaussian statistics. S2 is not significantly detected by wavdetect in any other of our Chandra observations, although visual inspection of the deepest one, 11056, shows a faint source close to the position of S2 in 11055. Considering a 1′′ radius circle (Chandra 95% encircled energy radius) centred by eye on this source provides counts in the 03-7 band. The estimate of the background is such that, from Poisson statistic only, the probability that the source is due to a statistical fluctuation of the background is less than .
By considered the same 1′′ radius circle, we calculated 95% confidence upper limits to the count rate of S2 in all the observations where it was not detected.
The upper limits are summarized in Table 4. Count rates were transformed into unabsorbed fluxes by assuming N and a power-law spectrum with a photon index of 1.6 (similarly to the X–ray spectrum of the jet feature observed by Corbel et al. 2005 in H1743-322).
The source CXOU J175215.4-222036 (S6) is also detected only once, in the deepest observation 11056. The 4 counts collected in 11055 at the source position do not provide a significant detection, as there is a Poissonian probability of 13% to detect as many counts from S6 if the source was at the same flux level as in 11056.
2.4 Optical observations
We collected three observations of XTE J1752-223 in the i′ and I (CTIO) bands, with the Inamori-Magellan Areal Camera and Spectrograph (IMACS) at the Magellan Baade telescope in Cerro Las Campanas on 2009 Nov. 2 (5 s exposure, seeing 08), 2010 Aug. 31 (3 exposures of 180 s each, seeing 13) and 2011 May 13 (300 s-long deep exposure plus 5 s-long exposure for astrometry, seeing 07). The images were corrected for bias and flat-fielded with standard routines running in midas 333http://www.eso.org/sci/software/esomidas/.
An astrometric solution was obtained (using midas) against entries from the third U.S. Naval Observatory CCD Astrograph Catalog (UCAC3; Zacharias et al. 2010), considering only sources that are not saturated on the CCD and appear stellar and unblended. The astrometric solution was fitted for the reference point position, the scale and the position angle, obtaining root-mean-square (rms) residuals of 003 for the 2009 Nov. 2 and 2011 May 13 images, and 005 for the 2010 Aug. 31 exposure. The 300 s exposure on 2011 May 13 was astrometrically calibrated using the 5 s one as a secondary catalogue. The final astrometric solution was calculated on stars with UCAC3 fit model magnitudes in the 14-16.5 range, for which the positional accuracy of UCAC3 is estimated to be 001 (Zacharias et al., 2010). In addition, the systematic uncertainty in tying the UCAC3 stars to the International Celestial Reference System (ICRS) is 0.005′′ (Zacharias et al., 2010). For the accuracy of our stellar positions we adopt the linear sum of the residuals of the astrometry and the accuracy of the catalogue (as the latter is potentially a systematic error): the resulting positional accuracy at 1 across different observations ranges between 0046 and 0065 on both right ascension and declination.
The photometry was performed through point spread function (psf) fitting, using daophot II (Stetson, 1987) running within midas. The absolute photometry of three comparison stars labeled C1, C2, C3 in Miller-Jones et al. (2011b) (with i′-band magnitudes of 13.62, 14.53 and 14.38 respectively) was used to determine the i′-band photometric calibration. The photometry of the 2010 Aug. 31 image could not be calibrated due to the lack of observations of photometric standard stars in the I (CTIO) filter.
| Obs ID | Observing Date | Unabs. 0.3-7 flux |
|---|---|---|
| () | ||
| 11053 | 2010 Jul. 12 | 17.8 |
| 12310 | 2010 Jul. 20 | 5.1 |
| 11055 | 2010 Jul. 26 | 4.6 |
| 11056 | 2010 Aug. 2 | 2.6 |
2.5 Optical outburst amplitude of more than 8 magnitudes
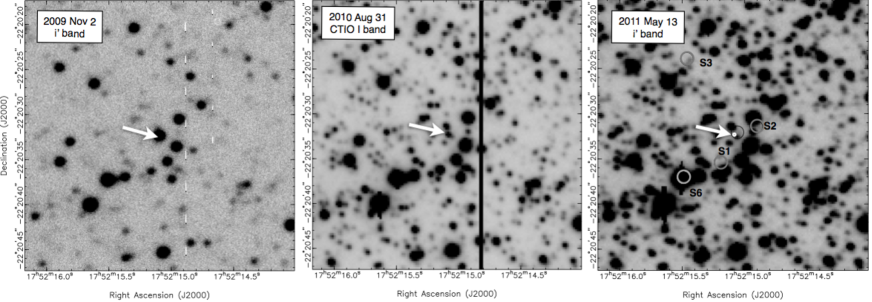
Figure 3 shows 30′′30′′ finding charts from our i′ and I-band observations, where the optical counterpart to the radio core of XTE J1752-223 (R.A., Dec., Miller-Jones et al. 2011b) is indicated by arrows. The first observation, from 2009 Nov. 2 (Figure 3, left panel), was taken during the first part of the 2009 X–ray outburst, when the source was in a low-hard spectral state (Nakahira et al. 2010, Muñoz-Darias et al. 2010). Accurate astrometry of this image has been used by Miller-Jones et al. (2011b) in order to locate the radio core of XTE J1752-223. The i′-band magnitude of XTE J1752-223 measured with our psf photometry in this observation is 16.290.01, consistent with the measurement obtained from aperture photometry by Miller-Jones et al. (2011b). The second observation (Figure 3, middle panel) was performed on 2010 Aug. 31, and shows the fading of the source towards quiescence, after the optical re-brightening occurred on 2010 Aug. 8 (Corral-Santana et al. 2010a, Corral-Santana et al. 2010b). In the third observation (Figure 3, right panel), taken on 2011 May 13 after almost one year of quiescence, the optical counterpart to XTE J1752-223 it is not detected anymore down to a limiting magnitude of 24.4 (3 upper limit) in the i′ filter. Close neighbours to the optical counterpart are visible in the last two finders. One of them is within the Chandra error circle, at 04 to the X–ray position. Nonetheless, the association with XTE J1752-223 is ruled out by the radio position and by the variability observed from the actual optical counterpart to the source. The psf photometry is able to resolve the counterpart to XTE J1752-223 from those nearby stars in the observation taken during outburst, when those are outshone by the target’s light. A comparison of the magnitudes measured from our first and last observations shows that the drop in magnitude from outburst to quiescence is more than 8 magnitudes.
2.6 Optical counterparts to unidentified Chandra sources
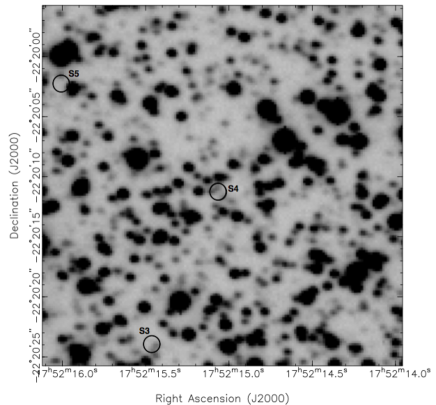
The 2011 May 13 finding chart in Figure 3 shows the position of some of the unidentified X–ray sources detected by Chandra during our observations ((S1, S2, S3, S6, see Section 2.2). Other two unidentified sources nearby (S4, S5) are shown in Figure 4. There is no clear i′-band counterpart to the faint X–ray source S2 detected close to XTE J1752-223, although there is a star near the edge of the 90% Chandra error-circle (06 radius), at 07 from the X–ray position (the 90% uncertainty on the optical position is 008). A brighter star is located a bit further, at 110. Unfortunately, none of our optical images is close in time to the Chandra observation 11055, where this source was brightest in the X–rays. For both S1 and S5, a faint source lies on the edge of the Chandra error-circle. S6 can be associated with a bright star, while S3 has two faint optical counterpart candidates, partly blended together. Two faint optical sources are also consistent with the position of S4. The position of the best candidate counterpart(s) to each Chandra source is reported in Table 3.
2.7 Radio observations: EVLA
The new Expanded Very Large Array (EVLA; Perley et al., 2009) was used to monitor the
decay of the outburst of XTE J1752-223 from 2010 April 15 through 2010 August
2, under program codes AM1039 and SB0329. With the newly-operational wideband
4–8 GHz receiver system, we were able to observe simultaneously in two
independent 128-MHz sub-bands (each comprising 64 channels of width 2 MHz) to
obtain spectral information at every epoch. To avoid the radio frequency
interference (RFI) known to exist below 4.5 GHz, and yet achieve the widest
feasible frequency separation, the two sub-bands were centred at 4.6 and
7.9 GHz. Once the source was no longer detected
in an individual sub-band, no spectral information could be derived. We then
switched the frequency setup in order to achieve the maximum possible sensitivity, observing
over a contiguous bandwidth of 256 MHz centred at 8.4 GHz. Throughout our
observing campaign, the array was in its most compact ‘D’ configuration, with an
angular resolution at frequency of 12′′ (6 GHz).
Data reduction was carried out using the Common Astronomy Software Application
(CASA; McMullin et al., 2007). The data were initially averaged down by a factor of 10
from the default 1 s integration time to make the data sets more manageable.
Baseline corrections were performed and bad data arising from shadowing,
instrumental issues, or RFI were edited out before beginning the calibration.
Bandpass and flux density calibration was carried out using 3C 286, setting the
flux scale according to the coefficients derived at the VLA in 1999
(Perley, 1999). Amplitude and phase gains were derived for all calibrator
sources, referencing the target source XTE J1752–223 to the calibrator
J1820–2528. OQ 208 was used as an unpolarized calibrator to derive the
polarization leakage terms and 3C 286 was used to calibrate the polarization
position angle. Finally, the calibration was applied to the target source,
which, following frequency-averaging by a factor of 8, was then subjected to
several rounds of imaging and self-calibration. Measured flux densities for XTE
J1752–223 are given in Table 5.
| Observation date | MJ1 | Frequency | Bandwidth | Flux density | Spectral index |
|---|---|---|---|---|---|
| (days; UTC) | (GHz) | (MHz) | (mJy beam-1 | ||
| 2010 Apr 15 | 4.6 | 128 | -0.70.1 | ||
| 7.9 | 128 | ||||
| 2010 May 19 | 4.6 | 128 | -0.50.4 | ||
| 7.9 | 128 | ||||
| 2010 May 31 | 4.6 | 128 | -0.30.4 | ||
| 7.9 | 128 | ||||
| 2010 Jul.13 | 4.6 | 128 | - | ||
| 7.9 | 128 | - | |||
| 2010 Jul.20 | 8.4 | 256 | - | ||
| 2010 Jul.26 | 8.4 | 256 | - | ||
| 2010 Aug.02 | 8.4 | 256 | - |
1 the MJD is at the mid-point of the observation. The errorbar reflects the observation length.
2 upper limits are on the 3 level.
2.8 Radio observations: VLBA
One epoch of VLBA data was also taken during the decaying hard state of XTE J1752–223, on 2010 June 17, under program code BM346. We observed with nine VLBA antennas (the Pie Town antenna was out of the array owing to a broken rail). We observed at 8.4 GHz in dual circular polarization, with the maximum available recording rate of 512 Mbps, corresponding to 64 MHz of observing bandwidth per polarization. The observations were phase referenced to the nearby calibrator source J1755–2232, from the third extension to the VLBA Calibrator Survey (Petrov et al., 2005, VCS-3;) and located from XTE J1752–223. We switched between target and calibrator with a cycle time of 3 min, substituting the VCS-5 (Kovalev et al., 2007) check source J1751–1950 for every eighth scan on the target. By observing a range of bright calibrator sources at differing elevations, for 30 min at the start and end of the observing run (aka geodetic blocks), we could better solve for unmodeled clock and tropospheric phase errors. The geodetic blocks were analysed using the Astronomical Images Processin System (AIPS)444http://www.aips.nrao.edu/index.shtml task DELZN, thereby improving the success of the phase transfer. Data reduction was carried out according to standard procedures within AIPS. The flux density of the phase reference source decreased substantially on the longer VLBA baselines, most probably due to scatter broadening. When fringe fitting for the phase reference source, no good solutions were found for the Mauna Kea (MK) and Saint Croix (SC) stations, and all data from these stations had to be discarded. XTE J1752-223 was marginally detected, at a level of 0.250.08 mJy beam-1 at the known source position (Miller-Jones et al., 2011b).
2.9 Upper limits to the radio quiescent flux
Assuming a radio spectrum of the form , our simultaneous detections in the 4.6 and 7.9 GHz-bands show a spectral index consistent with at the 1 level for the observations of 2010 May 31. On May 19 the spectral index was consistent with both 0 and -1 at the 2 level, while on Apr. 15 was inconsistent with 0 and consistent with -1 at the 3 level. This can be due to the presence of an optically thin ejection event during the source hard state.
The EVLA light curve in Figure 1 shows the fading of the radio counterpart to XTE J1752-223 at the end of the outburst. After May 31 (MJD 55347) the source is detected only once, corresponding to the X–ray re-brightening observed by Chandra (see Section 2.2). The most stringent upper limit to the quiescent radio flux of XTE J1752-223 was obtained on 2011 Aug. 2, when the 3 upper limit to the flux density at 8.4 GHz was 0.048 (Table 5).
2.10 The X–ray – radio correlation
We performed quasi-simultaneous (0.5 days apart) Chandra-EVLA observations on 2010 Jul. 13, 20, 26 and Aug. 2. Moreover, Russell et al. (2012) reports RXTE/PCA observations that are less than 0.6 days apart from our EVLA pointings on 2010 Apr. 15, May 19 and May 31 and from our VLBA detection on 2010 Jun. 17. Furthermore, two radio observations of XTE J1752-223 during the hard state, performed on 2009 Oct. 31 and Nov. 1 with the Australia Telescope Compact Array (ATCA), are reported by Brocksopp et al. (2009). Quasi-simultaneous RXTE detections (Russell et al., 2012) provides us with a total of ten X–ray –Aradio observations (see dashed lines in Figure 1) that we can use to investigate the behaviour of XTE J1752-223 on the X–ray – radio correlation for the hard state of BHTs. As shown by Jonker et al. (2004), the non-linearity of the X–ray – radio correlation makes the normalization dependent on the distance. In order to compare XTE J1752-223 with other sources, we calculated the X–ray (1-10 keV) and GHz radio luminosity assuming a distance of 3.5 kpc as well as a the typical distance of 8 kpc to the Galactic Centre (see discussion on the distance in Section 3.).
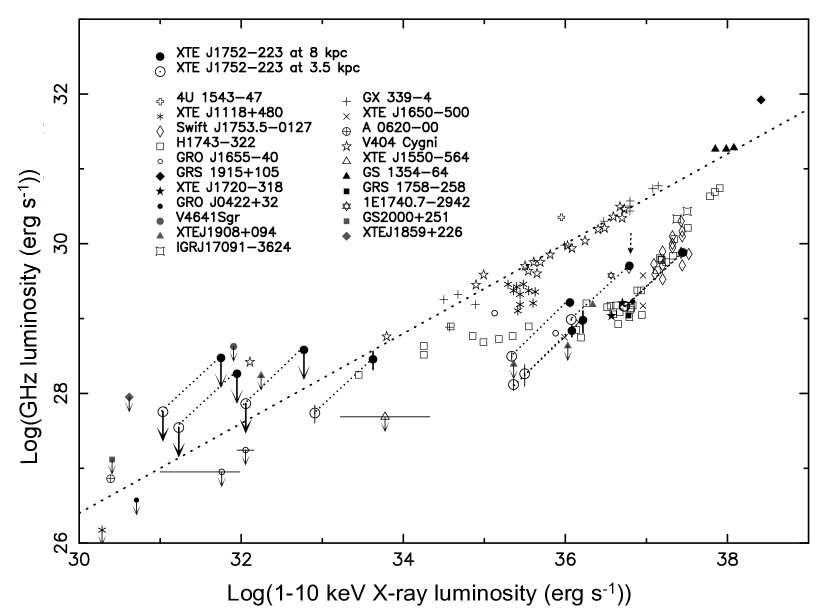
When converting the monochromatic radio flux density into a radio luminosity, we multiplied by a frequency of 5 GHz, under the assumption that the spectrum is flat in the GHz range. This assumption leads to an under-estimate of the luminosity for the observation taken on 2010 Apr. 15, when the spectrum was consistent with optically thin synchrotron emission (see Section 2.9 and below). The choice of the 5 GHz frequency has the purpose of comparing with the most updated LX-LR plot, reported by Calvelo et al. (2010). Figure 5 shows the X–ray – radio correlation that we obtained for XTE J1752-223 together with data from Calvelo et al. (2010) for GX 3394, 4U 154347, 1E1740.72942, A 062000, GS 135464, XTE J1118480 and V404 Cygni, all of which follow the ‘canonical’ X–ray – radio correlation, GRS 1915105, which may or may not be an outlier (see Coriat et al. 2011) and the ‘outliers’ XTE J1550564, XTE J1650500, GRO J165540, Cygnus X1, Swift J1753.50127, GRO J042232, GRS 1758254, XTE J1720318 and H1743322. For the latter, we have used the hard-state measurements from the work of Coriat et al. (2011). Observations of XTE J1908094 from Jonker et al. (2004) and recent radio upper limits from Miller-Jones et al. (2011a) for GRO J042232, XTE J1118480, GRO J165540, GS 2000451, XTE J1908094, XTE J1859226 and V4641 Sgr are also included.
Three of our radio observations did not result in a detection and provide upper limits to the radio flux. The upper limits are consistent with both a standard as well as an under-luminous correlation. On the other hand, the six points at an X–ray luminosity above 1035 are clearly under-luminous in radio with respect to the standard correlation. The intermediate point at L (depending on the distance) is located much closer to the standard correlation than the higher luminosity ones, resembling the behaviour of H1743322. For a distance of 8 kpc, the L point falls very well on the standard correlation while the higher luminosity points are located in the region of the (known) ‘outliers’. For this distance a transition from the ‘outliers region’ towards the canonical correlation seems to occur around the same luminosity as for H1743322. Excluding the ATCA detections, for which no uncertainty was reported, a fit to the five remaining detections with a single power-law is very poor (, 3 d.of.) and gives LL. Slightly better fits are obtained with two power-laws, one including the most luminous point and not the faintest, with an index (, 2 d.o.f.) and one including the least luminous detection but not the brightest, with (, 2 d.o.f.). Still, the fit is poor due to the scatter between the few points. Moreover, the fitted slope of the correlation on the outliers branch relies on the 2010 Apr. 15 observation, for which we are likely under-estimating the radio luminosity and which is not a good representative of the hard state. The fact that the spectral index was negative indicates contamination from an optically thin ejection event. Despite this, the observations reported by Brocksopp et al. (2009) confirm that XTE J1752-223 lies on the outliers branch at high luminosity.
3 Discussion
We have observed the BHT XTE J1752-223 towards the end of its 2009-2010 X–ray outburst, with the purpose of exploring the quiescent properties of the source and, in particular, the low-luminosity end of the X–ray – radio correlation. To this end we performed four simultaneous EVLA and Chandra observations, plus three EVLA observations and one VLBA observation that are simultaneous to RXTE pointings. After a short re-brightening, XTE J1752-223 reached a minimum X–ray flux level of (1.60.4)10-14 cm-2 (0.5-10 ) on 2010 Jul. 26. At this same flux level the source was found again one week later, in our last Chandra pointing.
The EVLA observations towards quiescence provide one detection corresponding to the X–ray re-brightening, and allow us to set an upper limit to the quiescent 8.5 GHz radio flux of 0.048 .
We also observed the source with the Magellan/IMACS instrument in the optical i′-band, almost one year after the end of the X–ray outburst. We could not detect the source down to a limiting magnitude of 24.4.
3.1 Distance
With the available data it is not possible to put solid constraints on the source distance. However, some indication of a reasonable distance range can be obtained by combining known empirical relations. Maccarone (2003) found that the transition from the hard to soft state at the end of a BHT outburst occurs at a bolometric luminosity that is around the 2.2% of the Eddington luminosity LEdd (with an uncertainty of 40%). Assuming a typical BH mass of 10 M⊙ we can compute and, following Maccarone (2003), the luminosity of XTE J1752-223 at the time of the transition from the soft to the hard state. Comparing this luminosity with the RXTE/PCA flux at the time of the transition we can obtain an estimate of the source distance. Russell et al. (2012) and Shaposhnikov et al. (2010) show that the RXTE count rate from the source was counts per second in the first hard state observation after the soft-to-hard state transition555As the transition requires several days, during which the source flux varies by a factor of 2, it is not straightforward to establish what is the luminosity at the transition to be used in the method of Maccarone (2003). This uncertainty on the time of the transition is included in the 40% uncertainty on the ratio with the Eddington luminosity indicated by the author. We have tested that, whatever observation we consider during the state transition of XTE J1752-223, we indeed measure consistent distances within 1.. The corresponding bolometric X–ray flux (for the bolometric correction we follow Maccarone 2003) is cm-2, from which we obtain a distance of . This is consistent at the 2 level with the distance of claimed by Shaposhnikov et al. (2010) on the basis of the source spectral and timing properties in X–rays. The above methods are both rather uncertain. Their agreement between 3.5 and 9 suggests that XTE J1752-223 is in the Galactic bulge or closer to us, but the boundaries of a likely distance range are hard to define. For this reason, we choose two nominal values: the 3.5 from Shaposhnikov et al. (2010) (which is probably a conservative lower limit, as will be shown below) and the distance of 8 typically assumed for a source in the Galactic bulge. Further in the discussion we will show that a consistent scenario for the multi-wavelength properties of XTE J1752-223 emerges within this distance interval, although, given the uncertainties on the relations we used, the extremes of this range are only indicative666Note that the NH towards XTE J1752-223 (0.5) is close to the Galactic one in the direction of the source(0.45, Dickey & Lockman 1990). As the Galactic latitude of XTE J1752-223 is b=2.1 degrees, the observed NH implies a lower limit to the source distance that is consistent with the 3.5 limit derived from the X–ray spectral and timing source properties (assuming a vertical dimension of the dust Galactic plane of 0.12, e.g. Greenberg et al. 1987)..
3.2 Companion star
The upper limit we measured on the quiescent i′-band magnitude makes a giant companion star in XTE J1752-223 very unlikely, as the source should be located outside of our Galaxy. For we obtain an extinction coefficient in the i′-band (following Güver & Özel 2009 and the extinction laws in Cardelli et al. 1989). For a G5 iii star the absolute magnitude is (Drilling & Landolt 2000, later spectral types are brighter, aggravating the problem). Given our observed magnitude and according to the definition of the distance modulus we conclude that the distance of a giant would be .
An ultra-compact binary scenario, i.e. with a white dwarf donor, is also ruled out by the detection of Hydrogen lines in the optical spectra in outburst (Torres et al., 2009a).
Thus, the companion star in XTE J1752-223 is most likely a main sequence or sub-giant star. Given our limit on the i′-band magnitude, the indications we found on the source distance confine the spectral type of the companion star to a type M or later: a distance of 8 gives an absolute magnitude for the secondary (reddening has been considered as above) which is true for a main sequence star later than M2 (Drilling & Landolt, 2000). If 3.5 , our i′-band non-detection implies that the spectral type has to be later than M5.
3.3 Orbital period
Since XTE J1752-223 most likely hosts a main sequence secondary star, we expect the source to follow the relation found by Shahbaz & Kuulkers (1998) between the V-band outburst amplitude V and the orbital period Porb (note the caveats mentioned by Miller-Jones et al. 2011c and below). A comparison of the limit to the quiescent i′-band magnitude ( mag) with observations in outburst indicates an outburst amplitude i8 magnitudes. The corresponding V depends on the spectrum of the disc, which dominates the optical emission in outburst, and on the spectrum of disccompanion star in quiescence. We can provide an upper limit to the orbital period by assuming that the disc is dominating both in outburst and in quiescence. van Paradijs & McClintock (1995) found that, on average, B-V0 for the accretion disc in a low mass X–ray binary. If V-I is also 0, Vi8 magnitudes and, according to the correlation of Shahbaz & Kuulkers (1998), P h.
As pointed out by Miller-Jones et al. (2011c), the correlation of Shahbaz & Kuulkers (1998) does not include the effect of the inclination. High inclination systems (such as MAXI J1659152) are fainter in the optical during outburst because only a small fraction of the disc surface is visible when the disc is seen edge on. As XTE J1752-223 probably hosts a BH, the lack of eclipses or dips still allows for quite a high inclination (80 degrees, Horne 1985). For this reason, although the large outburst amplitude points towards a lower inclination, we can not exclude a significant inclination effect on the Shahbaz & Kuulkers (1998) correlation. If this is the case, the orbital period of XTE J1752-223 would be even shorter that what we are calculating.
Independent support of our estimate of the distance and the orbital period comes from the correlation between Porb and the luminosity at the peak of an outburst found by Wu et al. (2010). The flux at the peak of the outburst of XTE J1752-223 was cm-2 in the 1-10 keV range (RXTE/PCA from Russell et al. 2012), which gives L L LEdd for a distance and a 10 M⊙ BH. Using the correlation of Wu et al. (2010), this gives ( P) h, consistent with the upper limit we derived from the optical outburst amplitude. For , P h, comparable to the shortest orbital period known for a BHT (MAXI J1659152, Kuulkers et al. 2011, Kennea et al. 2011). For 3.5 , the period is much shorter than the shortest known for a BHT, trespassing into the ultra-compact systems regime. The presence of hydrogen in outburst, however, rules out a hydrogen deficient donor. The distance to the source is, therefore, probably larger than 3.5 . The luminosity at the peak of the outburst would also be low at 3.5 with respect to typical BHTs. Nonetheless, given the uncertainties on the methods we used, we can not rule out such a low distance.
In summary, the spectral and timing properties of XTE J1752-223 and the X–ray luminosity at the transition from soft to hard state indicate a distance of roughly 3.5d8 , which translates into consistent estimates of the orbital period from two independent methods: the optical outburst amplitude and the X–ray outburst peak luminosity. The methods also suggest that 3.5 is a conservative lower limit and the source is likely to be further than that.
3.4 The X–ray – radio correlation
Using the indications we found on the source distance, we have calculated the X–ray and radio luminosity of XTE J1752-223 in order to compare the X–ray – radio correlation for this source with other BHTs. Figure 5 shows the correlation for a distance of 3.5 and 8 . The behaviour of XTE J1752-223 resembles that of H1743322, where a transition from the region of the ‘outliers’ to the standard correlation occurs when decreases. For d=8 , XTE J1752-223 seems to experience the transition close to the same luminosity where it occurs for H1743322, while for d=3.5 it transits at a lower luminosity. The transition was covered with many observations in the case of H1743322 (Coriat et al., 2011) and interpreted as a switch from a radiatively efficient accretion mechanism (on the ‘outliers’ branch) to a radiatively inefficient one (on the ‘standard’ correlation). It is possible that many BHTs are located on one branch or the other for the full range of luminosity covered within one outburst, or, in other words, that the hard state can be associated with a different accretion flow for different sources. On the other hand, the similarity between XTE J1752-223 and H1743322 suggests that the ‘switching’ behaviour of the latter may be shared by other outliers. It is worth noting that, based on our data, it is also possible that XTE J1752-223 does not ‘return’ to the LL correlation but crosses it at low luminosities.
Either way, XTE J1752-223 is the first BHT found to show evidence of a transition similar to that of H1743322. More data will be needed in order to confirm this result and to probe the low luminosity end of the X–ray – radio correlation better, for XTE J1752-223 and for other BHTs.
3.5 X–ray detection in quiescence?
The X–ray flux XTE J1752-223 on 2010 Jul. 26 and Aug. 2, when we observed it with Chandra for the last time, was (1.40.2)10-14 cm-2 (0.5-10 , corresponding to a luminosity of for a distance of ). The fact that we observed consistent flux levels in our last two observations suggests that the source had reached its quiescent level. Nonetheless, it is also possible that we found the source on a temporary plateaux and that it further faded after our observations. The optical counterpart to XTE J1752-223 was far from reaching its quiescent level at the time of our last Chandra pointing: the source flux dropped by more than 3-3.5 magnitudes in the i′-band after that moment, until it disappeared below 24.4 mag on 2011 May 3 (see Figure 1). In the case that we measured the quiescent X–ray flux level, this indicates that the decay of the outburst phase towards quiescence had an ‘inside-out’ development, starting with the fading of the X–ray source only later followed by the optical. Moreover, assuming we measured the quiescent X–ray flux, the quiescent luminosity for our estimate range of distances implies an orbital period longward of 10 hours, if XTE J1752-223 follows the trend between orbital period and quiescent X–ray luminosity reported by Garcia et al. (2001) and Gallo et al. (2008). Instead, if the true quiescent luminosity is lower than measured, then the inferred orbital period would be shorter and more compatible with the orbital period inferred above.
3.6 X–ray detection of a jet?
Finally, using our deep Chandra observations we discovered unidentified faint sources in the vicinity of XTE J1752-223. In particular, we detected faint X–ray emission at 29 from the source on 2010 Jul. 26 (source S2 in Figure 2 and Table 3). No clear optical counterpart corresponds to the X–ray position.
A possible scenario is that S2 was a transient event aligned by chance with XTE J1752-223. A flare from an unseen background star is unlikely, as the X–ray flux is too high with respect to the optical one. The ratio between X–ray and visual flux for a stellar flare, in fact, is typically Log. Given the observed X–ray flux from S2, the V-band magnitude of an unseen stellar counterpart should be 18.7, meaning in the i′-band (VI0.47 for an O5 star, increasing towards later types, Drilling & Landolt 2000). An object with this magnitude would be visible in our deep R-band observation. A chance alignment with an unknown background AGN, binary system or with some peculiar transient event is also rather unlikely due to the rarity of such events, but it can not be ruled out. Nonetheless, the proximity to XTE J1752-223, the position angle (see below) with respect to the BHT core compared to that of the radio jet ejections (Yang et al. 2010, Miller-Jones et al. 2011c,Yang et al. 2011), the morphology and the variability of S2 can also be interpreted as X–ray emission coming from a relativistic jet launched by XTE J1752-223.
Radio observations earlier in the outburst resolved two jet components from XTE J1752-223 (Yang et al. 2010, Miller-Jones et al. 2011b) probably ejected during the outburst at the time of the hard-to-soft transition, in January 2009 (Homan, 2010). A third one was recently identified by Yang et al. (2011). Besides the radio emission, relativistic jets from BHTs have been found to emit also in the X–rays, at large scales and long after the ejection event (the most extreme case is the BHT XTE J1550-564, Corbel et al. 2002, Tomsick et al. 2003, Kaaret et al. 2003). In the BHT H1743-322 (Corbel et al., 2005) Chandra observations revealed X–ray emission associated with ejecta previously detected in the radio, at an angular separation of a few arcseconds from the core of the source. Both the radio and X–ray radiation are thought to be synchrotron emission from particles accelerated by shocks within the jet.
The position for S2 from our Chandra observation 11055 indicates a position angle of degrees, which is consistent at the 1 level with the position angle of the radio jets, degrees (Miller-Jones et al. 2011b, Yang et al. 2011).
Although not significantly detected by wavdetect, fainter emission along the jet direction is visible in observation 11056 too (Figure 2). The upper limits to the X–ray flux from S2, obtained from the non-detections in the observation 11056 and in the ones previous to 11055 (see Section 2.2) are high enough that S2 may have had a constant flux level (or possibly re-brightened) between 2010 Jul. 20 (observation 12310) and 2010 Jul. 26 (observation 11055), while it has faded by at least a factor of 1.8 in the following seven days, until 2010 Aug. 2 (observation 11056). An X–ray brightening can be caused by a shock in the jet either caused by the collision of consecutive jets traveling at different velocities, by the interaction of the ejecta with the interstellar medium (ISM) or by renewed energization related to the X–ray flare from the core of XTE J1752-223 occurred around 2010 Jul. 20 (observation 12310). Fender et al. (2004) proposed a similar scenario for the neutron star X–ray binary Cir X–1, where X-ray flares from the source core were causing re-brightening of radio emitting components 2-25 downstream in the jets, on a timescale of few days. Although this interpretation has been put into question by recent observations of Cir X–1(Miller-Jones et al., 2012), evidence of a flow of energy through astrophysical jets was found for other objects, such as the NS X–ray binary Sco X–1 (Fomalont et al., 2001) and several active galactic nuclei (e.g. Tingay et al. 1998).
For a distance of 8 , and assuming the date of observation 12310 as the starting time (MJD 55397.07034), the velocity of a shock propagating from the core of XTE J1752-223 to S2 would be (for details on the calculation see Fender et al. 2004). Although highly relativistic shocks within the jets were found for other sources (for Sco X–1, the jets velocity was 0.32-0.57c, but energy appeared to move from the core to the radio lobes at , Fomalont et al. 2001) the limit we find for XTE J1752-223 is even higher than the extreme case of Cir X-1, where . If XTE J1752-223 lies at 3.5 , the velocity would still be . Such high values would imply that the jets are very close to the line of sight, with an inclination of less than 12∘ at 3.5 and less than 5∘ at 8 . As XTE J1752-223 did show several X–ray flares during the last part of the outburst, an X–ray and/or radio re-brightening of the source core prior to our Chandra observation 12310 could be responsible for the reenergization of S2, leading to smaller velocities for the energy flowing in the jets. A scenario for XTE J1752-223 with very low inclination and highly relativistic shocks traveling in the jets would be consistent with the high proper motion measured from the resolved radio jets (58 , Yang et al. 2011) and with the fact that no receding jet was detected so far. As pointed out by Yang et al. (2011), XTE J1752-223 is a promising Galactic superluminal source candidate.
Another plausible scenario is that the X–ray emission from S2 is caused by interaction of a previously launched jet with the ISM, or by the collision of two consecutive ejections. Evidence for deceleration of the radio jets launched close to the hard-to-soft transition due to the ISM was already presented by Miller-Jones et al. (2011b). The authors found that the motion of the jets was best fit by a combination of a pure ballistic model describing the initial phase after the ejection, followed by a Sedov model further out with respect to the source core. Extrapolating this model to the time of our detection of S2, the jets should have traveled to a distance of 1′′ away from the core of XTE J1752-223. This is less than half the separation we observe between XTE J1752-223 and S2. If S2 is related to the ejections reported by Yang et al. (2010) and Miller-Jones et al. (2011b), this result indicates that the jets deceleration did not continue according to the Sedov model due to, e.g., density variations in the ISM. Denser coverage would be needed in order to single out a specific interpretation. At last, we note that the variable, unidentified Chandra source S6 also lies on the jet line, albeit on the side opposite S2, at a distance of 74 from the core of XTE J1752-223. Although it is possible that the X-ray emission we observed from S6 is associated with a receding jet from XTE J1752-223, the source position corresponds to that of a bright star detected in the optical, with a 0.25% probability of chance coincidence. An association with the optical candidate counterpart is thus likely.
4 CONCLUSION
We performed multi-wavelength observations of XTE J1752-223 in quiescence and during the last phase of the outburst decay towards quiescence, with the IMACS instrument in the optical i′-band, with the Chandra satellite in the X–rays, and with the EVLA and VLBA in the radio band.
We found that the i′-band counterpart to the source is fainter than 24.4 magnitudes, while the quiescent radio flux is 0.048 at 8.4 GHz. The quiescent X–ray flux as measured from our last Chandra observations is (1.40.2)10-14 cm-2 (0.5-10 ), although we can not rule out a later further dimming of the source.
We presented independent indications that the distance towards XTE J1752-223 is likely between 3.5 and 8 , in agreement with previous estimates based on the X–ray spectral and timing properties of the source. We showed that such a distance leads to a coherent picture where XTE J1752-223 has a short orbital period of P and the companion star is later than an M type main sequence star.
Combining our EVLA pointings with simultaneous Chandra observations and published RXTE data acquired during the outburst, we could investigate the X–ray – radio correlation for XTE J1752-223 in comparison with other BHTs. We found indications that XTE J1752-223 behaves similarly to H1743322, a BHT that is under-luminous in radio with respect to the ‘standard’ relation LL when above a critical luminosity of LEdd(M10M⊙), but undergoes a transition towards the standard correlation as the luminosity decreases. This transition was interpreted as a switch from a radiatively efficient accretion mechanism to a radiatively inefficient one. Given that a similar transition occurs in XTE J1752-223, suggests that such changes in the accretion mechanism are not due to some exceptional property of H1743322 but may be shared by other BHTs.
Our deep Chandra observations also detected several unidentified X–ray sources in the vicinity of XTE J1752-223, for some of which we found i′-band counterparts. One of the X–ray sources is variable and is probably associated with re-energization of jets from XTE J1752-223 or with the interaction of the ejecta with the ISM.
Acknowledgments
Mathieu Servillat is acknowledge for providing the CTIO observation of 2010 Aug. 31. EMR acknowledges Sara Motta for the information about the RXTE data. PGJ acknowledges support from a VIDI grant from the Netherlands Organisation for Scientific Research. RW aknowledges support from the European Reasearch council Starting Grants. DS acknowledges a STFC Advanced Fellowship
References
- Arnaud (1996) Arnaud K. A., 1996, in ASP Conf. Ser. 101: Astronomical Data Analysis Software and Systems V, Vol. 5, p. 17
- Belloni (2010) Belloni T. M., 2010, in Lecture Notes in Physics, Vol. 794, The Jet Paradigm, T. Belloni, ed., Springer Verlag, Berlin, p. 53
- Brocksopp et al. (2009) Brocksopp C., Corbel S., Tzioumis T., Fender R., 2009, The Astronomer’s Telegram, 2278, 1
- Brocksopp et al. (2010) Brocksopp C., Yang J., Corbel S., Tzioumis T., Fender R., 2010, The Astronomer’s Telegram, 2438, 1
- Calvelo et al. (2010) Calvelo D. E., Fender R. P., Russell D. M., Gallo E., Corbel S., Tzioumis A. K., Bell M. E., Lewis F., Maccarone T. J., 2010, MNRAS, 409, 839
- Cardelli et al. (1989) Cardelli J. A., Clayton G. C., Mathis J. S., 1989, ApJ, 345, 245
- Cash (1979) Cash W., 1979, ApJ, 228, 939
- Corbel et al. (2002) Corbel S., Fender R. P., Tzioumis A. K., Tomsick J. A., Orosz J. A., Miller J. M., Wijnands R., Kaaret P., 2002, Science, 298, 196
- Corbel et al. (2005) Corbel S., Kaaret P., Fender R. P., Tzioumis A. K., Tomsick J. A., Orosz J. A., 2005, ApJ, 632, 504
- Corbel et al. (2003) Corbel S., Nowak M. A., Fender R. P., Tzioumis A. K., Markoff S., 2003, A&A, 400, 1007
- Coriat et al. (2011) Coriat M., Corbel S., Prat L., Miller-Jones J. C. A., Cseh D., Tzioumis A. K., Brocksopp C., Rodriguez J., Fender R. P., Sivakoff G. R., 2011, MNRAS, 414, 677
- Corral-Santana et al. (2010a) Corral-Santana J. M., Casares J., Rodríguez-Gil P., 2010a, The Astronomer’s Telegram, 2804, 1
- Corral-Santana et al. (2010b) Corral-Santana J. M., Rodríguez-Gil P., Guerra J. C., Casares J., 2010b, The Astronomer’s Telegram, 2818, 1
- Curran et al. (2011) Curran P. A., Maccarone T. J., Casella P., Evans P. A., Landsman W., Krimm H. A., Brocksopp C., Still M., 2011, MNRAS, 410, 541
- Dickey & Lockman (1990) Dickey J. M., Lockman F. J., 1990, ARA&A, 28, 215
- Drilling & Landolt (2000) Drilling J. S., Landolt A. U., 2000, in Allen’s Astrophysical Quantities, Cox, A. N., ed., pp. 381–+
- Fender et al. (2004) Fender R., Wu K., Johnston H., Tzioumis T., Jonker P., Spencer R., van der Klis M., 2004, Nat, 427, 222
- Fomalont et al. (2001) Fomalont E. B., Geldzahler B. J., Bradshaw C. F., 2001, ApJ, 558, 283
- Gallo et al. (2006) Gallo E., Fender R. P., Miller-Jones J. C. A., Merloni A., Jonker P. G., Heinz S., Maccarone T. J., van der Klis M., 2006, MNRAS, 370, 1351
- Gallo et al. (2003) Gallo E., Fender R. P., Pooley G. G., 2003, MNRAS, 344, 60
- Gallo et al. (2008) Gallo E., Homan J., Jonker P. G., Tomsick J. A., 2008, ApJ, 683, L51
- Garcia et al. (2001) Garcia M. R., McClintock J. E., Narayan R., Callanan P., Barret D., Murray S. S., 2001, ApJ, 553, L47
- Garmire (1997) Garmire G. P., 1997, in Bulletin of the American Astronomical Society, Vol. 29, Bulletin of the American Astronomical Society, p. 823
- Greenberg et al. (1987) Greenberg J. M., Ferrini F., Barsella B., Aiello S., 1987, Nat, 327, 214
- Güver & Özel (2009) Güver T., Özel F., 2009, MNRAS, 400, 2050
- Homan (2010) Homan J., 2010, The Astronomer’s Telegram, 2387, 1
- Horne (1985) Horne K., 1985, MNRAS, 213, 129
- Jonker et al. (2004) Jonker P. G., Gallo E., Dhawan V., Rupen M., Fender R. P., Dubus G., 2004, MNRAS, 351, 1359
- Jonker et al. (2010) Jonker P. G., Miller-Jones J., Homan J., Gallo E., Rupen M., Tomsick J., Fender R. P., Kaaret P., Steeghs D. T. H., Torres M. A. P., Wijnands R., Markoff S., Lewin W. H. G., 2010, MNRAS, 401, 1255
- Kaaret et al. (2003) Kaaret P., Corbel S., Tomsick J. A., Fender R., Miller J. M., Orosz J. A., Tzioumis A. K., Wijnands R., 2003, ApJ, 582, 945
- Kennea et al. (2011) Kennea J. A., Romano P., Mangano V., Beardmore A. P., Evans P. A., Curran P. A., Krimm H. A., Markwardt C. B., Yamaoka K., 2011, ApJ, 736, 22
- Kovalev et al. (2007) Kovalev Y. Y., Petrov L., Fomalont E. B., Gordon D., 2007, AJ, 133, 1236
- Kuulkers et al. (2011) Kuulkers E., Kouveliotou C., van der Horst A. J., Belloni T., Chenevez J., Ibarra A., Munoz-Darias T., Bazzano A., Cadolle Bel M., De Cesare G., Diaz Trigo M., Jourdain E., Lubinski P., Natalucci L., Ness J. ., Parmar A., Pollock A. M. T., Rodriguez J., Roques J. ., Sanchez-Fernandez C., Ubertini P., Winkler C., 2011, ArXiv e-prints
- Li et al. (2004) Li J., Kastner J. H., Prigozhin G. Y., Schulz N. S., Feigelson E. D., Getman K. V., 2004, ApJ, 610, 1204
- Maccarone (2003) Maccarone T. J., 2003, A&A, 409, 697
- Markwardt et al. (2009a) Markwardt C. B., Barthelmy S. D., Evans P. A., Swank J. H., 2009a, The Astronomer’s Telegram, 2261, 1
- Markwardt et al. (2009b) Markwardt C. B., Swank J. H., Barthelmy S. D., Baumgartner W. H., Burrows D. N., Evans P. A., Holland S. T., Hoversten E. A., Page K. L., 2009b, The Astronomer’s Telegram, 2258, 1
- McMullin et al. (2007) McMullin J. P., Waters B., Schiebel D., Young W., Golap K., 2007, in Astronomical Society of the Pacific Conference Series, Vol. 376, Astronomical Data Analysis Software and Systems XVI, R. A. Shaw, F. Hill, & D. J. Bell, ed., pp. 127–+
- Miller-Jones et al. (2011a) Miller-Jones J. C. A., Jonker P. G., Maccarone T. J., Nelemans G., Calvelo D. E., 2011a, ApJ, 739, L18
- Miller-Jones et al. (2011b) Miller-Jones J. C. A., Jonker P. G., Ratti E. M., Torres M. A. P., Brocksopp C., Yang J., Morrell N. I., 2011b, MNRAS, 415, 306
- Miller-Jones et al. (2011c) Miller-Jones J. C. A., Madej O. K., Jonker P. G., Homan J., Ratti E. M., Torres M. A. P., 2011c, The Astronomer’s Telegram, 3358, 1
- Miller-Jones et al. (2012) Miller-Jones J. C. A., Moin A., Tingay S. J., Reynolds C., Phillips C. J., Tzioumis A. K., Fender R. P., McCallum J. N., Nicolson G. D., Tudose V., 2012, MNRAS, 419, L49
- Muñoz-Darias et al. (2010) Muñoz-Darias T., Motta S., Pawar D., Belloni T. M., Campana S., Bhattacharya D., 2010, MNRAS, 404, L94
- Nakahira et al. (2010) Nakahira S., Yamaoka K., Sugizaki M., Ueda Y., Negoro H., Ebisawa K., Kawai N., Matsuoka M., Tsunemi H., Daikyuji A., Eguchi S., Hiroi K., Ishikawa M., Ishiwata R., Isobe N., Kawasaki K., Kimura M., Kohama M., Mihara T., Miyoshi S., Morii M., Nakagawa Y. E., Nakajima M., Ozawa H., Sootome T., Sugimori K., Suzuki M., Tomida H., Ueno S., Yamamoto T., Yoshida A., Maxi Team, 2010, PASJ, 62, L27+
- Perley et al. (2009) Perley R., Napier P., Jackson J., Butler B., Carlson B., Fort D., Dewdney P., Clark B., Hayward R., Durand S., Revnell M., McKinnon M., 2009, IEEE Proceedings, 97, 1448
- Perley (1999) Perley R. A. . T. G. B., 1999, Tech. Rep., NRAO
- Petrov et al. (2005) Petrov L., Kovalev Y. Y., Fomalont E., Gordon D., 2005, AJ, 129, 1163
- Remillard & McClintock (2006) Remillard R. A., McClintock J. E., 2006, ARA&A, 44, 49
- Rodriguez et al. (2011) Rodriguez J., Corbel S., Caballero I., Tomsick J. A., Tzioumis T., Paizis A., Cadolle Bel M., Kuulkers E., 2011, A&A, 533, L4
- Russell et al. (2012) Russell D. M., Curran P. A., Muñoz-Darias T., Lewis F., Motta S., Stiele H., Belloni T., Miller-Jones J. C. A., Jonker P. G., O’Brien K., Homan J., Casella P., Gandhi P., Soleri P., Markoff S., Maitra D., Gallo E., Cadolle Bel M., 2012, MNRAS, 419, 1740
- Shahbaz & Kuulkers (1998) Shahbaz T., Kuulkers E., 1998, MNRAS, 295, L1
- Shaposhnikov et al. (2010) Shaposhnikov N., Markwardt C., Swank J., Krimm H., 2010, ApJ, 723, 1817
- Stetson (1987) Stetson P. B., 1987, PASP, 99, 191
- Tingay et al. (1998) Tingay S. J., Jauncey D. L., Reynolds J. E., Tzioumis A. K., King E. A., Preston R. A., Jones D. L., Murphy D. W., Meier D. L., van Ommen T. D., McCulloch P. M., Ellingsen S. P., Costa M. E., Edwards P. G., Lovell J. E. J., Nicolson G. D., Quick J. F. H., Kemball A. J., Migenes V., Harbison P., Jones P. A., White G. L., Gough R. G., Ferris R. H., Sinclair M. W., Clay R. W., 1998, AJ, 115, 960
- Tomsick et al. (2003) Tomsick J. A., Corbel S., Fender R., Miller J. M., Orosz J. A., Tzioumis T., Wijnands R., Kaaret P., 2003, ApJ, 582, 933
- Tomsick et al. (2004) Tomsick J. A., Kalemci E., Kaaret P., 2004, ApJ, 601, 439
- Torres et al. (2009a) Torres M. A. P., Jonker P. G., Steeghs D., Yan H., Huang J., Soderberg A. M., 2009a, The Astronomer’s Telegram, 2263, 1
- Torres et al. (2009b) Torres M. A. P., Steeghs D., Jonker P. G., Thompson I., Soderberg A. M., 2009b, The Astronomer’s Telegram, 2268, 1
- van Paradijs & McClintock (1995) van Paradijs J., McClintock J. E., 1995, Optical and Ultraviolet Observations of X-ray Binaries, X-ray Binaries, eds. W.H.G. Lewin, J. van Paradijs, and E.P.J. van den Heuvel (Cambridge: Cambridge Univ. Press), p. 58
- Wu et al. (2010) Wu Y. X., Yu W., Li T. P., Maccarone T. J., Li X. D., 2010, ApJ, 718, 620
- Yang et al. (2010) Yang J., Brocksopp C., Corbel S., Paragi Z., Tzioumis T., Fender R. P., 2010, MNRAS, 409, L64
- Yang et al. (2011) Yang J., Paragi Z., Corbel S., Gurvits L. I., Campbell R. M., Brocksopp C., 2011, MNRAS, 418, L25
- Zacharias et al. (2010) Zacharias N., Finch C., Girard T., Hambly N., Wycoff G., Zacharias M. I., Castillo D., Corbin T., DiVittorio M., Dutta S., Gaume R., Gauss S., Germain M., Hall D., Hartkopf W., Hsu D., Holdenried E., Makarov V., Martinez M., Mason B., Monet D., Rafferty T., Rhodes A., Siemers T., Smith D., Tilleman T., Urban S., Wieder G., Winter L., Young A., 2010, AJ, 139, 2184