The complexity of parsec-scaled dusty tori in AGN
Abstract
Warm gas and dust surround the innermost regions of active galactic nuclei (AGN). They provide the material for accretion onto the super-massive black hole and they are held responsible for the orientation-dependent obscuration of the central engine. The AGN-heated dust distributions turn out to be very compact with sizes on scales of about a parsec in the mid-infrared. Only infrared interferometry currently provides the necessary angular resolution to directly study the physical properties of this dust. Size estimates for the dust distributions derived from interferometric observations can be used to construct a size–luminosity relation for the dust distributions. The large scatter about this relation suggests significant differences between the dust tori in the individual galaxies, even for nuclei of the same class of objects and with similar luminosities. This questions the simple picture of the same dusty doughnut in all AGN. The Circinus galaxy is the closest Seyfert 2 galaxy. Because its mid-infrared emission is well resolved interferometrically, it is a prime target for detailed studies of its nuclear dust distribution. An extensive new interferometric data set was obtained for this galaxy. It shows that the dust emission comes from a very dense, disk-like structure which is surrounded by a geometrically thick, similarly warm dust distribution as well as significant amounts of warm dust within the ionisation cone.
1 Introduction
Molecular gas and dust play an important role in the appearance and physics of active galactic nuclei (AGN). A significant portion of the energy released by the accretion disk is intercepted by the surrounding dusty material and re-emitted at infrared wavelengths. The direct connection between the emission from the accretion disk and the reprocessed emission from the torus is reflected by the tight correlation between the X-ray and mid-infrared luminosities of AGN [1, 2, 3]. Several lines of evidence (ionisation cones, collimated outflows, broad emission lines in polarised light, etc.) suggest that the molecular and dusty material is located in a geometrically thick, toroidal distribution, the so-called dusty torus. The viewing-angle dependent obscuration of such a distribution – or, in general, the supposed axisymmetric geometry of AGN – is made responsible for many of the different observed properties of AGN, most importantly the differences between type 1 (torus face-on) and type 2 (torus edge-on) sources. There are, however, certainly other parameters apart from the viewing angle which influence the observed properties of AGN (see for example the contribution by C. Ramos Almeida).
Most information about the distribution of the nuclear gas and dust has been obtained indirectly, as even the largest single-dish telescopes do not provide enough angular resolution to resolve the nuclear material. Only in the last years it has become possible to spatially resolve the thermal emission from the AGN-heated dust using infrared interferometry. While interferometry in the near-infrared probes the hot () dust close to sublimation at the inner rim of the torus (c.f. the contribution by M. Kishimoto), mid-infrared interferometry explores the warm () body of the dust distribution. The following will focus on studies of AGN with the MID-infrared Interferometric instrument (MIDI) at the Very Large Telescope Interferometer (VLTI). MIDI is currently the only instrument capable of resolving the emission from the warm dust component in AGN.
2 Observations of AGN with MIDI
Several observing campaigns of AGN have been carried out with MIDI. First, the brightest four active galaxies were studied individually, mainly using science demonstration time (SDT) or guaranteed time observations (GTO): NGC 1068 [4, 5], the Circinus galaxy [6], Centaurus A (NGC 5128) [7] and NGC 4151 [8]. In addition to these four sources, seven further sources were observed using the remaining GTO in a snapshot survey [9]. The goal was to test the feasibility of observations for these fainter sources at the sensitivity limit of MIDI and to obtain first size estimates of their emission regions. After the successful completion of the feasibility tests, a large observing programme containing 13 sources was initiated with the aim to investigate a statistical sample of AGN (L. Burtscher et al. in prep.). A sample of six type 1 sources studied with MIDI has been presented in [10]. A few other sources have been observed successfully, among them NGC 3783 [11, 10] and NGC 424 (S. F. Hönig et al. in prep.). Here, the results obtained from the snapshot survey as well as the results obtained from new measurements for the Circinus galaxy will be summarised.
A list of all the galaxies from GTO observations and the snapshot survey is shown in table 1. Both type 1 and type 2 AGN as well as a radio galaxy and a quasar are among these sources. The last column lists a short, verbal result from the interferometric observations for the respective galaxy. These results range from more or less unresolved sources (Mrk 1239) to very well resolved sources, where a disk component can be distinguished from a more extended, diffuse structure (NGC 1068 and the Circinus galaxy).
| \brGalaxy name | RA | DEC | type | [Jy] | result |
| (1) | (2) | (3) | (4) | (5) | (6) |
| \mrNGC 1068 | Sy 2 | disk + elongated component | |||
| NGC 1365 | Sy 1.8 | partially resolved | |||
| IRAS 05189-2524 | Sy 2 | faint detection (resolved?) | |||
| MCG-05-23-016 | Sy 2 | well resolved | |||
| Mrk 1239 | Sy 1.5 | unresolved | |||
| NGC 3783 | Sy 1 | partially resolved | |||
| NGC 4151 | Sy 1.5 | well resolved | |||
| 3C 273 | QSO | possibly resolved | |||
| Centaurus A | FR I | core + extended component | |||
| IC 4329A | Sy 1.2 | slightly resolved | |||
| Circinus | Sy 2 | disk + elongated component | |||
| NGC 7469 | Sy 1.2 | well resolved | |||
| \br |
3 The size–luminosity relation in the mid-infrared
3.1 Building the size–luminosity relation
From the visibilities measured by the interferometer, simple size estimates for the mid-infrared emission regions in these galaxies can be derived by assuming a Gaussian brightness distribution. Although this is certainly a very simplifying assumption and the true brightness distributions of AGN tori are significantly more complex, a Gaussian distribution is the simplest and most general initial guess for the true brightness distribution. Furthermore, it does not rely on any other assumption (e.g. about the location of the inner or outer edge of the torus as is needed for power-law distributions) and its half width at half maximum is related to the visibility , the projected baseline length and wavelength of the interferometric observation by a simple, analytical relation:
| (1) |
This method yields viable size estimates with errors of up to a factor of 4 as long as (for a more detailed discussion of the accuracy see [12]).
In figure 1 the Gaussian is plotted as a function of the hard X-ray luminosity , which is considered as a proxy for the intrinsic luminosity of the AGN when corrected for foreground and intrinsic absorption. The X-ray fluxes were taken from the first 22 months of data of the hard X-ray survey () with the Burst Alert Telescope (BAT) on the Swift satellite [13] and corrected for absorption. These measurements were obtained before or contemporaneous with the interferometric measurements. For the only source not in the BAT sample, Mrk 1239, the luminosity from [14] was used after correcting it from the soft to the hard X-ray band.
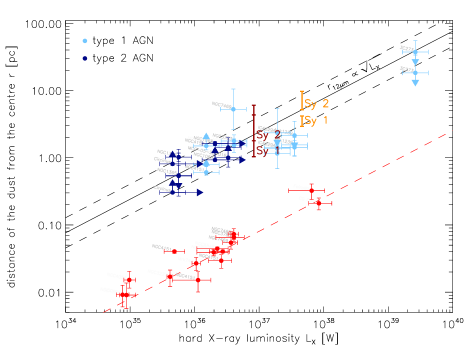
The data shown in figure 1 is still consistent with the naively expected relation , i.e. that the size of the dust distribution scales with the luminosity of the accretion disk: . This is in contrast to the much slower dependency than found for type 1 objects in [10]. However, we also see a tendency for type 1 objects with high luminosities to lie below the relation and a lot depends on the highest luminosity object 3C 273. Certainly, this figure has to be filled with more measurements of a larger sample of sources and the uncertainties as well as selection effects have to be reduced. This is one of the goals of the MIDI AGN Large Programme.
3.2 Comparison to models
To better understand the implications of the interferometrically measured sizes of the dust distributions, the size–luminosity relation is compared to the predictions from two models for clumpy tori of AGN: (1) the clumpy torus model from [16, 17] and (2) the hydrodynamical torus model from [18]. To obtain torus sizes which can be directly compared to the measured size estimates, interferometric observations of the brightness distributions of the two models are simulated and then the sizes are calculated according to equation 1. The range of sizes predicted by the two models are shown by the thick red and orange bars in figure 1. The sizes from the models are in general consistent with the observed sizes at a given luminosity. The models themselves cannot be used to test whether the size–luminosity relation is correct in itself, as they are explicitly assumed to scale with . More interesting is however that both models show a clear offset between the sizes of type 1 (more compact) and type 2 (more extended) tori. Such an offset is not observed in this data and the dust distributions in individual galaxies of a single object class appear more different than the differences between the classes. This might be interpreted in the way that actually not so much the inclination but other torus properties are responsible for the type 1/2 differences. This is also suggested by the fitting of torus models to the infrared SEDs of AGN (see contribution by C. Ramos Almeida). In any case this is further evidence that not all AGN have the same dust distribution – even not in nuclei with the same luminosity and in the same object class.
4 The dust distribution in the Circinus galaxy
Being the second brightest AGN in the mid-infrared (c.f. table 1) and relatively nearby, at a distance of only , the Circinus galaxy is one of the prime targets for studying the nuclear dust distribution in detail with infrared interferometry. Observations in the optical, X-rays, and radio indicate that the Circinus galaxy has a Seyfert 2 nucleus. As a typical type 2 AGN, the galaxy shows broad emission lines in polarised light [19] and an ionisation cone [20, 21, 22]. The mid-infrared spectrum shows a deep silicate absorption feature, caused both by dust lanes within Circinus (which is inclined by ) as well as by the nuclear dust itself. First results obtained with MIDI have shown that the emission is resolved into a disk-like component plus an extended emission region [6]. Since then, extensive new observations have been carried out and the first results of these are presented here.
4.1 A direct analysis of the MIDI data
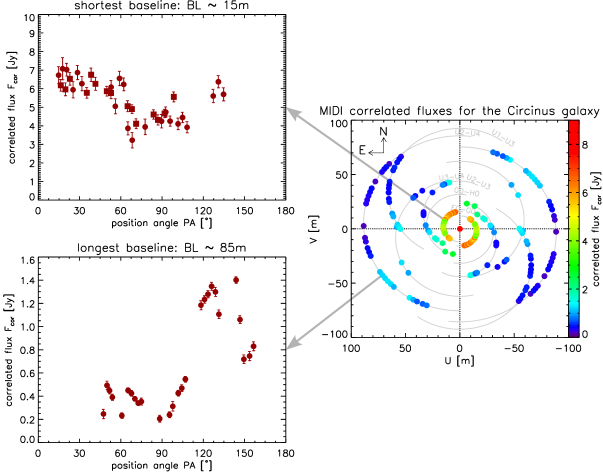
The current coverage of the UV plane achieved by MIDI is shown in the right panel of figure 2. With more than 100 measurements, a respectable UV coverage has been achieved for optical interferometry. However, the data are very inhomogeneous in instrument settings and observing technique, due to the large spread of time over which the data has been obtained. Furthermore, there are some inconsistencies in the data, which make a quick interpretation of the data difficult. Nevertheless, important properties of the dust emission can be directly inferred from the interferometric measurements without the need for any modelling.
On the shortest baseline, essentially only the position angle changed while the baseline length remained more or less the same. This means the same, large spatial scales were probed at different position angles. In the top left panel of figure 2, the correlated flux at for this baseline is plotted as a function of the position angle. The correlated flux has a broad minimum at , which means the emission is resolved most along this position angle, i.e. it is extended most in this direction. This is consistent with the result of deep mid-infrared imaging with class telescopes, where an elongation along , i.e. along the southern edge of the ionisation cone, is seen [23].
The same can be done for the UT2-UT4 baseline, which is a very long baseline and hence probes very small spatial structures. In the lower left panel of figure 2, the correlated flux from this longer baseline is plotted as a function of position angle in the same way as for the shortest baseline. A very strong dependency of the correlated flux on the position angle is evident, with a clear maximum at . The mid-infrared emission hence has a minimum extension along this direction. In fact, the observed dependency of the correlated flux on the position angle is consistent with a relatively thin and highly inclined disk.
4.2 Simple two component model fit
| \brparameter | disk component | extended component | |||
|---|---|---|---|---|---|
| \mrsize of major axis | |||||
| axis ratio | |||||
| position angle | |||||
| silicate depth | |||||
| temperature | |||||
| surface filling factor | |||||
| \br | |||||
To obtain a more accurate idea about the brightness distribution, the interferometric data has to be modelled. The most unambiguous result which is also physically motivated and does not rely on any further assumptions can be achieved using a two component model: The two components are elongated Gaussian distributions emitting black body or grey body radiation. Furthermore, the two components are located behind an absorption screen giving rise to the silicate absorption feature. The model thus has a total of 12 free parameters, and their values for the best fit are shown in table 2. In figure 3, the two model components are sketched: The inner component has a size of , i.e. at the distance of Circinus. It is very elongated and has a temperature of about . The second component has a size of about , that is , and is elongated along . It has a slightly higher temperature of about . Most of the total flux of the source is located in the extended component.
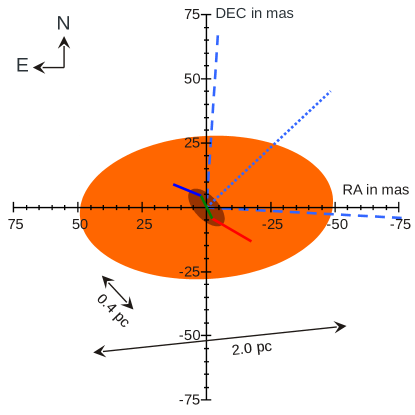
We interpret the two Gaussian emitters as signs for a geometrically thick distribution, “torus”, of warm dust surrounding a very dense, disk-like structure as well as significant amounts of dust within the ionisation cone. The smaller and denser disk is seen at a high inclination. It is optically thick and it partly exhibits the silicate band in emission. The disk matches maser emitters tracing a mildly warped, thin disk [24] in orientation and size. The disk is surrounded by the larger, less dense and most likely clumpy or filamentary torus component which gives rise to strong silicate absorption. The elongation of this component indicates that there are significant amounts of dust within the ionisation cone. Since the dust in the ionisation cone is roughly at the same temperature as the dust of the disk, this dust must be directly exposed to the radiation from the accretion disk to be heated to such high temperatures at these distances.
4.3 Comparison with NGC 1068
It is interesting to compare these results for the Circinus galaxy to those for NGC 1068, which hosts the brightest active nucleus in the mid-infrared and which is the second Seyfert 2 nucleus where the dust distribution has been studied in detail [4, 5]. There are a few similarities between the two nuclei: Both tori have a highly-inclined dust disk which is surrounded by an extended, geometrically thick dust distribution. And in both nuclei, the inner disk component roughly matches a maser disk in orientation and size. However, there are also a few significant differences: While in Circinus the torus is nicely aligned perpendicular to the ionisation cone and outflow as expected in the standard picture, this is not the case in NGC 1068. While in NGC 1068 the dust disk, which is located closest to the accretion disk, has a significantly higher temperature than the surrounding dust, there are no indications for hot dust in the Circinus nucleus from our data. And finally, while in the Circinus nucleus the depth of the silicate feature decreases towards the nucleus, the opposite is the case in NGC 1068: here the silicate feature gets deeper towards the smaller disk component. Although it is still not clear what the reasons for these differences are, it is clear that the dust distributions in these two Seyfert 2 galaxies must be quite different.
Conclusions
These proceedings should have convinced the reader of the following three points: (1) Optical interferometry is currently the only way to directly study the nuclear dust distributions in AGN – and it is a very successful tool to do so. (2) The warm, AGN-heated dust distributions in AGN are compact with sizes of only a few parsecs. (3) There are significant differences between the dust distributions in individual galaxies, even for objects of the same class and with similar luminosities. These differences are probably larger than the differences between the distributions in type 1 and type 2 objects. This will certainly have impact on our understanding of how accretion onto the super-massive black hole works on parsec scales.
References
References
- [1] Horst H, Gandhi P, Smette A and Duschl W J 2008 A&A 479 389–396 (Preprint arXiv:0711.3734)
- [2] Gandhi P, Horst H, Smette A, Hönig S, Comastri A, Gilli R, Vignali C and Duschl W 2009 A&A 502 457–472 (Preprint 0902.2777)
- [3] Levenson N A, Radomski J T, Packham C, Mason R E, Schaefer J J and Telesco C M 2009 ApJ 703 390–398 (Preprint 0908.0036)
- [4] Jaffe W, Meisenheimer K, Röttgering H J A, Leinert C, Richichi A, Chesneau O, Fraix-Burnet D, Glazenborg-Kluttig A, Granato G L, Graser U, Heijligers B, Köhler R, Malbet F, Miley G K, Paresce F, Pel J W, Perrin G, Przygodda F, Schoeller M, Sol H, Waters L B F M, Weigelt G, Woillez J and de Zeeuw P T 2004 Nature 429 47–49
- [5] Raban D, Jaffe W, Röttgering H, Meisenheimer K and Tristram K R W 2009 MNRAS 394 1325–1337 (Preprint 0901.1306)
- [6] Tristram K R W, Meisenheimer K, Jaffe W, Schartmann M, Rix H W, Leinert C, Morel S, Wittkowski M, Röttgering H, Perrin G, Lopez B, Raban D, Cotton W D, Graser U, Paresce F and Henning T 2007 A&A 474 837–850 (Preprint arXiv:0709.0209)
- [7] Meisenheimer K, Tristram K R W, Jaffe W, Israel F, Neumayer N, Raban D, Röttgering H, Cotton W D, Graser U, Henning T, Leinert C, Lopez B, Perrin G and Prieto A 2007 A&A 471 453–465 (Preprint arXiv:0707.0177)
- [8] Burtscher L, Jaffe W, Raban D, Meisenheimer K, Tristram K R W and Röttgering H 2009 ApJ 705 L53–L57 (Preprint 0909.5191)
- [9] Tristram K R W, Raban D, Meisenheimer K, Jaffe W, Röttgering H, Burtscher L, Cotton W D, Graser U, Henning T, Leinert C, Lopez B, Morel S, Perrin G and Wittkowski M 2009 A&A 502 67–84 (Preprint 0903.4892)
- [10] Kishimoto M, Hönig S F, Antonucci R, Millour F, Tristram K R W and Weigelt G 2011 A&A 536 A78 (Preprint 1110.4290)
- [11] Beckert T, Driebe T, Hönig S F and Weigelt G 2008 A&A 486 L17–L20 (Preprint arXiv:0806.0531)
- [12] Tristram K R W and Schartmann M 2011 A&A 531 A99 (Preprint 1105.4875)
- [13] Tueller J, Baumgartner W H, Markwardt C B, Skinner G K, Mushotzky R F, Ajello M, Barthelmy S, Beardmore A, Brandt W N, Burrows D, Chincarini G, Campana S, Cummings J, Cusumano G, Evans P, Fenimore E, Gehrels N, Godet O, Grupe D, Holland S, Kennea J, Krimm H A, Koss M, Moretti A, Mukai K, Osborne J P, Okajima T, Pagani C, Page K, Palmer D, Parsons A, Schneider D P, Sakamoto T, Sambruna R, Sato G, Stamatikos M, Stroh M, Ukwata T and Winter L 2010 ApJS 186 378–405 (Preprint 0903.3037)
- [14] Grupe D, Mathur S and Komossa S 2004 AJ 127 3161–3167 (Preprint arXiv:astro-ph/0402268)
- [15] Suganuma M, Yoshii Y, Kobayashi Y, Minezaki T, Enya K, Tomita H, Aoki T, Koshida S and Peterson B A 2006 ApJ 639 46–63 (Preprint arXiv:astro-ph/0511697)
- [16] Hönig S F, Beckert T, Ohnaka K and Weigelt G 2006 A&A 452 459–471 (Preprint astro-ph/0602494)
- [17] Hönig S F and Kishimoto M 2010 A&A 523 A27 (Preprint 0909.4539)
- [18] Schartmann M, Meisenheimer K, Klahr H, Camenzind M, Wolf S and Henning T 2009 MNRAS 393 759–773 (Preprint 0811.1425)
- [19] Oliva E, Marconi A, Cimatti A and Alighieri S D S 1998 A&A 329 L21–L24 (Preprint astro-ph/9711054)
- [20] Veilleux S and Bland-Hawthorn J 1997 ApJ 479 L105 (Preprint astro-ph/9703040)
- [21] Wilson A S, Shopbell P L, Simpson C, Storchi-Bergmann T, Barbosa F K B and Ward M J 2000 AJ 120 1325–1341 (Preprint astro-ph/0006147)
- [22] Prieto M A, Meisenheimer K, Marco O, Reunanen J, Contini M, Clenet Y, Davies R I, Gratadour D, Henning T, Klaas U, Kotilainen J, Leinert C, Lutz D, Rouan D and Thatte N 2004 ApJ 614 135–141 (Preprint astro-ph/0406620)
- [23] Packham C, Radomski J T, Roche P F, Aitken D K, Perlman E, Alonso-Herrero A, Colina L and Telesco C M 2005 ApJ 618 L17–L20
- [24] Greenhill L J, Booth R S, Ellingsen S P, Herrnstein J R, Jauncey D L, McCulloch P M, Moran J M, Norris R P, Reynolds J E and Tzioumis A K 2003 ApJ 590 162–173 (Preprint astro-ph/0302533)