Low temperature thermodynamic properties near the field-induced quantum critical point in NiCl2-4SC(NH2)2
Abstract
We present a comprehensive experimental and theoretical investigation of the thermodynamic properties: specific heat, magnetization and thermal expansion in the vicinity of the field-induced quantum critical point (QCP) around the lower critical field T in NiCl2-4SC(NH2)2. A behavior in the specific heat and magnetization is observed at very low temperatures at that is consistent with the universality class of Bose-Einstein condensation of magnons. The temperature dependence of the thermal expansion coefficient at shows minor deviations from the expected behavior. Our experimental study is complemented by analytical calculations and Quantum Monte Carlo simulations, which reproduce nicely the measured quantities. We analyze the thermal and the magnetic Grüneisen parameters that are ideal quantities to identify QCPs. Both parameters diverge at with the expected power law. By using the Ehrenfest relations at the second order phase transition, we are able to estimate the pressure dependencies of the characteristic temperature and field scales.
pacs:
75.40.-s; 64.70.Tg; 65.40.DeI Introduction
Bose-Einstein condensation (BEC) has triggered great interest in the last years and was found in a variety of complex many body systems, such as cold atoms, superfluid Helium or superconductors. By exploiting the Matusbara-Matsuda mapping of spins into hard core bosons, Matsubara56 Batyev showed that the field induced phase transition between canted XY antiferromagnetic (AFM) ordering and the fully polarized state can also be described as a BEC. Batyev84 This useful mapping between magnetic systems and dilute gases of bosons can be extended to higher spin values Batista01 ; Batista04 and it has been successfully exploited first on TlCuCl3Nikuni00 and other quantum magnets.Giamarchi08 ; Zapf12
One material investigated recently, is NiCl2-4SC(NH2)2,PaduanFilho81 also known as dichlorotetrakisthiourea-nickel (DTN). It has a body-centered tetragonal crystal structure with chains of Ni-Cl-Cl-Ni atoms arranged along the crystallographic direction. DTN enters the XY-AFM ordered state between moderate fields of 2 T and 12.5 T, if the magnetic field is applied along . The magnetic atom in DTN is Ni2+ carrying a spin due to an almost completely quenched orbital momentum. The Hamiltonian for DTN can be written as
| (1) |
where and is the relative vector between nearest-neighbors along the -direction. The magnitude of the dominant single-ion anisotropy is 8.9 K.Zvyagin07 The AFM exchange interactions between neighboring spins are = 2.2 K along the chains, and about 10 times smaller, 0.18 K, in the -plane. The last Zeeman term in equation (1) is originated from the applied magnetic field and the quantization -axis is chosen along the field direction. The gyromagnetic factor parallel to the -axis was estimated to be 2.26 by ESR experiments.Zvyagin07 Equation (1) is only a minimal Hamiltonian for describing the magnetic properties of DTN. Further contributions, such as dipolar interactions, which break the U(1) symmetry of global rotations along the spin -axis are small, but they become relevant at very low temperatures. Therefore, the critical exponents characteristic of a BEC quantum critical point (QCP) can only be observed, if the U(1) symmetry breaking terms are at least one order of magnitude smaller than . At low enough temperatures one should observe a crossover from the behavior characteristic for BEC-QCPs to the one expected for an Ising-like QCP. Investigations of the exact shape of the phase boundary close to and down to 1 mK by detailed AC susceptibility measurements evidenced the universality class of a BEC in DTN.Yin08 Up to date, this is the solely experimental observation consistent with a field induced BEC-QCP in this material.
The universality class of the QCP can also be determined by measuring the exponents for the power-law dependencies of different thermodynamic quantities as a function of temperature. Table 1 shows the expected exponents for BEC and Ising-like QCPs in 2 and 3 dimensions .Zapf12 It is important to note, that is the upper critical dimension for the Ising-like QCP (), where is the dynamical exponent and the effective dimensionality. Therefore, one should expect further logarithmic corrections to the power law behaviors listed in Table 1.
| XY-AFM order | Ising | |
|---|---|---|
In this work, an extensive study of the magnetization , specific heat , and thermal expansion close to the critical field gives further strong evidence that DTN belongs to the universality class of BEC.
It has been shown recently,Zhu03 that QCPs can be detected by measuring the divergence of the thermal Grüneisen parameter,
| (2) |
for pressure tuning, and the magnetic Grüneisen parameter,
| (3) |
for a magnetic field tuned QCP. Both Grüneisen parameters diverge at the QCP like , where is the critical exponent that relates the correlation length with the driving parameter of the quantum phase transition (magnetic field in the case of DTN). The effective dimension is higher or equal to 4 with for the Ising-type and for the BEC-type QCP, and we get for both cases. Therefore, is expected for a BEC-QCP and for an Ising-like QCP in agreement with the power laws listed in Table 1.
Typical for QCPs is the occurrence of local maxima in the entropy due to enhanced quantum critical fluctuations. This implies a sign change of the thermal expansion coefficient,Garst05 which is linked to the entropy via the Maxwell relation . In the past, the concept of the diverging Grüneisen parameter was used successfully to identify and characterize not only well understood magnetic QCPs, but also other more puzzling QCPs in intermetallic compounds.Kuechler03
So far, dilatometric properties were used to investigate the quantum critical behavior of only a few quantum magnets. The coupled spin-dimer system TlCuCl3Takatsu97 and the quasi-one-dimensional spin-ladder compound (C5H12N)2CuBr4Patyal90 are two rare examples. These systems show field induced phase transitions at low temperatures,Oosawa99 ; Nikuni00 ; Watson01 however, investigations of the thermal expansion coefficient and the Grüneisen ratio show significant deviations from the expected behavior in both cases. Dilatometric experiments on TlCuCl3 reveal that while the thermal Grüneisen parameter diverges with the expected power law , the individual quantities specific heat and thermal expansion fail to follow the predictions.Lorenz07 In (C5H12N)2CuBr4, the thermal expansion coefficient along the crystallographic direction shows a weak indication of divergency and a clear sign change at the lower and upper critical field , but a detailed discussion of is missing.Lorenz08 The present study of the thermal and magnetic Grüneisen ratios shows that DTN is an excellent candidate to close this gap of knowledge about dilatometric properties of insulating quantum critical materials.
The paper is organized as follows: in Section II, we describe the experimental techniques that we used in static magnetic fields to measure the specific heat, thermal expansion and magnetization up to 15 T, the approximated model used for the analytical calculations, and the quantum Monte Carlo (QMC) simulations of the thermodynamic quantities. Section III contains a detailed description of the experimental and theoretical results. We continue in Section IV with the comparison between experiment and theory and the analysis of the anomalies at the phase boundary via the Ehrenfest relations. Section V summarizes the most important results of our study.
II Methods
The preparation of high-quality single-crystals is explained elsewhere.PaduanFilho04a All experiments were conducted, partly down to 30 mK, inside commercial available dilution refrigerators, furbished with superconducting (SC) magnets with maximum fields of up to 15 T. We measured the magnetization with a high resolution Faraday magnetometer.Sakakibara94 The thermal expansion and magnetostriction experiments were carried out with a high precision capacitive dilatometerPott83 made of CuBe. The dilatometer can be rotated by 90∘ in order to measure the length change not only parallel but also perpendicular to the applied magnetic field. The specific heat was measured with the compensated heat pulse techniqueWilhelm04 and the data were confirmed by experiments using the dual-slope methodRiegel86 on the same sample platform. The precise match between both sets of experimental data is remarkable. Additionally, we used the specific-heat setup to perform magnetocaloric effect (MCE) measurements for a precise estimate of the critical field .
The analytical calculations of the various thermodynamic properties were based on the usual expansion in the gas parameter or ratio between the scattering amplitude and the average inter-particle distance, . Abrikosov For this purpose we mapped the magnetic excitations of the low field paramagnetic (PM) state into hard core bosons, where the -component of the magnetization density in the original model, , is mapped into the particle density . Here we neglect the contribution to the magnetization of the modes, because we are assuming that is close to and , with being the spin gap of DTN. We use the expression derived in Ref. [Kohama11, ] for the single-particle dispersion , with
| (4) |
The parameters and are given by the following expressions:
| (5) |
By using the Hamiltonian parameters for DTN estimated in Ref. [Zvyagin07, ] the resulting values are and K. The effective repulsion between bosons in the long wavelength limit, with being the ordering wave-vector, results from summing the ladder diagrams for the bare interaction vertex Abrikosov :
| (6) |
where for DTN and is included to enforce the hard core constraint. The effective Hamiltonian in the long wavelength limit is given by
| (7) |
where is the total number of lattice sites and the operator () creates (annihilates) a boson with momentum . is obtained by taking the long wavelength limit of :
| (8) |
with
| (9) |
The chemical potential is . After a mean-field treatment of in the PM phase, , the interaction term simply leads to a renormalization of the chemical potential, , with
| (10) |
and the particle density
| (11) |
The resulting quadratic mean-field Hamiltonian can be easily diagonalized and the various thermodynamic properties are computed by solving the self-consistent condition imposed by Eqs.(10) and (11)
The analytic calculations have been supplemented by large scale numerical simulations of the microscopic model. We have used the Stochastic Series Expansion (SSE) QMC method to simulate the Hamiltonian (1) on finite-sized lattices using the experimentally determined parameters. The SSE is a finite-temperature QMC technique based on importance sampling of the diagonal matrix elements of the density matrix . sse1 ; sse2 The use of operator loop cluster updates reduces the autocorrelation time for the system sizes. We consider here up to spins to at most a few Monte Carlo sweeps even at the critical temperature.dloops This enables us to explore the vicinity of the critical points very efficiently. On the dense temperature grids needed to study the critical region in detail, the statistics of the Monte Carlo results can be significantly improved by the use of a parallel tempering scheme.tempering1 ; tempering2 The implementation of this tempering scheme in the context of the SSE method has been discussed in detail previously,ssetemp1 ; ssetemp2 and we follow the one developed in Ref. [ssetemp2, ].
QMC estimates for observables of a spatially anisotropic system can depend non-monotonically on the system size for isotropic lattices. One can instead use anisotropic lattices to more rapidly obtain monotonic behavior of the numerical results for extrapolating to the thermodynamic limit. Anticipating similar effects in the present model (since ), we have studied tetragonal lattices with .
The specific heat has been extracted from the simulation data by the numerical differentiation of the total internal energy of the system – a quantity that is estimated extremely accurately by the SSE method. The temperature dependence of the energy is approximated by a polynomial in , and the derivative of the polynomial fit is used to estimate the specific heat. Thus, artifacts of discrete numerical differentiation of the raw data are avoided and we yield a relatively noise-free specific heat curve.
III Experimental Results
III.1 Magnetization
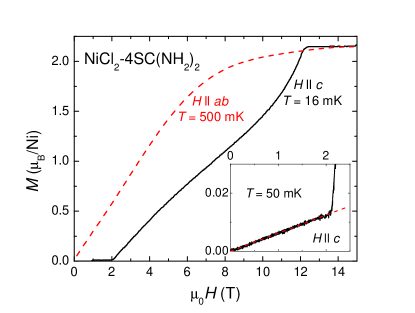
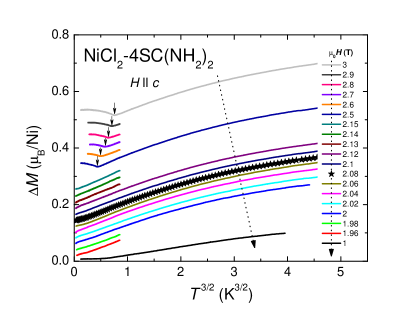
Figure 1 shows a comparison of the magnetization as a function of magnetic field measured perpendicular at 500 mKZapf07 and parallel at 16 mKPaduanFilho04a to the crystallographic -axis. The latter data nicely reflect the Néel-ordered state in the plane with increasing canting along between 2.1 T and 12.6 T followed by saturation. For , the magnetization shows PM behavior with no ordering, approximately following a Brillouin function and saturating at 2.2 per Ni2+-atom around 15 T. In this field direction the magnetic field increases the size of the spin gap instead of closing it as happens for . The inset of Fig. 1 shows the low field part of the magnetization at 50 mK in greater detail. We observe a linear increase between zero and the lower critical field , which can not be explained with a U(1) invariant Hamiltonian such as , where the magnetization is supposed to be zero at in the quantum PM region . This effect cannot be caused by single ion impurities, e.g. uncoupled Ni2+ moments, because such spins should be fully polarized for magnetic fields well below the lower critical field . Instead, we conclude that the linear slope (dotted line) is caused by a misalignment of the sample, which gives a contribution to the magnetization. From the value of the susceptibility compared to data for we estimate a misalignment of less than .
Furthermore, we measured the magnetization for near and in the temperature range 0.1 K0.5 K (data not shown) to extrapolate the phase boundary for 0.Yin08 We obtain a critical field of 2.08 T. It is important to note that this value depends on the specific conditions under which the sample is mounted in the experimental setup. The slightly higher value of in the magnetization compared to the specific heat and thermal expansion values (see data below) supports the assumption of small sample misalignment, because angular resolved measurements of the magnetostriction have shown that increases with increasing angle between the field direction and the crystallographic -axis.Zapf07
The small PM contribution to the magnetization made it necessary to refine the data as a function of temperature for . Figure 2 shows the corrected values plotted versus for a variety of different magnetic fields 1 T 3 T. The magnetization is exponentially suppressed at low temperatures inside the quantum PM state ( T) and develops a -behavior when approaching the critical field T in agreement with the expected behavior for a BEC-QCP in 3 dimensions. The entrance into the XY-AFM state well above is marked with a dip in the magnetization (arrows in Fig. 2). Below the minimum inside the AFM phase, the magnetization increases with a power law for decreasing temperature.
III.2 Specific Heat
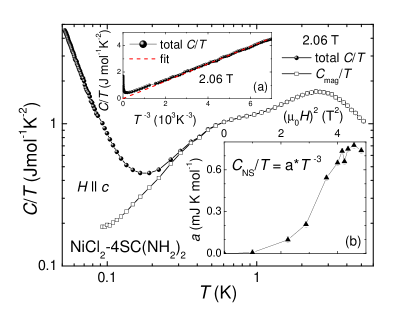
We estimate the critical field by MCE measurements (data not shown) following the analysis of the highest slope () of the temperature during field scansZapf06 and find a value 2.06 T in the specific-heat experimental setup.
The specific heat curve of DTN contains three contributions: nuclear Schottky (NS), magnetic Schottky (MS) and quantum-critical (QC) contributions. Each of them dominates in different regions of the phase diagram. The specific heat caused by phonons can be neglected in the temperature range below 5 K. The NS contribution is difficult to master in this material, because it originates from several nuclei (H, N, Cl) generating a huge fraction of the specific heat at temperatures below 0.1 K, see e.g. in Fig. 3 the measurement at 2.06 T. In addition, the effective magnetic field (sum of the external field and the field generated by the ordered moments) becomes rather high in the AFM ordered state above . This increases the splitting of the nuclear energy levels further and the Schottky anomaly becomes very big. The inset (a) of Fig. 3 demonstrates the way we subtracted the NS contribution from the original specific heat at the critical field . We fit the data between 80 mK and 50 mK as , which is a good approximation for the high temperature behavior of the Schottky anomaly.Gopal66 The prefactor for the NS specific heat is given as a function of magnetic field in the inset (b) of Fig. 3. The pre-factors for different nuclei should be additive, , for the case that all the different nuclear energy levels are in the high temperature limit (). Because the Zeeman splitting is linear in magnetic field, should obey a dependence for . This is not observed in DTN and presently not understood.
The insulating behavior of DTN is challenging for specific heat experiments, because no free electrons contribute to the thermal conductivity. Heat is carried only by magnetic excitations and by phonons, whereas the phonon contribution is negligibly small in the temperature range below 1 K. Therefore the different thermodynamic subsystems (nuclear spins, magnetic moments, lattice) are only poorly coupled to each other at low temperatures. This causes an out-of-equilibrium state of the sample at very low temperatures. Thus, we only include data above 80 mK in our analysis.
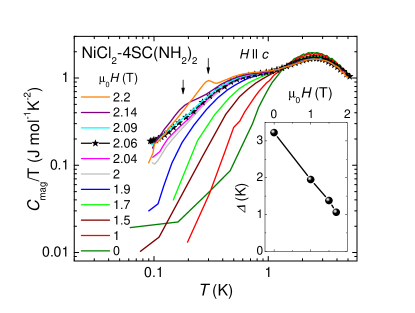
Figure 4 shows the magnetic specific heat in a double-logarithmic display after the subtraction of the nuclear Schottky contribution, , between 0 and 2.2 T. The broad maximum around 2.5 K in the zero field measurement is caused by the thermal population of the excited states that are a rather broad band due to dispersion caused by the exchange interactions.Zapf06 This dispersion is also responsible for the only slightly shift of the maximum to lower temperatures with higher magnetic fields. For small fields, the specific heat data can be fitted with an exponential function, in the low temperature limit allowing us to extract the spin gap . The inset of Fig. 4 shows the gap values, estimated from the experimental data. They decrease linearly from 3.22 K down to 1 K when varies between T and 1.7 T, whereas the zero-field value is in close accordance with previous susceptibility results of 3.3 K.PaduanFilho04b Below 1.7 T, the temperature range for exponential behavior is too small for reliable data fitting. From the zero field gap, K, we can estimate the critical field,
| (12) |
where the gap closes (JK-1 and JT-1). The calculated value 2.12 T matches the experimental values summarized in Table 2 within 5 %. The arrows in Fig. 4 indicate the anomalies caused by the phase transition into the XY-AFM state in the 2.14 T and 2.2 T measurement.
III.3 Thermal Expansion
The linear thermal expansion coefficient
| (13) |
is defined as the temperature derivative of the length change along a certain crystallographic direction . In tetragonal systems, such as DTN, the volumetric expansion can be calculated from the linear coefficients
| (14) |
along the crystallographic and direction.
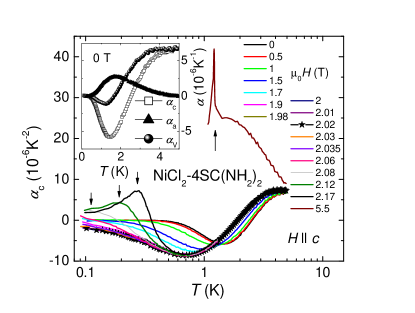
The main panel of Fig. 5 shows for between 0 and 5.5 T. For measurements well above , the transition into the ordered phase is indicated by a distinct anomaly, marked with arrows. In the temperature range up to 5 K no significant contribution from the lattice is observed. In zero field, shows a rather broad minimum that shifts to lower temperatures in higher fields and can be attributed to the thermal population of energetically higher spin states , similar to the maximum in the specific heat. In zero field these spin states are equally occupied, because they have same energy. The largest AFM exchange along the -axis leads to the dominant magnetostrictive effect. Since the PM ground state is a product of state to a good approximation, the thermal excitation of states increases the nearest-neighbor XY AFM correlations along the -axis . This increase leads to an attractive magnetostrictive force between nearest-neighbor ions along the -axis that shrinks the lattice as the temperature increases from zero. On the other hand, the magnetrostrictive force disappears at high enough temperature because for , implying that must have a minimum at a finite temperature where changes sign. This expected behavior is fully consistent with the experimental results shown in Fig. 5. The critical field for the thermal expansion measurements was estimated by detailed magnetostriction measurements, whereas the magnetostriction coefficient
| (15) |
is definded as the magnetic field derivative of the length change along the direction. The analysis of the data (not shown) gives T for and T for . The difference in the critical field values can be attributed to the application of small pressure on the sample during the experiment (see also section IV.4).
The inset of Fig. 5 compares , and for the zero-field measurement. Between 5 K and 3 K, the thermal expansion is dominated by the length change along the direction, , , because of the quasi-1 dimensional nature of the magnetic interactions in this temperature range. In the temperature range below 3 K, the thermal expansion coefficient is negative and has the minimum that is expected because the curve must change sign at a finite temperature. In contrast, the thermal expansion coefficient in the plane is positive for with a maximum at the temperature where the minimum occurs in . Calculating via Equation (14) reveals that the thermal expansion coefficients and strongly compensate each other and that the volume coefficient changes much less than the individual values.
IV Discussion
IV.1 Critical Field
| Thermodynamic quantity | (T) |
|---|---|
| Magnetization | 2.08 |
| Magnetocaloric effect (MCE) | 2.06 |
| Magnetostriction | 2.02 |
| Magnetostriction | 2.08 |
The values for the lower critical field , estimated individually for the different experimental quantities, are summarized in Table 2. The values vary by mT around 2.05 T. This difference can be attributed to the application of small pressure on the sample during the experiment. The spring-loaded capacitive dilatometer for thermal expansion and magnetostriction measurements can intrinsically apply a small amount of uniaxial pressure along the measured sample length. The misalignment of the crystal orientation out of indicated by the magnetization experiments, is another reason for variations in .
IV.2 Comparison Theory - Experiment
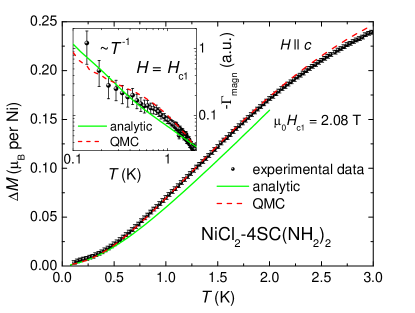
Fig. 6 shows a comparison between the experimental magnetization (symbols) at the critical field and analytical calculations (solid line) and QMC simulations (dashed line). We observe that the QMC and analytic results agree with the experimental data within the error bars below 0.5 K. A behavior is expected below 0.3 K for the BEC universality class, in contrast to dependence of an Ising-like QCP. While the analytic calculation is only valid at low temperatures (or low density of bosons) the QMC results remain valid at any temperature. This is the reason why the QMC results are in very good agreement with the experimental data up to 2.2 K.
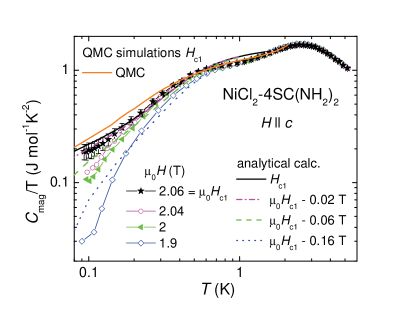
Figure 7 shows the experimental data of the specific heat, , (symbols) at and slightly below the critical field , compared with data of analytic calculations (broken lines) and QMC simulations (solid line) in a double logarithmic display. The experimental data exhibit a dependence in the low temperature limit at the critical field – in agreement with mean-field calculations and QMC simulations – which is characteristic for the 3-dimensional BEC universality class. We observe that the experimental data agree well within error bars with the analytic results down to the lowest temperatures, whereas there is a slight deviation of the QMC results below 0.3 K. This discrepancy is most likely due to a small error in the numerical determination of the critical field . A linear temperature dependence of the specific heat is expected for an Ising-like QCP, which we can exclude from our measurements. The broad Schottky maximum around 2.5 K in the experimental data originating from the population of excited spin states, can only be reproduced by the QMC simulations because they remain valid up to arbitrarily high temperatures. Seen in the experimental data as well as in the QMC results is the crossover from 3 dimensional () to 1 dimensional () behavior of the specific heat at higher temperatures for the measurement at . The change of slope is marked with a broad hump around 0.5 K. Note that the 1-dimensional temperature dependence overlaps with the above mentioned Schottky contribution to the specific heat.
For measurements, the analytical curves as well as the experimental values lie below the specific heat data at the critical field. They grow smaller as the distance from increases. This observation confirms the correct estimation of the value T for the critical field in the MCE measurements. Furthermore, Fig. 7 shows nice agreement between analytical predictions and experimental data at low temperatures for all shown fields. Deviations seem to be larger for , but this is an effect of the double-logarithmic display.
In presence of Ising-like anisotropy, the gap should reopen inside the AFM phase. We do not observe any exponential temperature dependence in the measurements for fields above in Fig. 4, namely 2.09 T, 2.14 and 2.2 T. This, however, could also be due to (i) lack of data at temperatures below 80 mK and (ii) the onset of the phase transition seen as a broad anomaly in the specific heat.
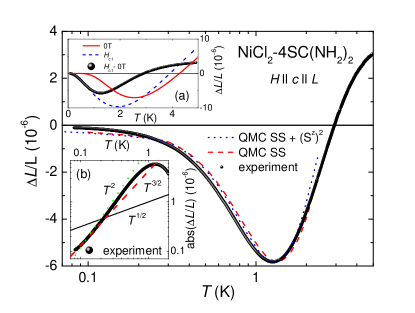
Before we discuss the scaling behavior of the thermal expansion coefficient at the critical field, let us have a closer look at the length change , which is shown in Fig. 8 along with results from QMC simulations. The inset (a) of Fig. 8 shows the experimental length at the critical field after the subtraction of the data in 0 T, in order to separate quantum critical from the non-critical magnetic contributions of the sample. The same procedure was done for QMC data. In QMC simulations, at is obtained from the estimation of the spin-spin correlator (SSC), Zapf08 and optionally additional terms. The main panel of Fig. 8 shows the comparison between the experimental data and QMC simulations. The qualitative features are well reproduced by the expectation value of the SSC for temperatures above 0.3 K. The scaling factor between experiment and theory is . follows a power law with between 2 and 3/2 as illustrated in inset (b) of Fig. 8. This result is in close accordance with the expected BEC behavior of The discrepancy between experimental data and QMC simulations below 0.3 K can be attributed to additional contributions to besides the SSC. However, an additional consideration of a term that is expected from symmetry arguments, does not improve the agreement significantly. Therefore, the origin of this discrepancy remains unclear at the present level of analysis.
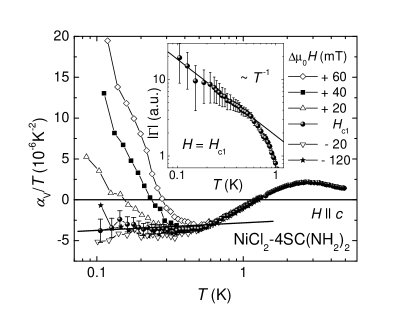
Figure 9 summarizes the volumetric thermal expansion coefficient divided by the temperature for fields at and close to the QCP. Note, that according to equation (14) different critical values were considered for and and taken into account for the estimation of . We find, that at the values have a weak, but finite temperature dependence (solid line) meaning that the thermal expansion coefficient diverges as expected at the QCP. For magnetic fields the low-temperature values show similar behavior.
In general, pressure and magnetic field are equivalent parameters of the free energy in close vicinity to the critical field . Therefore, thermodynamic quantities derived from pressure and field dependencies can be converted
| (16) |
by multiplication with the prefactor , which is the hydrostatic pressure dependence of the critical field .
Equation (16) implies that the compressibility is proportional to the magnetic susceptibility that is a step function of the magnetic field at and is shown in Fig. 10. Therefore, increases rapidly at and leads to a softening of the crystal lattice, recently demonstrated experimentally on DTN by ultrasound experiments.Chiatti08 Considering this, we speculate, that the huge change in the lattice properties is responsible for the deviation of from the exact behavior of a BEC. Similar crystal softening as a precursor for quantum criticality was e.g. also observed at the metamagnetic transition in CeRu2Si2.Weickert10
The thermal expansion coefficient for fields above shows the clear onset of the phase transition with positive values .
IV.3 Grüneisen Parameter
The magnetic Grüneisen parameter, , is given in the inset of Fig. 6 and compared with theoretical data of the QMC simulation and the analytical calculations. In the temperature range below 0.3 K, the experimental shows the onset of divergence, as expected for a QCP. As far as it is observable in the low temperature limit, follows the theoretical prediction , because the magnetization and specific heat obey the expected behavior individually. For the thermal Grüneisen parameter, , shown in the inset of Fig. 9, a behavior is found as well for temperatures below 0.6 K. These observations are in fully agreement with the universality class of a BEC QCP.
IV.4 Ehrenfest relations
The anomalies at the phase boundaries observed in the thermal expansion coefficient, , the specific heat, , the magnetostriction coefficient, , and the magnetization, , allow us to obtain the pressure dependence of (i) the transition temperature
| (17) |
and of (ii) the critical field
| (18) |
by the Ehrenfest relations, which hold at phase transitions of second order. Equations (17,18) are valid for uniaxial as well as hydrostatic pressure, dependent if the linear or volume coefficients or are used in the analysis.
We find K GPa-1 at T for uniaxial pressure applied along the crystallographic direction. This value is rather high, even compared to TlCuCl3, which already exhibits a huge value of several Kelvin per GPa dependent on the considered field range.Johannsen05 Direct measurements of the thermal expansion are currently not available, however, from measurements in small magnetic fields , we expect a negative uniaxial pressure dependence that should partially cancel the value (18.5 K GPa-1) along , leading to a smaller but positive hydrostatic value. Similar behavior was observed in TlCuCl3.Johannsen05
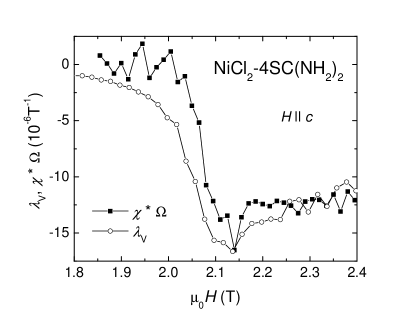
The pressure dependence of the critical field, , could be obtained at 0.1 K for both directions and . Because of a negative jump in the magnetostriction coefficient at (data not shown), the value = - 6.76 T GPa-1 is negative. In contrast, =1.84 T GPa-1 is positive and the resulting hydrostatic pressure dependence, which is equivalent to the prefactor in equation 16, adds to - 3.07 T GPa-1. The correct estimate of can be proved by a comparison of with the magnetic susceptibility measured at 0.1 K. Both thermodynamic quantities are linked via equation (16) and it follows
| (19) |
Figure 10 shows an excellent agreement between the magnetostriction coefficient and the scaled susceptibility . We conclude from the analysis of the Ehrenfest relations, that the application of uniaxial pressure along the direction increases the ordering temperature and reduces the critical field . The behavior is opposite for uniaxial pressure along the direction. The response of DTN to hydrostatic pressure is dominated by the uniaxial pressure dependence along the axis because this is the direction of the dominant magnetic exchange interaction.
V Summary
We present a comprehensive experimental and theoretical study of the thermodynamic properties: specific heat, magnetization, and thermal expansion in the vicinity of the field-induced QCP around T in NiCl2-4SC(NH2)2. This point marks the entrance into an 3-dimensional XY antiferromagnetically ordered state and can be described within the formalism of a BEC of magnons. We find a low temperature behavior of the specific heat and the magnetization at that are in agreement with the universality class of a BEC-QCP. The thermal expansion coefficient shows a temperature dependence with for , which is in close agreement with expectations for this kind of QCP. QMC simulations nicely reproduce the features observed in the magnetization, specific heat and thermal expansion over a broad temperature range. Only the low temperature dependence in the specific heat and thermal expansion deviates due to intrinsic uncertainties in the simulation method. Furthermore, we analysed the thermal, , as well as the magnetic Grüneisen parameter , which are key quantities for the identification of QCPs and diverge with specific power laws. Experimentally, we found a
divergence for and as expected for a BEC-QCP. Moreover, we estimated the influence of pressure on the transition temperature, , and the critical field, and found opposite effects for uniaxial pressure along the crystallographic and axes. Uniaxial pressure along () direction increases (reduces) the ordering temperature while it reduces (increases) the critical field . Due to the quasi-1 dimensional character of the exchange interactions in DTN, the application of hydrostatic pressure increases and reduces . Our results encourage pressure experiments that shift to zero field. Since the field induced QCP is BEC-like, the pressure induced QCP should belong to the universality class in dimension .
Acknowledgements.
FW was funded by the MPG Research initiative: Materials Science and Condensed Matter Research at the Hochfeldmagnetlabor Dresden. MJ acknowledges hospitality at the MPI for Chemical Physics of Solids, where the experiments were carried out. VSZ acknowledges funding via LDRD/DR project 20100043DR and LP was partially supported by CONACyT.References
- (1) T. Matsubara and H. Matsuda, Prog. Theor. Phys. 16, 569 (1956).
- (2) E. G. Batyev, L. S. Braginskii, Sov. Phys. JETP 60, 781 (1984).
- (3) C. D. Batista and G. Ortiz, Phys. Rev. Lett. 86, 1082 (2001).
- (4) C. D. Batista and G. Ortiz, Adv. in Phys. 53, 1 (2004).
- (5) T. Nikuni, M. Oshikawa, A. Oosawa, H. Tanaka, Phys. Rev. Lett. 84, 5868, (2000).
- (6) T. Giamarchi, C. Rüegg, O. Tchernyshyov, Nature physics 4, 198 (2008).
- (7) V. S. Zapf, M. Jaime, C. D. Batista, Rev. Mod. Phys. to be published (2012).
- (8) A. Paduan-Filho, R. D. Chirico, K. O. Joung, R. L. Carlin, J. Chem. Phys. 74, 4103 (1981).
- (9) S. A. Zvyagin, J. Wosnitza, C. D. Batista, M. Tsukamoto, N. Kawashima, J. Krzystek, V. S. Zapf, M. Jaime, N. F. Oliveira Jr., A. Paduan-Filho, Phys. Rev. Lett. 98, 047205 (2007).
- (10) L. Yin, J. S. Xia, V. S. Zapf, N. S. Sullivan, A. Paduan-Filho, Phys. Rev. Lett. 101, 187205 (2008).
- (11) L. Zhu, M. Garst, A. Rosch, and Q. Si, Phys. Rev. Lett. 91, 066404 (2003).
- (12) M. Garst and A. Rosch, Phys. Rev B 72, 205129 (2005).
- (13) R. Küchler, N. Oeschler, P. Gegenwart, T. Cichorek, K. Neumaier, O. Tegus, C. Geibel, J. A. Mydosh, F. Steglich, L. Zhu, Q. Si Phys. Rev. Lett. 91, 066405 (2003).
- (14) K. Takatsu, W. Shiramura, H. Tanaka, J. Phys. Soc. Jap. 66, 1611 (1997).
- (15) B. R. Patyal, B. L. Scott, R. D. Willett, Phys. Rev. B 41, 1657 (1990).
- (16) A. Oosawa, M. Ishii, H. Tanaka, J. Phys.: Cond. Mat. 11, 265 (1999).
- (17) B. C. Watson, V. N. Kotov, M. W. Meisel, D. W. Hall, G. E. Granroth, W. T. Montfrooij, and S. E. Nagler, D. A. Jensen, R. Backov, M. A. Petruska, G. E. Fanucci, D. R. Talham, Phys. Rev. Lett. 86, 5168 (2001).
- (18) T. Lorenz, S. Stark, O. Heyer, N. Hollmann, A. Vasiliev, A. Oosawa, H. Tanaka J. Magn. Magn. Mater. 316, 291 (2007).
- (19) T. Lorenz, O. Heyer, M. Garst, F. Anfuso, A. Rosch, C. Rüegg, K. Krämer Phys. Rev. Lett. 100, 067208 (2008).
- (20) A. Paduan-Filho, X. Gratens, N. F. Oliveira Jr., Phys. Rev. B. 69, 020405(R) (2004).
- (21) V.S. Zapf, V.F. Correa, C.D. Batista, T.P. Murphy, E.D. Palm, M. Jaime, S. Tozer, A. Lacerda, A. Paduan-Filho J. Appl. Phys. 101, 09E106 (2007).
- (22) T. Sakakibara, H. Mitamura, T. Tayama, H. Amitsuka, Jpn. J. Appl. Phys. 33, 5067 (1994).
- (23) R. Pott, R. Schefzyk, J. Phys. E: Sci. Instr. 16, 444 (1983).
- (24) H. Wilhelm, T. Lühmann, T. Rus, F. Steglich, Rev. Sci. Instr. 75, 2700 (2004).
- (25) S. Riegel, G. Weber, J. Phys. E: Sci. Instr. 19, 790 (1986).
- (26) See for instance A. A. Abrikosov, L. P. Gorkov, and I. E. Dzyaloshinskii, “Methods of Quantum Field Theory in Statistical Physics”, Dover Publications, NY (1975).
- (27) Y. Kohama, A. V. Sologubenko, N. R. Dilley, V. S. Zapf, M. Jaime, J. A. Mydosh, A. Paduan-Filho, K. A. Al-Hassanieh, P. Sengupta, S. Gangadharaiah, A. L. Chernyshev, C. D. Batista, Phys. Rev. Lett. 106, 037203 (2011).
- (28) O. F. Syljuåsen and A. W. Sandvik, Phys. Rev. E 66, 046701 (2002).
- (29) A. W. Sandvik and J. Kurkijärvi, Phys. Rev. B 43, 5950 (1991); A. W. Sandvik, Phys. Rev. B 56, 11678 (1997).
- (30) A. W. Sandvik, Phys. Rev. B 59, R14157 (1999).
- (31) K. Hukushima, H. Takayama, K. Nemoto, Int. J. Mod. Phys. C 7, 337 (1996); K. Hukushima, K. Nemoto, J. Phys. Soc. Jpn. 65, 1604 (1996)
- (32) P. Sengupta, A. W. Sandvik, and D. K. Campbell, Phys. Rev. B 65, 155113 (2002).
- (33) E. Marinari, Lecture Notes in Physics, Vol. 501 Advances in computer simulation: lectures held at the Eötvös Summer School in Budapest, Hungary, 16-20, July 1996, edited by J. Kertsz and I. Kondor (Springer, 1998).
- (34) P. Sengupta, A. W. Sandvik, and R. R. P. Singh, Phys. Rev. B 68, 094423 (2003).
- (35) V. S. Zapf, D. Zocco, B. R. Hansen, M. Jaime, N. Harrison, C. D. Batista, M. Kenzelmann, C. Niedermayer, A. Lacerda, A. Paduan-Filho, Phys. Rev. Lett. 96, 077204 (2006).
- (36) A. Paduan-Filho, X. Gratens, N. F. Oliveira Jr., J. Appl. Phys. 95, 7537 (2004).
- (37) E. S. R. Gopal: Specific Heats at Low Temperatures, Plenum Press, New York, (1966).
- (38) V. S. Zapf, V. F. Correa, P. Sengupta, C. D. Batista, M. Tsukamoto, N. Kawashima, P. Egan, C. Pantea, A. Migliori, J. B. Betts, M. Jaime, A. Paduan-Filho, Phys. Rev. B 77, 020404(R) (2008).
- (39) O. Chiatti, A. Sytcheva, J. Wosnitza, S. Zherlitsyn, A. A. Zvyagin, V. S. Zapf, M. Jaime, A. Paduan-Filho, Phys. Rev. B 78, 094406 (2008).
- (40) F. Weickert, M. Brando, F. Steglich, P. Gegenwart, M. Garst, Phys. Rev. B 81, 134438 (2010) and references therein.
- (41) N. Johannsen, A. Vasiliev, A. Oosawa, H. Tanaka, T. Lorenz, Phys. Rev. Lett. 95, 017205 (2005)