Probing the time variability of five Fe low broad absorption line quasars ††thanks: Uses archival data based on observations carried out at the European Southern Observatory (ESO), under programmes 267.B-5698 and 71.B-0121.
Abstract
We study the time variability of five Fe Low ionization Broad Absorption Line (FeLoBAL) QSOs using repeated spectroscopic observations with the 2m telescope at IUCAA Girawali observatory (IGO) spanning an interval of upto 10 years. We report a dramatic variation in Al iii and Fe iii fine-structure lines in the spectra of SDSS J221511.93-004549.9 ( 1.478). However, there is no such strong variability shown by the C iv absorption. This source is known to be unusual with (i) the continuum emission dominated by Fe emission lines, (ii) Fe iii absorption being stronger than Fe ii and (iii) the apparent ratio of Fe iii UV 48 to Fe iii UV 34 absorption suggesting an inverted population ratio. This is the first reported detection of time variability in the Fe iii fine-structure lines in QSO spectra. There is a strong reduction in the absorption strength of these lines between year 2000 and 2008. Using the template fitting techniques, we show that the apparent inversion of strength of UV lines could be related to the complex spectral energy distribution of this QSO. The observed variability can be related to change in the ionization state of the gas or due to transverse motion of this absorbing gas. The shortest variability timescale of Al iii line gives a lower limit on the electron density of the absorbing gas as cm-3. The remaining 4 FeLoBALs do not show any changes beyond the measurement uncertainties either in optical depth or in the velocity structure. We present the long-term photometric light curve for all of our sources. Among them only SDSS J221511.93-004549.9 shows significant ( 0.2 mag) variability.
keywords:
galaxies: active; quasars: absorption lines; quasars: general; quasars: individual:(SDSS J030000.57+004828.0, SDSS J031856.62-060037.7, SDSS J083522.77+424258.3, SDSS J084044.41+363327.8, SDSS J221511.93-004549.9)1 Introduction
Broad Absorption Line (BAL) quasars form 20 - 40% of the QSO population (Hewett & Foltz, 2003; Reichard et al., 2003; Trump et al., 2006; Dai et al., 2008; Stalin et al., 2011; Allen et al., 2011) and are characterized by the presence of broad absorption lines spreading over 5000 - 50000 km s-1 (Green et al., 2001). BAL QSOs are further classified into three sub-groups based on the material producing the BAL troughs. High-ionization BALs(HiBALs) contain strong, broad absorption troughs of highly ionized species such as C iv, O vi and N v and are typically identified through the presence of C iv absorption troughs. Low-ionization BALs (LoBALs) contain absorption from low-ionization species such as Mg ii, Al ii or Al iii in addition to the standard absorption lines seen in HiBALs. The LoBALs comprise about 15% of the BAL population. A small sub-set of LoBALs with excited-state Fe ii or Fe iii absorption are termed as FeLoBALs (Wampler et al., 1995). Only 13 of the LoBALs (i.e 1% of the total BAL population) are FeLoBALs. The catalog of BAL quasars in SDSS-DR3 by Trump et al. (2006) has 138 FeLoBALs. As these QSOs are very rare, they are not a well studied population of BALQSOs.
FeLoBALs are also found to be the most reddened ones among BAL quasars (Reichard et al., 2003). The FeLoBALs are found to be extremely IR-luminous (Farrah et al., 2007), with IR luminosities comparable to those of Ultra-Luminous Infrared galaxies (ULIRG). Hence, FeLoBAL phenomenon could be considered as a transition stage in a ULIRG when the star burst is at or near its end, and the central QSO is starting to throw off its dust cocoon (Voit et al., 1993; Farrah et al., 2007). This scenario strongly favours the theory of BAL QSO to be an evolutionary stage in a quasar lifetime, rather than an orientational effect. The C iv BALs are referred to be located at a distance 1 pc (e.g. Capellupo et al., 2011). However, ionization parameter and density estimates of some of the FeLoBALs are consistent with the absorbing gas at 1 kpc from the continuum source (Korista et al., 2008; Moe et al., 2009; Dunn et al., 2010; Bautista et al., 2010; Faucher-Giguère et al., 2012). This together with very small inferred thickness of the cloud prompted Faucher-Giguère et al. to suggest that FeLoBALs must be formed in situ at large radii through interaction of QSO blast wave in the interstellar medium (ISM) of the host galaxy. In this scenario the time evolution of the post shock gas will be seen as the absorption line variability.
| QSO | Instrument | Date | MJD | Exposure Time | Coverage | Resolution | S/Na |
| (mins) | () | (kms-1) | |||||
| SDSS | 29-09-2000 | 51816 | 45x1 | 3800-9200 | 150 | 44 | |
| SDSS | 29-11-2000 | 51877 | 50x1 | 3800-9200 | 150 | 40 | |
| J03000048 | SDSS | 23-10-2001 | 52205 | 45x1 | 3800-9200 | 150 | 33 |
| IGO/IFOSC 7 | 12-12-2007 | 54446 | 35x2 | 3800-6840 | 310 | 5 | |
| IGO/IFOSC 7 | 27-12-2008 | 54817 | 45x8 | 3800-6840 | 310 | 54 | |
| SDSS | 15-01-2001 | 51924 | 80x1 | 3800-9200 | 150 | 27 | |
| IGO/IFOSC 8 | 14-12-2007 | 54448 | 45x3 | 5800-8350 | 240 | 10 | |
| IGO/IFOSC 7 | 09-01-2008 | 54474 | 45x3 | 3800-6840 | 310 | 23 | |
| J03180600 | IGO/IFOSC 8 | 27-11-2008 | 54797 | 45x3 | 5800-8350 | 240 | 21 |
| IGO/IFOSC 7 | 31-01-2009 | 54862 | 45x4 | 3800-6840 | 310 | 19 | |
| IGO/IFOSC 8 | 23-12-2009 | 55188 | 45x4 | 5800-8350 | 240 | 19 | |
| IGO/IFOSC 7 | 24-12-2009 | 55189 | 45x4 | 3800-6840 | 310 | 17 | |
| SDSS | 19-11-2001 | 52232 | 48x1 | 3800-9200 | 150 | 26 | |
| J08354242 | IGO/IFORS 1 | 14-12-2007 | 54448 | 45x3 | 3270-6160 | 370 | 9 |
| IGO/IFOSC 7 | 05-12-2008 | 54805 | 45x3 | 3800-6840 | 310 | 21 | |
| IGO/IFOSC 7 | 21-01-2010 | 55217 | 45x3 | 3800-6840 | 310 | 29 | |
| SDSS | 15-02-2002 | 52320 | 50x1 | 3800-9200 | 150 | 40 | |
| IGO/IFOSC 7 | 20-12-2006 | 54089 | 45x3 | 3800-6840 | 310 | 8 | |
| J08403633 | IGO/IFOSC 7 | 12-12-2007 | 54446 | 45x3 | 3800-6840 | 310 | 23 |
| IGO/IFOSC 7 | 07-12-2008 | 54807 | 45x4 | 3800-6840 | 310 | 26 | |
| IGO/IFOSC 7 | 17-12-2009 | 55182 | 45x6 | 3800-6840 | 310 | 50 | |
| SDSS | 04-09-2000 | 51804 | 53x1 | 3800-9200 | 150 | 41 | |
| VLT/UVES | 11-08-2001 | 52145 | 60x2 | 3000-11000 | 7.3 | 43 | |
| VLT/FORS1 | 20-09-2003 | 52902 | 5x1 | 3300-11000 | 250 | 62 | |
| IGO/IFOSC 7 | 31-10-2008 | 54783 | 45x3 | 3800-6840 | 310 | 30 | |
| IGO/IFOSC 7 | 01-11-2008 | 54784 | 45x1 | 3800-6840 | 310 | 23 | |
| J22150045 | IGO/IFOSC 8 | 01-11-2008 | 54784 | 45x4 | 5800-8350 | 240 | 39 |
| IGO/IFORS 1 | 02-01-2010 | 55211 | 45x1 | 3270-6160 | 370 | 11 | |
| IGO/IFORS 1 | 04-01-2010 | 55213 | 45x3 | 3270-6160 | 370 | 15 | |
| MagE | 10-08-2010 | 55431 | 15x1 | 3100-10000 | 70 | 16 | |
| IGO/IFORS 7 | 14-12-2010 | 55557 | 45x2 | 3800-6840 | 310 | 7 | |
| IGO/IFORS 7 | 15-12-2010 | 55558 | 45x1 | 3800-6840 | 310 | 9 | |
| IGO/IFORS 7 | 18-12-2010 | 55561 | 45x2 | 3800-6840 | 310 | 11 | |
| IGO/IFORS 1 | 12-12-2011 | 55920 | 45x3 | 3270-6160 | 370 | 14 | |
| IGO/IFORS 1 | 14-12-2011 | 55922 | 45x4 | 3270-6160 | 370 | 17 |
a calculated over the wavelength range 5800-6200
Repeated BAL monitoring studies could greatly help us in understanding the location and physical conditions in the absorbing gas and the physical mechanisms responsible for quasar outflows. Time variability of Si iv and C iv BALs in individual sources has been reported in several BALQSOs: Q1303+308 (Foltz et al., 1987), Q1413+113 (Turnshek et al., 1988), Q1246-057 (Smith & Penston, 1988), UM 232 (Barlow et al., 1989), QSO CSO 203 (Barlow et al., 1992), Tol 1037-270 (Srianand & Petitjean, 2001), J1054+0348 (Hamann et al., 2008) and FBQS J1408+3054 (Hall et al., 2011). Lundgren et al. (2007) have reported significant time variability among a sample of 36 C iv BALs on rest frame timescales shorter than 1 year. Gibson et al. (2008) also report a similar result in a sample of 13 quasars (1.7 2.8) over 3-6 (rest frame) years. Gibson et al. (2010) investigated the C iv BAL variability of 14 sources at redshifts 2.1 and report complex variations in the sample. In these cases, change in the rest equivalent width of absorption lines are used as an indicator of variability. This requires continuum fitting that is in general ambiguous in the case of BALQSOs. Capellupo et al. (2011) have studied C iv BAL variability in 34 luminous QSOs over short (4-9 months) and long (3.8-7.7 years) timescales. They use flux differences between two epoch data at the absorption trough to quantify the variability. However, no such studies are reported for the LoBALs and in particular there is no case reported showing the variability of absorption lines originating from excited fine-structure levels in the case of BALQSOs.
QSO feedback plays an important role in the evolution of the host galaxy. If FeLoBALs represent a transition state (or post shock ISM gas) as discussed above, then repeated spectroscopic monitoring of these sources will shed light on the evolutionary scenarios of QSOs. In this paper, we report the nature of time variability in a sample of five FeLoBAL quasars. This is a sub-sample of our ongoing spectroscopic monitoring campaign on time variability of absorption lines in a sample of 27 LoBAL quasars. Three of the sources, SDSS J030000.57+004828.0 (hereafter SDSS J0300+0048), SDSS J031856.62-060037.7 (hereafter SDSS J0318-0600) and SDSS J221511.93-004549.9 (hereafter SDSS J2215-0045) are from the 23 Sloan Digital Sky Survey (SDSS) Early Data Release (EDR) listed quasars identified by Hall et al. (2002) as BAL quasars exhibiting various unusual properties. The other two sources are SDSS J083522.77+424258.3 (hereafter SDSS J0835+4242) and SDSS J084044.41+363327.8 (hereafter SDSS J0840+3633).
This manuscript is arranged as follows. In section 2 we provide details of observation and data reduction. Discussion on individual sources in our sample are presented in Section 3. Implications of the variability seen in SDSS J2215-0045 are presented in section 4 and the main results are summarized in Section 5.
2 Observation and Data Reduction
Most of the new observations presented here were carried out using the 2m telescope at IUCAA Girawali observatory (IGO). The spectra were obtained using the IUCAA Faint Object Spectrograph (IFOSC). The detailed log of these observations together with that of the archival SDSS data and the data from the literature are given in Table 1. Spectra were originally obtained mainly using three grisms, Grism 1, Grism 7 and Grism 8 of IFOSC in combination with 1.5 arcsec slit. This combinations has a wavelength coverage between 3270 - 6160 Å, 3800 - 6840 Å and 5800 - 8350 Å for the above three grisms respectively. Typically the observations were split in to exposures of 45 minutes. All the raw frames were processed using standard IRAF111IRAF is distributed by the National Optical Astronomy Observatories, which are operated by the Association of Universities for Research in Astronomy, Inc., under cooperative agreement with the National Science Foundation. tasks. One dimensional spectra were extracted from the frames using the “doslit” task in IRAF. We opted for the variance-weighted extraction as compared to the normal one. Wavelength calibrations were done using standard helium neon lamp spectra and flux calibrations were done using a standard star spectrum observed on the same night. Air-to-vacuum conversion was applied before adding the spectra. Individual spectra were combined using 1/ weighting in each pixel after scaling the overall individual spectra to a common flux level within a sliding window. The error spectrum was computed taking into account proper error propagation during the combining process.
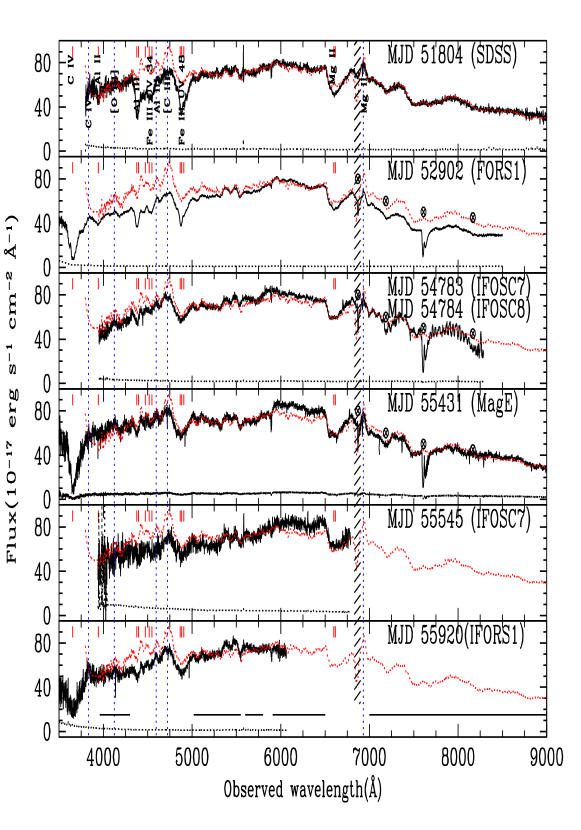
Our IGO spectrum of J2215-0045 taken in 2008 has shown dramatic variability as compared to the archival SDSS spectrum. To confirm this trend we obtained a moderate resolution echellete spectrum of the source using the Magellan Echellette (MagE) Spectrograph mounted on the Clay (Magellan II) telescope. We used 1 arcsec slit and 11 binning for our observations. The available grating in combination with the 1 arcsec slit gives a resolution of R=4200 and wavelength coverage of 3000-10000 . Spectrophotometric standards were also observed for flux calibrations. MagE Data was reduced using the MagE Spectral Extractor (MASE) pipeline (Bochanski et al., 2009). MASE is an IDL based pipeline containing a graphic user interface (GUI) for reducing MagE data. VLT-UVES data (Program ID: 267.B-5698) taken on 2001 is available for this source in the VLT archive. We also used the VLT-FORS1 data (Program ID: 71.B-0121) obtained for this source in 2003 and made available to us by Dr. DiPompeo (DiPompeo et al., 2011).
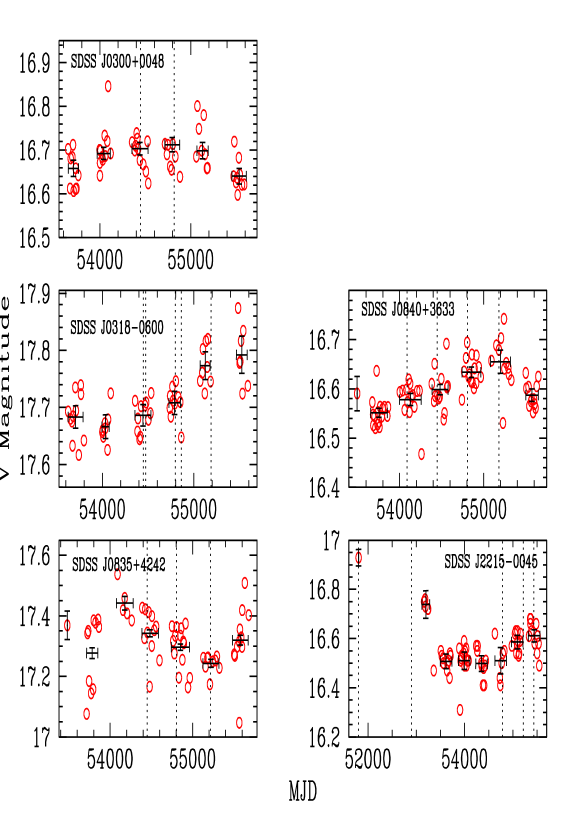
In Fig. 1, we plot for all our sources Johnson’s V magnitude from the Catalina Real-Time Transient Survey (CRTS; Drake et al. (2009)) as described below. CRTS operates with an unfiltered set up and the resulting magnitudes are converted to V magnitudes using the transformation equation V=Vins+a(v)+b(v)*(B-V), where, is the observed open magnitude, a(v) and b(v) are the zero point and the slope. The zero point and slope are obtained from three or more comparison stars in the same field with the zero point typically being of the order of 0.08. CRTS provides four such observations taken 10 minutes apart on a given night. For our lightcurves we have averaged these four points (or less if one or more of those coincided with bad areas) and plotted those against the modified Julian date (MJD). The data used in these light curves are taken between April 2005 to July 2010. The dotted vertical lines show the epochs of our spectroscopic observations. For, J2215-0045, we could get the photometric data since 2004. The first point in the light curve for this source is obtained using and magnitudes in the SDSS and the transformation equation given by Jester et al. (2005) for QSOs at . For the other three sources we did not transform the SDSS magnitudes to Johnson V magnitude as and band fluxes are affected by strong broad absorption lines. For all the sources, we have overplotted the average magnitudes obtained for closely spaced observations. The period over which the magnitudes are averaged are shown by x-axis error bars.
From the light curves, it is clear that continuum variability is apparent in all the sources. However, continuum variability at the level of 0.2 mag is seen only in the case of J2215-0045. The source has brightened by 0.3 mag when we consider only the CRTS points. The brightening could be up to 0.5 mag when we also include the transformed SDSS mag.
3 Notes on Individual Objects
In this section, we summarize the properties of individual absorbers in our sample and discuss our monitoring results.
3.1 SDSS J0300+0048
SDSS J0300+0048 (=0.8918) is part of a binary QSO with SDSS J025959.69+004813.5 (=0.8923), a non-BAL QSO at a projected separation of 19.8 arc sec. It is only the fourth QSO known to have a Ca ii BAL trough. The outflow is blue shifted by 1650 kms-1 from the systemic redshift of the QSO. Hall et al. (2003) obtained the high resolution UVES spectrum of this source and found that extremely broad Mg ii, Fe ii and its fine-structure line absorptions are also present along with the strong Ca ii absorption. They also found that the lowest velocity BAL region has a strong Ca ii absorption without significant associated excited Fe ii absorption, while the higher velocity excited Fe ii absorption region has very little Ca ii absorption. The reported Ca ii, Mg ii and Mg i column densities are very high and the corresponding gas phase metallicity is found to be fifteen times the solar value. Comparing this large column densities to that of QSO J2359-1241, Hall et al. (2003) argued that this source must have a strong hydrogen ionization front where the Ca ii exists outside the H i front. As the lowest ionization gas is found at lowest velocities, they explained the detached flow in SDSS J0300+0048 by the radiatively driven disk wind model by Murray & Chiang (1995). Apart from the BAL, there is a narrow associated absorption system detected by Ca ii, Mg ii, Mg i and Fe ii lines at a redshift of =0.8918. Hall et al. (2003) have also suggested that the optical part of the QSO continuum is dominated by the Fe ii and Fe iii emission line blends. An important feature of this spectrum is that the flux values never return to the continuum values (as shown by Hall et al., 2003) shortward of the rest wavelength 3000 Å ( 5675 Å). Also emission bumps seen around the rest wavelength range 3000-3300 Å ( 5675 - 6240 Å) are consistent with them being dominated by Fe emission.
 |
 |
 |
 |
 |
 |
 |
 |
 |
 |
 |
 |
 |
 |
 |
 |
 |
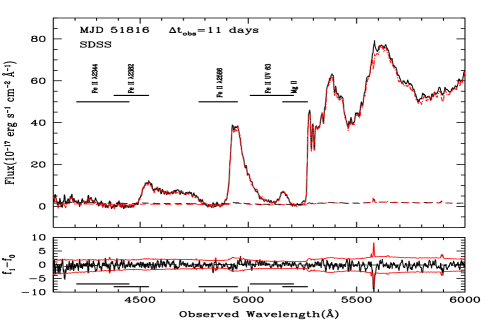
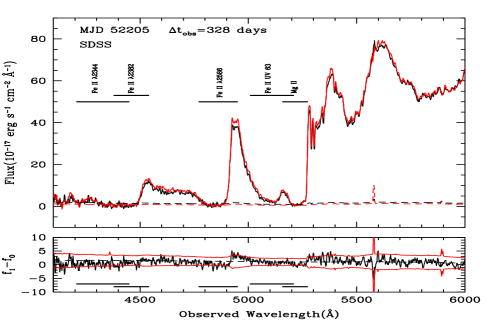
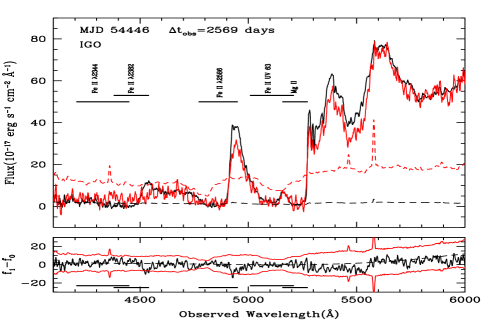
In Fig. 2 we compare different SDSS and IGO spectra with the reference SDSS spectrum observed on MJD 51877. The spectra are aligned by a simple scaling of the mean flux. The spectral ranges covered by absorption of different species are marked with horizontal lines in each panel. It is clear from the Fig. 2 that there are additional absorption at the rest wavelength of 4950 Å that cannot be accommodated by the Fe ii UV63 absorption. This could be due to an additional blue shifted Mg ii component not identified by Hall et al. (2003). The corresponding Fe ii UV2 absorption can explain the absorption trough at 4950 Å seen in Fig. 2. In bottom of each panel we show the difference between the two spectra plotted in the upper part together with the associated errors estimated from the error spectra. If required, in order to take care of spectral slope differences, we have fitted a lower order polynomial to the difference spectra considering regions that are devoid of absorption lines. For all the sources, the spectra are smoothed by 5 pixels for better presentation. However, the unsmoothed spectra are used for obtaining the difference and ratio spectrum.
The two epoch SDSS data and our IGO spectrum obtained in year 2007 (MJD 54446) are nearly consistent with the reference SDSS spectrum within measurement uncertainties. We do not find any significant deviations in the difference spectra at the locations of strong absorption lines. However, it must be remembered that Mg ii and Fe ii transitions are highly saturated. Therefore, we may not be able to detect small column density variations. However, part of the absorption by Fe ii fine-structure transition UV 63 is unsaturated. So, if there is any variability we should have detected the same. From Fig. 2 it is clear that even this transition does not show any detectable variability.
However, the plot suggests some differences between the SDSS and IGO spectrum obtained in the year 2008. This is evident from the fact that the feature around 4700 Å is consistently stronger in the IGO spectrum. The difference spectrum is found to be consistently above zero over 200 pixels suggesting an excess at 10 level. As discussed before, this part of the spectrum never recovers to the expected continuum level and therefore is subject to some absorption. This could be Fe ii2600 absorption of the possible blue component discussed above. Similarly, we see significant deviation at Å. The continuum emission in this region is dominated by Fe ii and Mg ii emission. Therefore the variability is not related to absorption line variability.
So, we conclude that major part of BAL absorption lines of SDSS J0300+0048 that contains Fe ii fine structure and Ca ii (as identified by Hall & Hutsemèkers, 2003) has not varied significantly over a time period of 4.2 years in the quasar rest frame. From Fig. 1, we notice that on an average the V magnitude of this QSO remained same with in 0.05 mag over several years. Thus the photoionization induced variability is not expected as well. However, we report the possible variation of the bluest component. Future monitoring observations are needed to confirm the nature of the noted variability.
3.2 SDSS J0318-0600
SDSS J0318-0600 is a bright, reddened FeLoBAL of emission redshift = 1.9669. Bautista et al. (2010) and Dunn et al. (2010) studied the high resolution VLT spectrum of this source and identified 11 absorption components spanning a velocity range of 7400 to 2800 km s-1with the absorbing clouds fully covering the emitting regions of the background QSO. From photoionization models, they report super-solar abundances, an electron density of 103.3±0.2 cm-3 and the distance from the emission source to the strongest component as 63 kpc. The ratio of measured kinetic to bolometric luminosities is large enough to consider this outflow a significant contributor to quasar feed back mechanism (Faucher-Giguère et al., 2012). The observed IGO spectra at various epochs are overplotted with the reference SDSS spectrum (MJD 51924) in Fig. (3). The BAL trough has multiple narrow components covering a large wavelength range. We identify four distinct components at = 1.895, 1.911, 1.927 and 1.941 with the strongest component being at = 1.927. The spectrum has well defined absorption structures of Si iv, C iv, Al ii, Al iii, Mg ii, Fe ii and its excited states.
Individual components of C iv and Mg ii lines are saturated (see Figure 3 of Dunn et al., 2010). As the line widths are close to our spectral resolution, we smoothed the SDSS spectrum to IFOSC resolution for comparison. Some of the variations seen in the case of Fe ii2600 and Fe ii2383 are mainly due to atmospheric absorption that were not corrected in the IFOSC spectra. These regions of strong telluric absorption are marked in the spectra by crossed circles.
The prominent absorption components are labeled in Fig. 3 and the extent of the absorption are shown with horizontal lines. We notice continuum shape differences between IGO and SDSS spectra. To take care of this we fit a smooth lower order polynomial to the difference spectrum avoiding the absorption line regions and regions affected by telluric lines. It is clear from the bottom part of each panel that there is no significant deviation spread over the wavelength range covered by absorption in any of the cases. Strong deviations are seen only in regions where there is telluric contaminations in our IFOSC spectrum.
Hence, we conclude that SDSS J0318-0600 shows no significant variability over a time scale of 3 years in the quasar rest frame. The light curve presented in Fig. 1 suggests a smooth dimming of the QSO (by 0.1 mag). Our IGO spectra have slightly low continuum flux compared to SDSS spectrum in the wavelength range 60007000 Å. This could be related either to the uncertainty related to extinction corrections or spectral variability of the QSO. However, this does not affect our conclusion regarding the absence of variability in the absorption lines.
3.3 SDSS J0835+4242
| Equivalent widths | ||||
|---|---|---|---|---|
| Spectrum | (Å) | |||
| Mg II | Mg I | Fe II | Fe II | |
| 2586Å | 2382Å | |||
| SDSS | 4.10.2 | 0.70.2 | 5.20.3 | 10.70.3 |
| IGO-2007 | 4.50.3 | 0.60.2 | 5.50.7 | 11.51.0 |
| IGO-2008 | 4.50.3 | 0.60.2 | 6.20.9 | 11.41.4 |
| IGO-2010 | 5.60.2 | 0.50.2 | 4.50.2 | 11.20.9 |
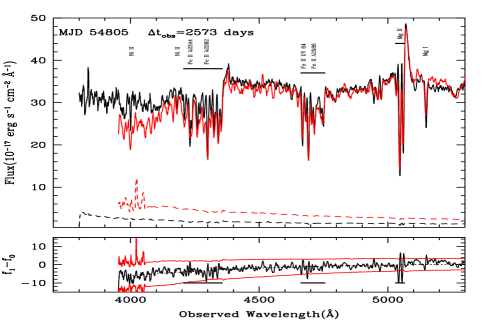
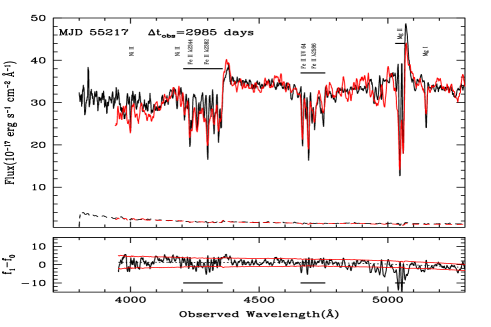
The redshift of this BAL QSO is = 0.810. Fig. 4 shows the comparison between the reference SDSS and IGO data for SDSS J0835+4242. IGO data acquired in the year 2010 (MJD 55217) has slightly lower resolution compared to the data taken in 2008 (MJD 54448). The differences between IGO and SDSS spectra seen in the top panel of Fig. 4 are mostly a consequence of this. The spectrum contains strong absorption lines from Mg ii, Mg i, Mn ii, Ni ii and Fe ii multiplet lines like Fe ii, Fe ii, Fe ii and excited UV 64. Mn ii is blended with the Fe ii. The quasar has strong absorption troughs that reach peak depth at = 0.805. Like the previous system the absorption trough is resolved into multiple narrow components. Additional Mg ii absorption systems are also seen at = 0.800 and = 0.769. The associated ground state Fe ii lines for these two systems are not detected clearly in our spectrum. As absorption lines are narrow, the continuum can be well defined. So, we measured the total equivalent widths of Mg ii, Mg i and the blends near Fe ii2586 and Fe ii2382. The results are summarized in Table 2. The quoted error in the equivalent widths also includes uncertainties associated with the continuum placement calculated using repeated continuum fits. This table also confirms the lack of significant (ie. 5 level) absorption line variability.
We conclude that absorption in SDSS J0835+4242 has not varied significantly over the time period of 4.97 years in the quasar rest frame. The light curve presented in Fig. 1 also suggests that on an average the QSO has not varied in its brightness by more than 0.1 mag.
3.4 SDSS J0840+3633
SDSS J0840+3633 is one among the first known radio loud BAL QSOs (Becker et al., 1997). In the discovery paper, Becker et al. (1997) pointed out the correlation between the column densities of low ionization clouds and radio emissions for 3 LoBALs and went on to suggest that LoBALs may be transition objects between radio loud and radio quiet BAL QSOs. Brotherton et al. (1997) performed the spectropolarimetry of this source and found it to be a highly polarized BALQSO where the continuum polarization rises steeply toward shorter wavelengths while keeping a constant position angle in the continuum. They consider scattering as the likely polarization mechanism, with the effects of some combination of dust and dilution leading to the wavelength dependences seen. Their studies showed that SDSS J0840+3633 has unpolarized emission lines and increased polarizations in its BAL troughs but complex polarization behavior across its narrow metastable troughs. de Kool et al. (2002) studied the KECK/HIRES spectrum of this quasar. Their spectrum reveals outflowing gas with two main components. The physical conditions in the two components are found to be significantly different. This is attributed to the difference of a factor of 100 in the distance from the central source. The low velocity gas has absorption from excited states which indicate low density. Assuming UV fluorescence as the possible excitation mechanism, they estimate the distance between the low velocity absorber and the active nucleus to be 230 pc. The high velocity high density gas gives rise to strong Fe iii and Al iii lines. The estimated distance between this gas and the nucleus is 1 pc.
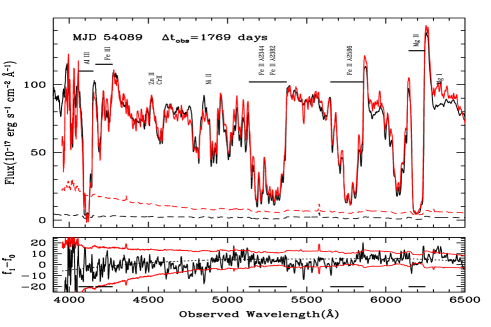
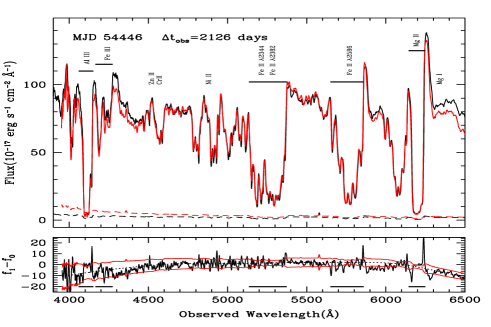
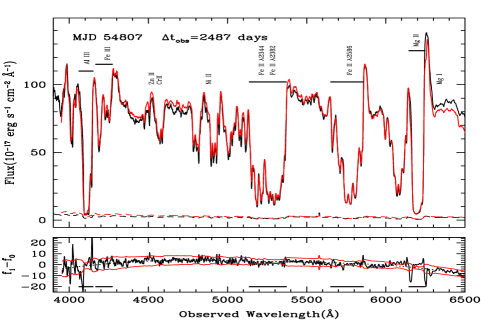
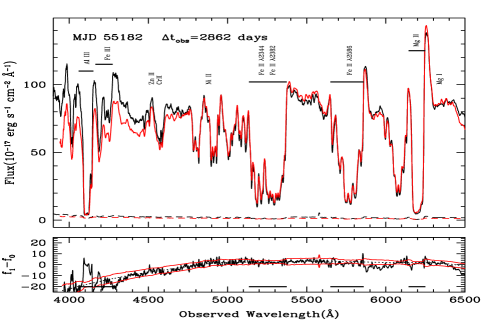
Each panel of Fig. 5 shows the IGO spectrum obtained at different epochs overplotted with the reference SDSS spectrum. The spectrum is completely dominated by absorption lines from Mg ii, Ni ii, Cr ii, Al iii, Si ii, Al ii and excited states of Fe ii and Fe iii. The unabsorbed Mg ii emission gives the emission redshift to be 1.230. The BAL troughs are nearly saturated and the continuum is heavily absorbed. The low velocity Mg ii absorption component has a redshift of = 1.225 and the troughs extends to a velocity of about 4000 km s-1. Excited states of Fe ii comprises of UV63 lines and that of Fe iii comprises of UV34 lines.
From the difference spectrum plotted in the lower half of each panel, we see no consistent variations in Mg ii, Fe ii, or Fe iii absorption lines. However, the difference spectra have a smooth curvature suggesting a possible differences in the continuum. So, we conclude that the BALs in SDSS J0840+3633 has not varied by an appreciable amount over a rest frame time period of 4 years. From the light curve presented in Fig. 1, we notice a gradual increase in the V-magnitude of the QSO. But the changes are within 0.05 mag. This, together with the strong saturation of the BAL troughs, could be the reason for the lack of line variability.
 |
 |
3.5 SDSS J2215-0045
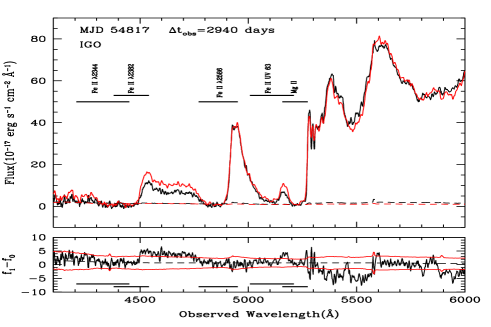
This is one of the peculiar QSOs identified by Hall et al. (2002) with strong Fe iii UV482080, UV341910 and Al iii absorption lines in addition to the strong C iv broad absorption line at 1.36. Fe ii lines are absent and the QSO continuum seems to be dominated by the broad emission from Fe ii and Fe iii. This is supported by the fact that the QSO continuum does not have strong intrinsic polarization (DiPompeo et al., 2011). The associated Mg ii absorption coincides with the 2670 Å break of the Fe emission template thus its strength can not be accurately measured. The three unusual aspects of this QSO are (i) the lack of Fe ii absorption while absorption from Fe iii fine-structure levels are clearly detected (ii) the Fe iii UV48 (EP=5.08 eV) absorption line being stronger than the Fe iii UV34 (EP=3.73 eV) which is unphysical under LTE assumption and (iii) the emission lines are weak and the redshift of the QSO is determined by a weak and narrow Mg ii line at = 1.478.
In addition to the broad absorption lines discussed above, a narrow associated absorption line system is detected at redshift = 1.4752 based on the presence of Mg ii2796,2803, Fe ii2600,2586,2382, Si ii1526, C ii1334 in the VLT/UVES data. Fe ii2344 line falls in the red edge of the Na D1 and D2 lines from our galaxy. No absorptions from excited levels like C ii∗ 1335 or Si ii∗ 1533 are detected in the spectrum. The VLT/UVES spectrum reveals a second C iv narrow absorption system at a redshift = 1.07464. The associated Si iv is beyond the UVES coverage and other associated absorption lines are not detected for this second system. We are unable to confirm these narrow lines in our other datasets due to poor spectral resolution. Hence, we are limited to carry out the time variability studies for the broad absorption lines only.
Based on photoionization models de Kool et al. (2002) have shown that Fe iii column density being higher than that of Fe ii can be easily produced in a high density outflow (log (cm-3) 10.5 for ionization parameter log U) with (H) in a narrow range such that the outflow is constituted only by a Fe iii+Al iii zone without having the low ionization zone that usually contains Fe ii. Rogerson et al. (2011) have not detected X-ray emission from this source in their Chandra observations. They found the logarithm of the ratio between the 2 keV (l ) and 2500Å(l2500Å) rest frame specific luminosities, and an absorption column of (H) 3.4 cm-2. They argued that the optical absorption originates from different gas than the one that produces X-ray absorption. Lyman- photons can pump Fe iii1914 (Johansson et al., 2000). This process may explain the weakness of UV34 absorption. On the contrary due to strong Fe ii emission at 1800 Å and the lack of emission at 2000 Å the observed spectrum may be consistent with both Fe iii UV 48 and UV 34 being saturated with a covering factor of 0.35 (see Hall & Hutsemèkers, 2003). From Fig. 1 we see that this is the source with appreciable flux variability in our sample.
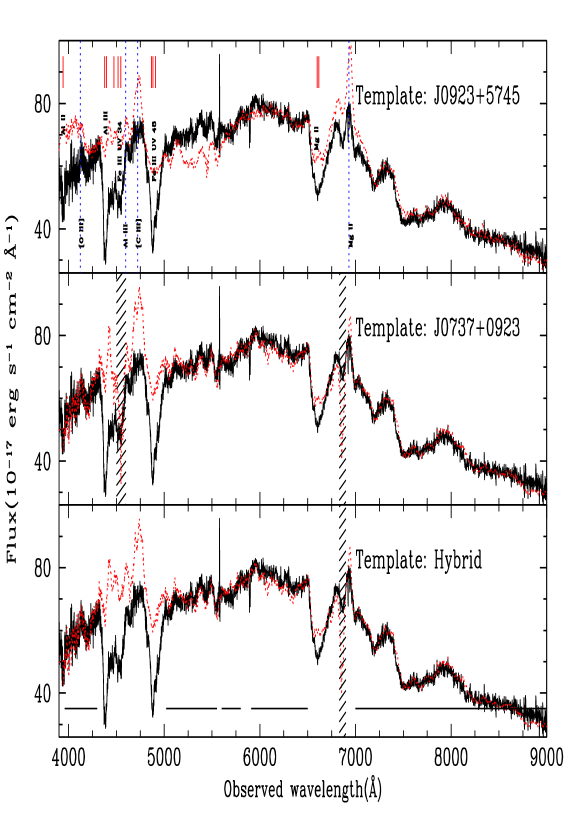
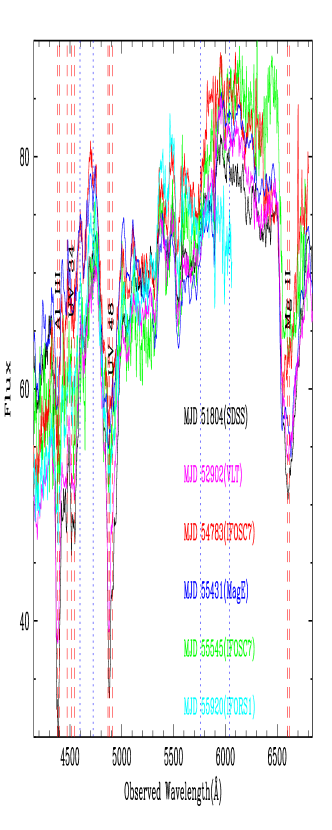
While the QSO looks normal in the observed wavelength range 6000Å there are clear reddening signatures in the blue. As pointed out by Hall et al. (2003) continuum of this QSO in the wavelength range between 50009000Å is dominated by Fe ii and Fe iii emission. Fig. 6 shows the spectral energy distribution fitting of SDSS J2215-0045 observed on MJD 51804. We fit the observed spectrum () with the template spectrum () using the following parametrization,
| (1) |
We use the - minimization to get the best values for parameters a, b, and . The second term in the above equation is to take care of the spectral index differences between the observed and the template QSO spectra. The dust optical depth ‘’ is obtained for the SMC like extinction curve. The fitting method is similar to the one described in Srianand et al. (2008). The wavelength ranges used for the fitting are shown as horizontal segments in the top panel. The spectrum has absorption from resonance lines like Mg ii, Al ii, Al iii and fine structure lines Fe iii UV 34 and Fe iii UV 48. C iv and Si iv BAL are seen in the VLT/UVES spectrum which has a good coverage in the blue. The position of absorption lines are indicated by vertical marks in Fig. 6 The emission spectrum is illustrated by a dotted line. The top and middle panels show the best fitted continuum using the spectra of significant iron emitters J0923+5745 and J0737+0923 as templates respectively. The SED is well fitted when we use the spectrum of J0737+0923 as the template. The shaded regions in the middle and bottom panels show the wavelength range affected by absorption in the spectrum of J0737+0923. We use the spectrum of J0923+5745 to reconstruct the SED in these narrow wavelength range. Fit to the spectrum of SDSS J2215-0045 using this hybrid template is shown in the bottom panel. The SED fitting results in a E(B-V) value of -0.083 for the SDSS spectrum. The plot shows that the actual continuum follows the hybrid template reasonably well.
A weak Al ii absorption is detected at the redshift of the Al iii and Fe iii lines. Al iii absorption seems very strong. As pointed out by Hall et al. (2002) the Fe iii UV34 blend seems to be weaker than UV48, if we use a smooth continuum to SDSS J2215-0045. However, it is clear from Fig. 6 that apparent weakness of UV34 may be related to the shape of the QSO spectral energy distribution that shows a strong dip at the location of Fe iii UV48 absorption. The hybrid template used above suggests a stronger [C iii] emission line compared to what is observed for SDSS J2215-0045. Removal of this contribution may further reduce the continuum level compared to what is observed for SDSS J2215-0045. Therefore apparent inconsistencies could be the artifact of the unknown continuum shape and need not be related to the population inversion by some non-equilibrium process. Fig. 7 shows the spectra obtained at different epochs overplotted with the fit obtained for the SDSS data using the hybrid template.
 |
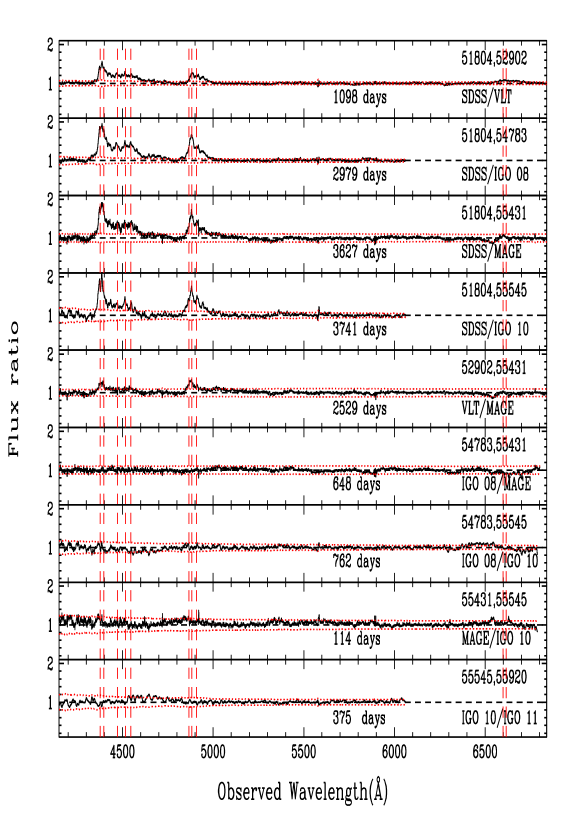 |
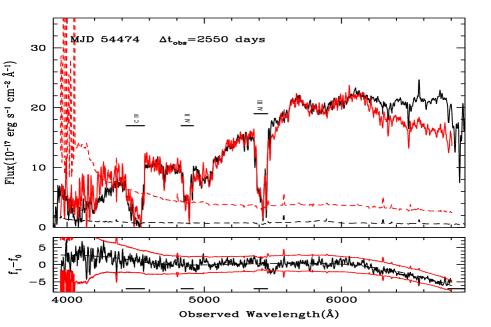
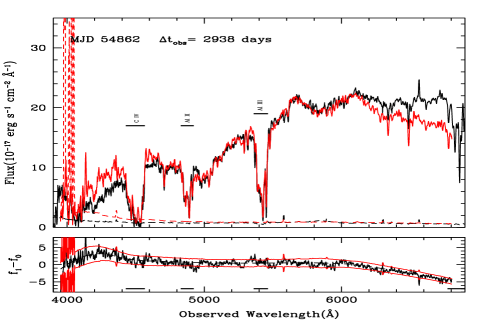
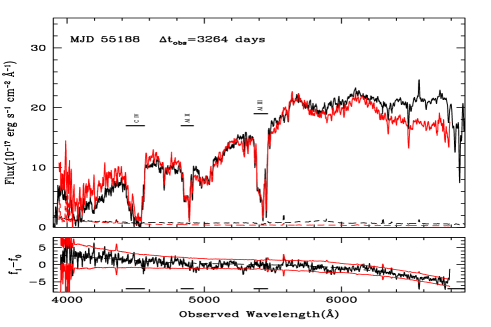
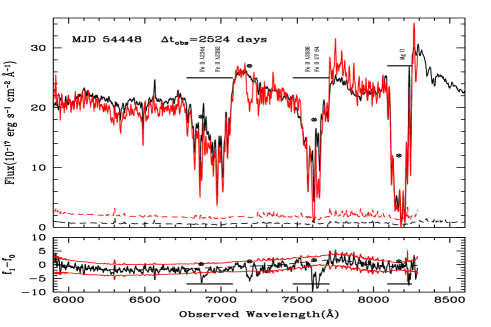
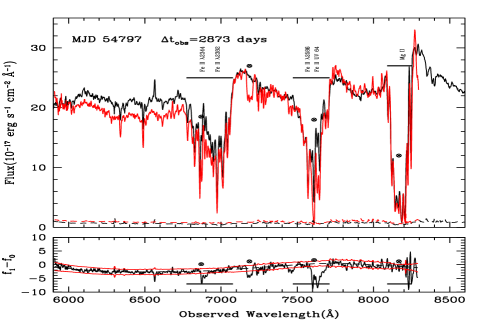
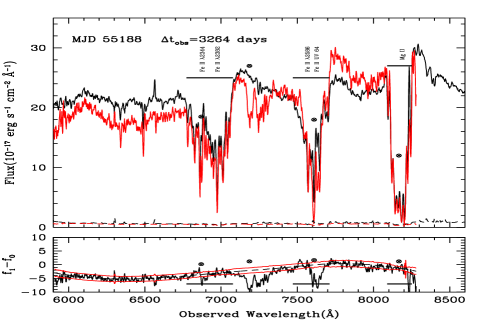
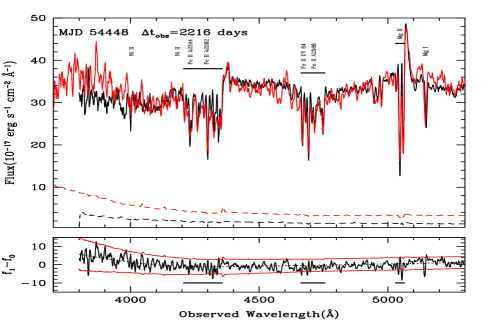
Fig. 8 shows the variability in the absorption lines of SDSS J2215-0045 between the different epoch data. In the top panels, we have overplotted the SDSS, VLT, IGO and MagE data. The plot clearly shows the variations in flux in the region of Al iii, Fe iii UV 34, Fe iii UV 48 and Mg ii absorption lines. In order to quantify the optical depth variability in Fig. 8 we plot ratio of spectra between different epochs together with the associated errors. It can be seen that there is significant variability in Mg ii, Al iii, Fe iii UV 34 and Fe iii UV 48 absorption lines. The absorption lines have maximum strength in the SDSS spectra. All the later epochs show decrease in the optical depth with respect to the SDSS data. The lines decreased in optical depth more significantly in the 2008 IGO spectra. However, observations made after 2008 show that both MagE data and IGO data are consistent with no variations in the absorption line optical depths. Al ii absorption is not covered by our IGO spectra. It is clear from Fig. 7 that at the locations Al iii, Mg ii and Fe iii UV absorption lines, the observed spectra after the year 2008 just follow the template. This means that the data is consistent with the disappearance of absorption seen in the SDSS spectrum. We also notice that the weak Al ii absorption seen in SDSS spectrum has also disappeared in our MagE spectrum. In Table 3 we give the average ratio measured between different epoch spectra at the wavelength range covered by Fe iii UV 34 and 48 lines. If there are no optical depth variation, the average ratio is 1. This table confirms the visual trend seen in Fig. 8.
| Average ratio | ||||
|---|---|---|---|---|
| Epoch1 | Epoch2 | t1 | Fe iii2 | Fe iii3 |
| UV34 | UV48 | |||
| (days) | (Å) | (Å) | ||
| SDSS | VLT-FORS1 | 1098 | 1.140.04 | 1.090.06 |
| SDSS | IGO-2008 | 2979 | 1.270.04 | 1.200.06 |
| SDSS | MAGE | 3627 | 1.230.04 | 1.200.06 |
| SDSS | IGO-2010 | 3741 | 1.170.04 | 1.230.06 |
| VLT-FORS1 | MAGE | 2529 | 1.040.06 | 1.100.09 |
| IGO-2008 | MAGE | 648 | 0.990.04 | 0.990.06 |
| IGO-2008 | IGO-2010 | 762 | 0.940.04 | 1.000.06 |
| MAGE | IGO-2010 | 114 | 1.030.02 | 1.070.03 |
| IGO-2010 | IGO-2011 | 375 | 1.050.04 | 1.000.06 |
1 Elapsed time in observers frame; 2 Over the observed wavelength range 43164762Å; 3 Over the observed wavelength range 48095024Å.
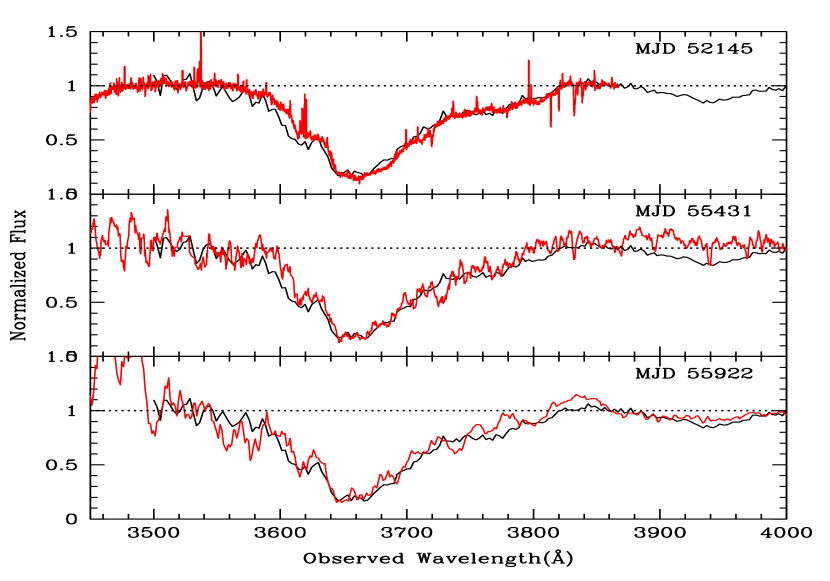
A strong C iv absorption is detected in the spectra covering 4000 Å. Fig. 9 shows the normalized spectrum in the vicinity of C iv absorption line which is covered in the VLT/FORS1, VLT/UVES, MagE and the IGO/FORS1 data. As C iv falls in a region which is free of Fe emission, we fitted a low-order polynomial connecting the absorption free regions close to the C iv line for continuum normalization. We notice the C iv absorption is much broader than that of Al iii (or Al ii). This suggests that the two species may originate from two different regions (i.e., two distinct components of a co-spatial multiphase structure or from gas at distinctly different locations). The Si iv line falls at the edge of the MagE spectrum and is not covered by VLT/FORS1. From the figure, it can be seen that C iv has not changed significantly as the low ionization lines. It is also interesting to note the C iv line does not go to zero. This could either mean C iv is optically thin or the absorbing gas doesn’t cover the background source.
In the following section we discuss the implications of the observed variability in this source.
4 Discussion on variability in SDSS J2215-0045
Variability in broad absorption lines has several origins. The simplest explanations are (1) change in the ionizing condition, (2) proper motion of absorbing clouds (Ma, 2002; Hamann et al., 2008; Leighly et al., 2009; Krongold et al., 2010; Rodríguez Hidalgo et al., 2011; Vivek et al., 2012) and (3) covering factor variability of the absorbing gas (see for example, Srianand & Shankaranarayanan, 1999).
In the case of SDSS J22150045 the variability in the Al iii and Fe iii fine-structure lines are unambiguously established. As we do not have direct access to the column density of the Fe iii ground state absorption, it will be difficult to draw any conclusion on the variations of the relative population of the excited level with respect to the ground level. However, we know in the case of photoionization models Fe iii will closely trace Al iii. Also the weakness of Al ii and the lack of Fe ii absorption is consistent with the range in the ionization parameter being very narrow (see discussion on this by de Kool et al., 2002). Thus any small change in the ionizing radiation will change both Al iii and Fe iii column densities rapidly. Simple ionization change (even without changing the excitation temperature) will change the column density of Fe iii fine-structure levels. As discussed in Section 2, the light curve of SDSS J2215-0045 is consistent with the V-band photometric variability of 0.2 mag. The actual variability in the UV range that controls the ionization state of the gas can be higher. From the Figs. 6 & 7 of de Kool et al. (2002), it is apparent that the ion fraction of Fe iii (and Al iii) can be significantly reduced even for a small change in the ionization parameter. Compared to the SDSS epoch, our IGO data was taken when the QSO was 0.5 mag brighter. Therefore, the observed variability of Fe iii and Al iii lines is consistent with photoionization induced variability.
The smallest timescale over which we have seen the variation is between the SDSS in 2000 and VLT in 2003. This time period corresponds to a timescale of 1.211 years in the quasar rest frame. The variability time scale can be used to constrain the electron density of the absorbing gas. For a moderately ionized gas , the recombination time scale can be approximated to (see Srianand & Petitjean, 2001)
| (2) |
The variability time scale gives the recombination time scale, if the variations are assumed to be caused due to changes in optical depth. Using the recombination cross-section for Al iii given by the CHIANTI atomic database (Dere et al., 1997, 2009) the lower limit on the electron density, , is given by
| (3) |
where, is the elapsed time in years. The recombination coefficients are calculated for a temperature of 10,000 K. Putting in the above equation results in an electron density, cm-3. This is coincident with but not as high as what has been suggested by the models of de Kool et al. (2002). However, the lack of variability in C iv under this scenario could mean that the absorbing gas has multiphase structure with C iv and Fe iii absorption originating from different phases.
Models of FeLoBALs by Faucher-Giguère et al. (2012) suggest the in situ formation of Fe BALs in the ISM of host galaxies by shocks induced by the QSO blast wave. Going along this line, Rogerson et al. (2011) put forward a model where an accelerating, relatively low density wind collides with dense Fe iii clumps and produces the observed absorption lines. Since Fe iii clumps are ablated in this process, the Fe iii troughs will decrease with time unless the wind encounters new clumps. The variability seen in the present system is consistent with this scenario. In this case, Fe iii absorption is produced from a distinct region (probably the ISM of the host galaxy) compared to that of C iv. However, as this time-scale should be shorter than sound crossing time for a T 104 K gas we can write the cloud thickness as,
| (4) |
This is much smaller than the size of the UV continuum emitting region. This thickness is much less than what one gets from photoionization models.
Recently several cases of emergence and subsequent disappearance of new components have been reported in the literature (Ma, 2002; Hamann et al., 2008; Krongold et al., 2010; Leighly et al., 2009; Rodríguez Hidalgo et al., 2011; Vivek et al., 2012). In all these cases, the absorbing gas transiting perpendicular to our line of sight is considered as a viable explanation. Such an explanation can hold for the present case also.
To investigate this scenario, we derive some basic parameters for SDSS J2215-0045. The SDSS u and g magnitudes are converted in to B magnitude following the transformation equation of Jester et al. (2005) obtained for QSOs. We get the bolometric luminosity for this source from the B magnitude as 2.71047 erg s-1 using the prescription of Marconi et al. (2004). The bolometric luminosity corresponds to a black hole mass of 2.210. The diameter of the disc within which 90% of the 2700 Å continuum is emitted is obtained as 1.49 1016 cm ( 46 times the Schwarzschild radius) as expected in a Shakura & Sunyaev thin accretion disk model (Hall et al., 2011). Variability in SDSS J2215-0045 has occurred between the SDSS and IGO observations. If we take the number of days elapsed between the SDSS and IGO observations (3740 days in observer’s frame or 1509 days in quasar frame) as an upper limit on the transit time of the gas, the transverse velocity of the gas can be estimated as 1140 km s-1 if we assume the projected size of the gas to be much smaller than the emitting region and a face on disk. Based on the redshift of the Al iii absorption we infer the line of sight velocity to be of the order of 15,000 km s-1. Therefore, like in the case of J1333+0012 (Vivek et al., 2012) the outflow should be very close to the line of sight such that the transverse velocity is much smaller than the line of sight velocity.
5 Results & Discussion
We present the results of spectroscopic monitoring of 5 FeLoBALs for a period of 10 years. We also present the photometric light curves of all these sources obtained from Catalina Real-Time Transient Survey.
In one of these QSOs, SDSS J22150045, we detected the absorption line variability of Al iii and Fe iii fine-structure lines. However, there is no clear variation in the absorption profile of C iv absorption. Our results are consistent with low-ions and C iv originating from different components along the line of sight. The absorption line variability could be related to changes in the ionization state of the gas and/or to changes in the covering factor due to transverse motion of the gas. The light curve of SDSS J22150045 suggests brightening of this QSO when the absorption line became weak. This together with the expected narrow range in the allowed parameters of the photoionization models (de Kool et al., 2002; Rogerson et al., 2011) means the observed variability can very well be explained by changes in the photoionization rates. The data is also consistent with the models of Rogerson et al. (2011) in which a shock heated cloud that produces Fe iii absorption being ablated producing strong variations in the absorption strength. Regular photometric and spectroscopic monitoring of this source is needed to distinguish between these alternatives.
In the remaining cases no significant variation in the absorption line is detected. As these sources do not show any strong flux variability photoionization induced absorption line variability is not expected in these sources. However, if the low ion absorption in these systems are due to ISM (or high density clump far away from the central QSO) being shock heated by QSO feedback then we do not find any evidence of this gas being ablated with time. Also, we can conclude that either the projected extent of the gas is larger than the continuum emitting region or the transverse velocity is small.
If FeLoBALs are different set of population (where the absorption occurs far away from the the central engine), then comparing the occurrence of variability in these objects with those of HiBALs and LoBALs without fine-structure lines will throw light on the nature of BAL phenomenon in QSOs.
6 acknowledgements
We wish to acknowledge the IUCAA/IGO staff for their support during our observations and Maria-Jose Maureira for help with MagE observations. We also thank Dr. DiPompeo for sharing their VLT/FORS data with us and the anonymous referee for useful suggestions. MV gratefully acknowledges University Grants Commission, India, for financial support through RFSMS Scheme and IUCAA for hospitality, where most of this work was done. RS and PPJ gratefully acknowledge support from the Indo-French Centre for the Promotion of Advanced Research (Centre Franco-Indien pour la promotion de la recherche avancée) under Project N.4304-2.
References
- Allen et al. (2011) Allen J. T., Hewett P. C., Maddox N., Richards G. T., Belokurov V., 2011, MNRAS, 410, 860
- Barlow et al. (1989) Barlow T. A., Junkkarinen V. T., Burbidge E. M., 1989, ApJ, 347, 674
- Barlow et al. (1992) Barlow T. A., Junkkarinen V. T., Burbidge E. M., Weymann R. J., Morris S. L., Korista K. T., 1992, ApJ, 397, 81
- Bautista et al. (2010) Bautista M. A., Dunn J. P., Arav N., Korista K. T., Moe M., Benn C., 2010, ApJ, 713, 25
- Becker et al. (1997) Becker R. H., Gregg M. D., Hook I. M., McMahon R. G., White R. L., Helfand D. J., 1997, ApJ, 479, L93+
- Bochanski et al. (2009) Bochanski J. J., Hennawi J. F., Simcoe R. A., Prochaska J. X., West A. A., Burgasser A. J., Burles S. M., Bernstein R. A., Williams C. L., Murphy M. T., 2009, PASP, 121, 1409
- Brotherton et al. (1997) Brotherton M. S., Tran H. D., van Breugel W., Dey A., Antonucci R., 1997, ApJ, 487, L113+
- Capellupo et al. (2011) Capellupo D. M., Hamann F., Shields J. C., Rodríguez Hidalgo P., Barlow T. A., 2011, MNRAS, 413, 908
- Dai et al. (2008) Dai X., Shankar F., Sivakoff G. R., 2008, ApJ, 672, 108
- de Kool et al. (2002) de Kool M., Becker R. H., Arav N., Gregg M. D., White R. L., 2002, ApJ, 570, 514
- Dere et al. (1997) Dere K. P., Landi E., Mason H. E., Monsignori Fossi B. C., Young P. R., 1997, A&AS, 125, 149
- Dere et al. (2009) Dere K. P., Landi E., Young P. R., Del Zanna G., Landini M., Mason H. E., 2009, A&A, 498, 915
- DiPompeo et al. (2011) DiPompeo M. A., Brotherton M. S., De Breuck C., 2011, ApJS, 193, 9
- Drake et al. (2009) Drake A. J., Djorgovski S. G., Mahabal A., Beshore E., Larson S., Graham M. J., Williams R., Christensen E., Catelan M., Boattini A., Gibbs A., Hill R., Kowalski R., 2009, ApJ, 696, 870
- Dunn et al. (2010) Dunn J. P., Bautista M., Arav N., Moe M., Korista K., Costantini E., Benn C., Ellison S., Edmonds D., 2010, ApJ, 709, 611
- Farrah et al. (2007) Farrah D., Lacy M., Priddey R., Borys C., Afonso J., 2007, ApJ, 662, L59
- Faucher-Giguère et al. (2012) Faucher-Giguère C.-A., Quataert E., Murray N., 2012, MNRAS, 420, 1347
- Foltz et al. (1987) Foltz C. B., Weymann R. J., Morris S. L., Turnshek D. A., 1987, ApJ, 317, 450
- Gibson et al. (2010) Gibson R. R., Brandt W. N., Gallagher S. C., Hewett P. C., Schneider D. P., 2010, ApJ, 713, 220
- Gibson et al. (2008) Gibson R. R., Brandt W. N., Schneider D. P., Gallagher S. C., 2008, ApJ, 675, 985
- Green et al. (2001) Green P. J., Aldcroft T. L., Mathur S., Wilkes B. J., Elvis M., 2001, ApJ, 558, 109
- Hall et al. (2002) Hall P. B., Anderson S. F., Strauss M. A., York D. G., Richards G. T., Fan X., Knapp G. R., Schneider D. P., Vanden Berk R. L., Zheng W., 2002, ApJS, 141, 267
- Hall et al. (2011) Hall P. B., Anosov K., White R. L., Brandt W. N., Gregg M. D., Gibson R. R., Becker R. H., Schneider D. P., 2011, MNRAS, 411, 2653
- Hall & Hutsemèkers (2003) Hall P. B., Hutsemèkers D., 2003, in S. Collin, F. Combes, & I. Shlosman ed., Active Galactic Nuclei: From Central Engine to Host Galaxy Vol. 290 of Astronomical Society of the Pacific Conference Series, VLT Observations of two Unusual BAL Quasars. pp 209–+
- Hall et al. (2003) Hall P. B., Hutsemékers D., Anderson S. F., Brinkmann J., Fan X., Schneider D. P., York D. G., 2003, ApJ, 593, 189
- Hamann et al. (2008) Hamann F., Kaplan K. F., Rodríguez Hidalgo P., Prochaska J. X., Herbert-Fort S., 2008, MNRAS, 391, L39
- Hewett & Foltz (2003) Hewett P. C., Foltz C. B., 2003, AJ, 125, 1784
- Jester et al. (2005) Jester S., Schneider D. P., Richards G. T., Green R. F., Schmidt M., Hall P. B., Strauss M. A., Vanden Berk D. E., Stoughton C., Gunn J. E., Brinkmann J., Kent S. M., Smith J. A., Tucker D. L., Yanny B., 2005, AJ, 130, 873
- Johansson et al. (2000) Johansson S., Zethson T., Hartman H., Ekberg J. O., Ishibashi K., Davidson K., Gull T., 2000, A&A, 361, 977
- Korista et al. (2008) Korista K. T., Bautista M. A., Arav N., Moe M., Costantini E., Benn C., 2008, ApJ, 688, 108
- Krongold et al. (2010) Krongold Y., Binette L., Hernández-Ibarra F., 2010, ApJ, 724, L203
- Leighly et al. (2009) Leighly K. M., Hamann F., Casebeer D. A., Grupe D., 2009, ApJ, 701, 176
- Lundgren et al. (2007) Lundgren B. F., Wilhite B. C., Brunner R. J., Hall P. B., Schneider D. P., York D. G., Vanden Berk D. E., Brinkmann J., 2007, ApJ, 656, 73
- Ma (2002) Ma F., 2002, MNRAS, 335, L99
- Marconi et al. (2004) Marconi A., Risaliti G., Gilli R., Hunt L. K., Maiolino R., Salvati M., 2004, MNRAS, 351, 169
- Moe et al. (2009) Moe M., Arav N., Bautista M. A., Korista K. T., 2009, ApJ, 706, 525
- Murray & Chiang (1995) Murray N., Chiang J., 1995, ApJ, 454, L105+
- Reichard et al. (2003) Reichard T. A., Richards G. T., Schneider D. P., Hall P. B., Tolea A., Krolik J. H., Tsvetanov Z., Vanden Berk D. E., York D. G., Knapp G. R., Gunn J. E., Brinkmann J., 2003, AJ, 125, 1711
- Rodríguez Hidalgo et al. (2011) Rodríguez Hidalgo P., Hamann F., Hall P., 2011, MNRAS, 411, 247
- Rogerson et al. (2011) Rogerson J. A., Hall P. B., Snedden S. A., Brotherton M. S., Anderson S. F., 2011, New A, 16, 128
- Smith & Penston (1988) Smith L. J., Penston M. V., 1988, MNRAS, 235, 551
- Srianand et al. (2008) Srianand R., Gupta N., Petitjean P., Noterdaeme P., Saikia D. J., 2008, MNRAS, 391, L69
- Srianand & Petitjean (2001) Srianand R., Petitjean P., 2001, A&A, 373, 816
- Srianand & Shankaranarayanan (1999) Srianand R., Shankaranarayanan S., 1999, ApJ, 518, 672
- Stalin et al. (2011) Stalin C. S., Srianand R., Petitjean P., 2011, MNRAS, 413, 1013
- Trump et al. (2006) Trump J. R., Hall P. B., Reichard T. A., Richards G. T., Schneider D. P., Vanden Berk D. E., Knapp G. R., Anderson S. F., Fan X., Brinkman J., Kleinman S. J., Nitta A., 2006, ApJS, 165, 1
- Turnshek et al. (1988) Turnshek D. A., Grillmair C. J., Foltz C. B., Weymann R. J., 1988, ApJ, 325, 651
- Vivek et al. (2012) Vivek M., Srianand R., Mahabal A., Kuriakose V. C., 2012, MNRAS, 421, L107
- Voit et al. (1993) Voit G. M., Weymann R. J., Korista K. T., 1993, ApJ, 413, 95
- Wampler et al. (1995) Wampler E. J., Chugai N. N., Petitjean P., 1995, ApJ, 443, 586