Discovery of Bright Galactic R Coronae Borealis and DY Persei Variables: Rare Gems Mined from ACVS
Abstract
We present the results of a machine-learning (ML) based search for new R Coronae Borealis (RCB) stars and DY Persei-like stars (DYPers) in the Galaxy using cataloged light curves from the All-Sky Automated Survey (ASAS) Catalog of Variable Stars (ACVS). RCB stars—a rare class of hydrogen-deficient carbon-rich supergiants—are of great interest owing to the insights they can provide on the late stages of stellar evolution. DYPers are possibly the low-temperature, low-luminosity analogs to the RCB phenomenon, though additional examples are needed to fully establish this connection. While RCB stars and DYPers are traditionally identified by epochs of extreme dimming that occur without regularity, the ML search framework more fully captures the richness and diversity of their photometric behavior. We demonstrate that our ML method can use newly discovered RCB stars to identify additional candidates within the same data set. Our search yields 15 candidates that we consider likely RCB stars/DYPers: new spectroscopic observations confirm that four of these candidates are RCB stars and four are DYPers. Our discovery of four new DYPers increases the number of known Galactic DYPers from two to six; noteworthy is that one of the new DYPers has a measured parallax and is mag, making it the brightest known DYPer to date. Future observations of these new DYPers should prove instrumental in establishing the RCB connection. We consider these results, derived from a machine-learned probabilistic classification catalog, as an important proof-of-concept for the efficient discovery of rare sources with time-domain surveys.
Subject headings:
circumstellar matter – methods: data analysis – stars: carbon – stars: evolution – stars: variables: other – techniques: photometric1. Introduction
R Coronae Borealis (RCB) stars are hydrogen-deficient carbon (HdC) stars that exhibit spectacular ( up to 8 mag), aperiodic declines in brightness (for a review on RCB stars see Clayton 1996). The fading occurs rapidly (1 to few weeks) as new dust is formed in the circumstellar environment, and the recovery is slow, sometimes taking several years, as the new dust is dispersed and removed from the line of sight. At maximum light RCB stars are bright supergiants, which in combination with the large-amplitude photometric variability should make them easy to discover. Yet, to date there are only 56 known RCB stars in the Galaxy (Clayton, 1996; Clayton et al., 2002; Zaniewski et al., 2005; Tisserand et al., 2008; Clayton et al., 2009; Kijbunchoo et al., 2011). The rarity of these stars suggests that they reflect a very brief phase of stellar evolution, or a bias in RCB star search methods, or both.
The lack of hydrogen and overabundance of carbon in RCB atmospheres implies that RCB stars are in a late stage of stellar evolution, but no consensus has yet emerged regarding their true physical nature. There are two leading theories for explaining the observed properties of RCB stars: the Double Degenerate (DD) scenario and the final Helium shell flash (FF) scenario (see e.g., Iben et al. 1996). The DD scenario posits that RCB stars are the stellar remnant of a carbon–oxygen white dwarf (WD) and helium WD merger. In the FF scenario, a thin layer of He in the interior of the star begins runaway burning, which leads to the rapid expansion of the photosphere shortly before the star becomes a planetary nebula. There are observational properties of RCB stars that both theories have difficulty explaining (Clayton, 1996), and conflicting observational evidence supporting aspects of both (e.g., Clayton et al. 2007; Pandey et al. 2008; Clayton et al. 2006, 2011). If, as some of the recent observations suggest, the DD scenario proves correct, then a complete census of Galactic RCB stars should be able to calibrate population synthesis models of WD binary systems (e.g., Nelemans et al. 2001), which may improve our understanding of these systems as the progenitors of Type Ia supernovae. In any event, the enigmatic nature of these rare objects, and the opportunity to elucidate the astrophysics of an important late stage of stellar evolution, motivates us to search for additional benchmark exemplars of the class.
Based on the detection of RCB stars in the Large Magellanic Cloud (LMC), it is argued in Alcock et al. (2001) that there should be 3200 RCB stars in the Galaxy. With the actual number of known RCB stars in the Milky Way roughly two orders of magnitude below this estimate, this suggests that either thousands of RCB stars remain undetected or the differing star formation environments/histories in the LMC and the Milky Way result in highly different RCB populations. An observational bias that preferentially selects warm RCB stars likely contributes to the discrepancy between the predicted and known number of these stars in the Galaxy (Lawson et al., 1990). Indeed, recent discoveries of RCB stars in the Galactic bulge and Magellanic Clouds (MCs) have uncovered more cool, 5000 K, rather than warm, 7000 K, RCB stars (Alcock et al., 2001; Zaniewski et al., 2005; Tisserand et al., 2008, 2009). The observed correlation between color and , with bluer RCB stars in the MCs being more luminous (Alcock et al., 2001; Tisserand et al., 2009), clearly shows that any magnitude-limited survey will have an observational bias towards discovering the intrinsically rarer warm RCB stars.
There may also be a large population of RCB stars that have colder photospheres than the cool RCB stars: there is one known Galactic RCB star, DY Persei (Alksnis, 1994), that has 3500 K (Keenan & Barnbaum, 1997). Recent observations of the MCs have identified several DY Persei-like stars (DYPers) while searching for RCB stars (Alcock et al., 2001; Tisserand et al., 2009; Soszyński et al., 2009), while Tisserand et al. (2008) discovered the second known DYPer in the Milky Way using observations of the Galactic bulge. In addition to cooler photospheres, DYPers have other properties that differ from RCB stars, which has led to some degree of ambiguity regarding the connection between these two classes (see e.g., Alcock et al. 2001; Tisserand et al. 2009; Soszyński et al. 2009).
DYPers and RCB stars both show an overabundance of carbon in their atmospheres and unpredictable, large-amplitude declines in their light curves. Several properties differ between the two, however, for instance, DYPers: (i) have symmetric declines in their light curves, (ii) clearly show 13C in their spectra, (iii) are on average 10 times fainter than RCB stars, and (iv) may have significant H in their atmospheres. A detailed examination of the differences in the mid-infrared excesses of RCB stars and DYPers in the MCs led to the conclusion in Tisserand et al. (2009) that DYPers are most likely normal carbon stars that experience ejection events rather than an extension of the RCB phenomenon to lower temperature stars. Furthermore, using OGLE-III observations, it is shown in Soszyński et al. (2009) that several carbon-rich asymptotic giant branch stars (AGBs), which have been classified as Mira or semi-regular periodic variables on the basis of their light curves, show evidence for DYPer-like declines in their light curves.111We note that the sources included in the study of Soszyński et al. (2009) are photometrically classified as carbon AGB. Thus, the candidates in that study require spectroscopic observations in order to be confirmed as DYPers. This leads to the conclusion in Soszyński et al. that DYPers are heavily enshrouded carbon-rich AGB stars that are an extension of typical variables rather than a separate class of variable stars. Nevertheless, all studies of DYPers to date have cited a need for more observations, in particular high resolution spectra to conduct detailed abundance analyses, to confirm or deny the possibility that DYPers are the low temperature analogs to RCB stars.
Over the past decade the decrease in the cost of large CCDs, coupled with a dramatic increase in computer processing power and storage capabilities, has enabled several wide-field, time-domain surveys. These surveys will continue to produce larger data sets before culminating near the end of the decade with the Large Synoptic Survey Telescope (LSST; Ivezic et al. 2008). This explosion of observations should enable the discovery of the thousands of “missing” Galactic RCB stars, should they in fact exist. These new discoveries do not come without a cost, however, as the data rates of astronomical surveys are now becoming enormous. While it was once feasible for humans to visually examine the light curves of all the newly discovered variable stars, as the total number of photometric variables grows to 106–107 visual inspection by expert astronomers becomes intractable.
Advanced software solutions, such as machine-learning (ML) algorithms, are required to analyze the vast amounts of data produced by current and upcoming time-domain surveys. In an ML approach to classification, data from sources of known science class are employed to train statistical algorithms to automatically learn the distinguishing characteristics of each class. These algorithms generate an optimal predictive model that can determine the class (or posterior class probability) of a new source given its observed data.222For a primer on machine learning, we refer the reader to Hastie et al. (2009). Richards et al. (2011) presented an end-to-end ML framework for multi-class variable star classification, in which they describe algorithms for feature generation from single-band light curves and outline a methodology for non-parametric, multi-class statistical classification.
In this paper we present the results of a search for new RCB stars and DYPers in the Galaxy using version 2.3 of the ML catalog presented in Richards et al. (2012b). In §2 we describe the candidate selection procedure, while §3 describes the new and archival observations of the candidates. Our analysis of the photometric and spectroscopic data is contained in §4. The individual stars are examined in further detail in §5, while we discuss the results in §6. Our conclusions are presented in §7.
2. Candidate Selection
2.1. Advantages of Machine-Learning Classification
Candidate selection of possible RCB stars was performed using version 2.3 of the machine-learned ACVS classification catalog (MACC; Richards et al. 2012b) of variable sources cataloged from All-Sky Automated Survey (ASAS; Pojmański 1997, 2001). Full details of the classification procedure can be found in Richards et al. (2012a) and Richards et al. (2012b). Briefly, we employ a Random Forest (RF) classifier, which has been shown to provide the most robust results for variable star classification (see e.g., Richards et al. 2011; Dubath et al. 2011), to provide probabilistic classifications for all of the 50,124 sources in ASAS Catalog of Variable Stars (ACVS; Pojmański 2000). The classification procedure proceeds as follows: for each source in the ACVS 71 features are computed, 66 from the ASAS light curves (e.g., period, amplitude, skew, etc.; for the full list of features we refer the reader to Richards et al. 2012b and references therein) and 5 color features from optical and near-infrared (NIR) catalogs. A training set, upon which the RF classifications will be based, is constructed using light curves from 28 separate science classes, most of which are defined using well studied stars with high precision light curves from the Hipparcos and OGLE surveys (Debosscher et al. 2007; Richards et al. 2011), as well as some visually classified sources from ACVS for a few of the classes that are not well represented in Hipparcos (Richards et al., 2012a). The same 71 features are calculated for all the sources in the training set, and the RF classifier uses the separation of the 28 science classes in the multi-dimensional feature space to assign probabilistic classifications to each source in the ACVS. In the end, the probability of belonging to each individual science class is provided for each ACVS source and a post-RF procedure is used to calibrate these probabilities (meaning that a source with has a 50% chance of actually being a Mira).
When searching for RCB stars in time-domain survey data, RF classification provides a number of advantages relative to the more commonly used method of placing hard cuts on a limited set of a few features. Many studies have focused on light curves with large amplitude variations and a lack of periodic signal (e.g., Alcock et al. 2001; Zaniewski et al. 2005; Tisserand et al. 2008). A few recent studies have noted that additional cuts on NIR and mid-infrared colors can improve selection efficiency (Soszyński et al., 2009; Tisserand et al., 2011; Tisserand, 2012). While these surveys have all proven successful, the use of hard cuts may eliminate actual RCB stars from their candidate lists.
Hard cuts are not necessary, however, when using a multi-feature RF classifier, which is capable (in principle) of capturing most of the photometric behavior of RCB stars (including the large-amplitude, aperiodic fades from maximum light as well as the periodic variations that occur near maximum light). Another general disadvantage in the use of hard cuts for candidate selection of rare sources is that the hard cuts are typically defined by known members of the class of objects for which the search is being conducted. Any biases present in the discovery of the known members of a particular class will then be encoded into the absolute (i.e., hard cuts) classification schema. This can exclude subclasses of sources that differ slightly from the defining members of a class. Furthermore, new discoveries will be unable to refine the selection criteria since, by construction, they will fall within the same portion of feature space as previously known examples.
The RF classifier produces an estimate of the posterior probability that a source is an RCB star given its light curve and colors. This allows us to construct a relative ranking of the RCB likelihood for all the sources in ACVS. Instead of making cuts in feature space, we can search down the ordered list of candidates. In this sense the RF classifier identifies the sources that are closest to the RCB training set relative to the other classes. The RF classifier finds the class boundaries in a completely data-driven way, allowing for the optimal use of known objects to search for new candidates in multi-dimensional feature spaces. This helps to mitigate against biases present in the training set, as classifications are performed using the location of an individual source in the multidimensional feature phase-space volume relative to defined classes in the training set.
2.2. The Training Set
The MACC RCB training set was constructed using high-confidence positional matches between ACVS sources and known RCB stars identified in SIMBAD333http://simbad.u-strasbg.fr/simbad/ and the literature. In total there are 18 cataloged RCB stars that are included in the ACVS, which we summarize in Table 1. The light curves of the known RCB stars were visually examined for the defining characteristic of the class: sudden, aperiodic drops in brightness followed by a gradual recovery to pre-decline flux levels. All of the known RCB stars but one, ASAS 0545036424.4, showed evidence for such behavior. ASAS 0545036424.4 is one of the brightest RCB stars in the LMC ( mag), which during quiescence is barely above the ASAS detection threshold. The light curve for ASAS 0545036424.4 does not show a convincing decline from maximum light, and as such we do not include it in the training set.
In addition to the 18 RCB stars in ACVS, 7 additional RCB stars are detected in ASAS with the characteristic variability of the class.444They are: SU Tau, UX Ant, UW Cen, V348 Sgr, GU Sgr, RY Sgr, and V532 Oph. These sources all have clearly variable ASAS light curves; their exclusion from the ACVS means there is some bias in the construction of that catalog. In order to keep this bias self-consistent the training set for the MACC only included sources from Richards et al. (2011) and supplements from ACVS (see Richards et al. 2012a). We note that a future paper to classify all 12 million sources detected by ASAS will include all ASAS RCB stars in its training set (Richards et al., in prep). Therefore the training set includes 17 RCB stars, which is limited by the coverage and depth of ASAS, the selection criteria of the ACVS, and the paucity of known RCB stars in the Galaxy. There are no known DYPers in ACVS: only two are known in the Galaxy and the DYPers in the MCs are fainter than the ASAS detection limits. Nevertheless, the similarity in the photometric behavior of RCB stars and DYPers allows us to use the RCB training set to search for both types of star. As more Galactic RCB stars and DYPers are discovered, we will be able to supplement the training set and improve the ability of future iterations of the RF classifier (see §6.2).
| Name | Other ID | DotAstroaaID from the MACC. | TrainingbbIndicates whether or not (Y/N) this star was included in the RCB training set. | ccCalibrated probability of belonging to the RCB class obtained when source is left out of the training set for cross validation. | ddRelative rank of RCB likelihood when source is left out of the training set for cross validation. |
|---|---|---|---|---|---|
| ID | Set? | ||||
| ASAS 0545036424.4 | HV 12842 | 220040 | N | 0.010eeSource is not included in the training set, values taken directly from the MACC. | 2806eeSource is not included in the training set, values taken directly from the MACC. |
| ASAS 1434503933.5 | V854 Cen | 240306 | Y | 0.914 | 2 |
| ASAS 1509247203.8 | S Aps | 241463 | Y | 0.934 | 2 |
| ASAS 154834+2809.4 | R CrB | 242999 | Y | 0.430 | 34 |
| ASAS 1624195920.6 | RT Nor | 244506 | Y | 0.629 | 10 |
| ASAS 1632425315.6 | RZ Nor | 244888 | Y | 0.944 | 2 |
| ASAS 1715202905.6 | V517 Oph | 247066 | Y | 0.169 | 158 |
| ASAS 1723152252.0 | V2552 Oph | 247575 | Y | 0.105 | 425 |
| ASAS 1804503243.2 | V1783 Sgr | 250762 | Y | 0.642 | 9 |
| ASAS 1808503719.7 | WX CrA | 251121 | Y | 0.834 | 2 |
| ASAS 1813252546.9 | V3795 Sgr | 251489 | Y | 0.726 | 8 |
| ASAS 1815092942.5 | VZ Sgr | 251638 | Y | 0.845 | 2 |
| ASAS 1818514632.9 | RS Tel | 251987 | Y | 0.951 | 1 |
| ASAS 1847323809.6 | V CrA | 254404 | Y | 0.804 | 3 |
| ASAS 190812+1737.7 | SV Sge | 256072 | Y | 0.053 | 859 |
| ASAS 1910122029.7 | V1157 Sgr | 256221 | Y | 0.276 | 74 |
| ASAS 1932220011.5 | ES Aql | 257713 | Y | 0.044 | 901 |
| ASAS 2203201637.6 | U Aqr | 263740 | Y | 0.839 | 3 |
In order to determine our ability to recover known RCB stars using the RF classifier we perform a leave-one-out cross validation (CV) procedure. For the 17 sources in the RCB training set, we remove one source and re-run the RF classifier in an identical fashion to that used in Richards et al. (2012b). We then record the RF-determined probability that the removed source belongs to the RCB class, , and the ranked value of relative to all other stars that are not included in the training set, . We repeat the CV procedure for each star included in the training set, and the results are shown in Table 1. Since the training set is being altered in each run of the CV, provides a better measure of the quality of each candidate; is a relative quantity, whereas the calibration of will differ slightly from run to run. Eight of the 17 sources in the training set have , implying that 50% of the training set would be a top three candidate RCB star had we previously not known about it. Fifteen of the 17 RCB stars in the training set would be in the top 0.8% of the 50,124 sources in the ACVS, while all the known RCB stars in ACVS, including ASAS 0545036424.4 (which is not in the training set), are in the top 6% of RCB candidates. Two sources in the training set, SV Sge and ES Aql, are not listed near the top of ranking during CV. For ES Aql this occurs because the star is highly active during the ASAS observations showing evidence for at least six separate declines during the 10 yr observing period. As a result the light curve folds fairly well on a period of 397 day, and ES Aql becomes confused with Mira and semi-regular periodic variables (see Figure 2). SV Sge, on the other hand, shows significant periodicity at the parasite frequency of 1 day, which precludes it from having a high . The CV procedure allows us to roughly tune the efficiency of our selection criteria; the purity of the selection criteria cannot be evaluated until candidates have been spectroscopically confirmed.
2.3. The Candidates
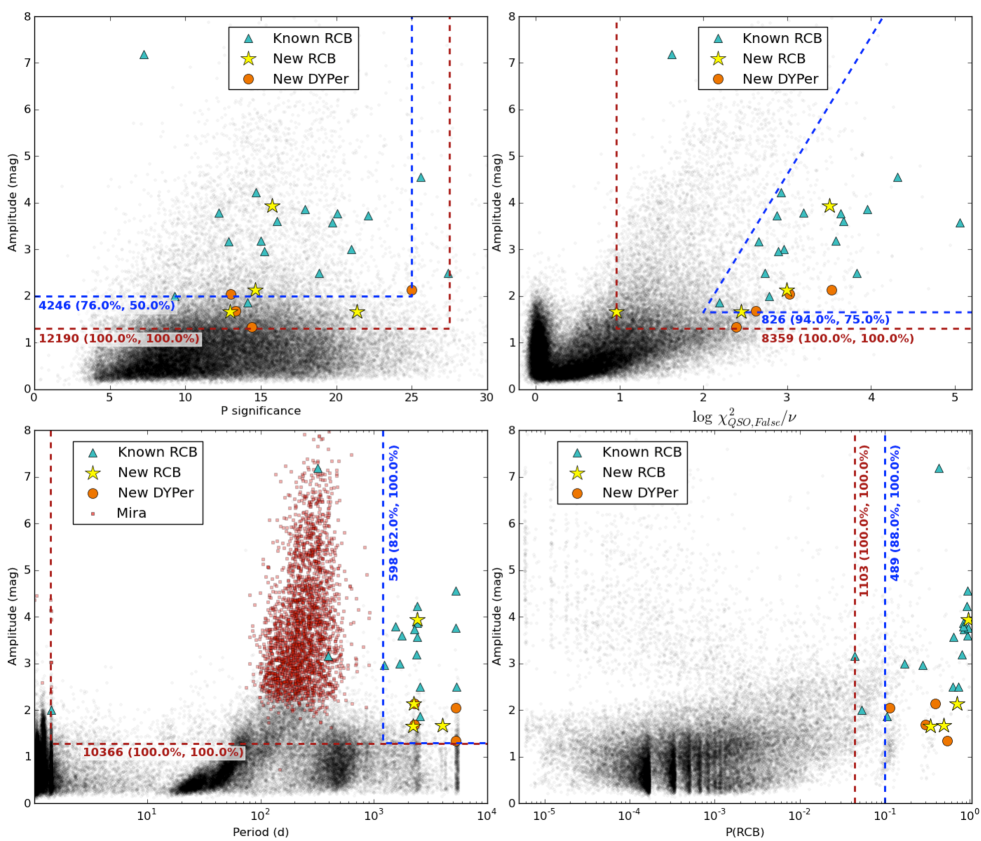
Due to the relative rarity of RCB stars, we elected to generate a candidate list with high efficiency while sacrificing the possibility of high purity. With only 50 Galactic RCB stars known to date, every new discovery has the potential to add to our knowledge of their population and characteristics. To generate our candidate list, we selected all sources from the MACC with 0.1, which resulted in a total of 472 candidates. The selection criterion was motivated by the CV experiment, which indicates that our candidate list should have an efficiency 80%. To obtain an efficiency close to 1 would require visual examination of roughly 3000 sources.
Since the expected purity of our sample is small by design, we examine the light curves of all sources within our candidate list by eye to remove sources that are clearly not RCB stars. These interlopers are typically semi-regular pulsating variables or Mira variables, often with minimum brightness levels below the detection threshold. We use the ALLSTARS Web interface (Richards et al., 2012a) to examine candidates, which in addition to light curves provides summary statistics (period, amplitude, color, etc.) for each source, as well as links to external resources, such as SIMBAD. We also remove any sources from the candidate list that are spectroscopically confirmed as non-carbon stars.
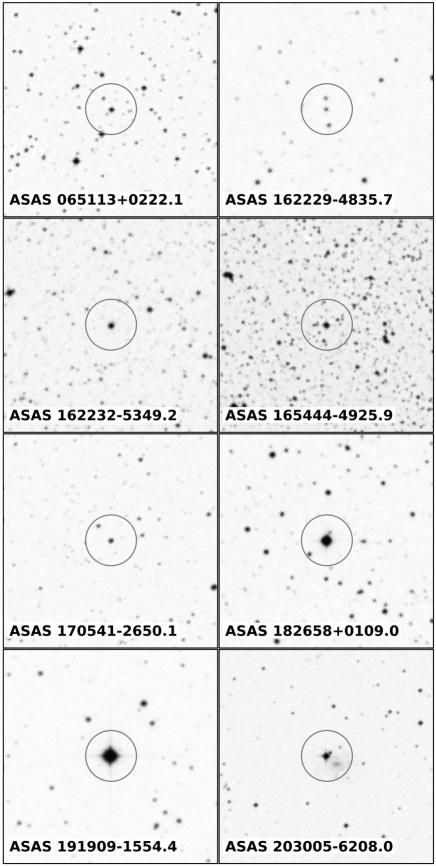
Following the removal of these stars the candidate list was culled from 472 to 15 candidates we considered likely RCB stars, for which we obtained spectroscopic follow-up observations. The general properties of the 15 spectroscopically observed candidates, including their names, coordinates, and RF probabilities, are summarized in Table 2. Finding charts using images from the Digitized Sky Survey555http://stdatu.stsci.edu/dss/ (DSS) for the spectroscopically confirmed RCB and DYPer candidates can be found in Figure 1. Six of the selected candidates for spectroscopic observations are known carbon stars listed in the General Catalog of Galactic Carbon Stars (CGCS; Alksnis et al. 2001; see Table 2).
| Name | Other ID | MACCaaDotAstro ID: internal designation for the MACC. | bbReported coordinates from the Two Micron All Sky Survey point source catalog (Cutri et al., 2003). | bbReported coordinates from the Two Micron All Sky Survey point source catalog (Cutri et al., 2003). | CGCSccID from the General Catalog of Galactic Carbon Stars (CGCS; Alksnis et al. 2001). | ddRelative rank of including all sources from version 2.3 of the MACC not in the RCB training set. | R/D/NeeFlag indicating classification of the source following spectroscopic observations: R: RCB, D: DYPer, N: Neither. | |
|---|---|---|---|---|---|---|---|---|
| ID | (hh mm ss.ss) | (dd mm ss.s) | ID | |||||
| ASAS 060105+1654.7 | V339 Ori | 220556 | 06 01 04.65 | +16 54 40.8 | … | 0.466 | 25 | N |
| ASAS 065113+0222.1 | C* 596 | 223100 | 06 51 13.31 | +02 22 08.6 | 1429 | 0.302 | 73 | D |
| ASAS 0734562250.1 | V455 Pup | 225801 | 07 34 56.24 | 22 50 04.2 | 1782 | 0.123 | 283 | N |
| ASAS 0952214329.7 | IRAS 095034315 | 232170 | 09 52 21.37 | 43 29 40.5 | … | 0.617 | 10 | N |
| ASAS 1532142854.4 | BX Lib | 242289 | 15 32 13.48 | 28 54 21.6 | … | 0.367 | 43 | N |
| ASAS 1622294835.7 | IO Nor | 244409 | 16 22 28.84 | 48 35 55.8 | … | 0.950 | 1 | R |
| ASAS 1622325349.2 | C* 2322 | 244411 | 16 22 32.08 | 53 49 15.6 | 3685 | 0.391 | 36 | D |
| ASAS 1654444925.9 | C* 2377 | 245841 | 16 54 43.60 | 49 25 55.0 | 3744 | 0.490 | 22 | R |
| ASAS 1705412650.1 | GV Oph | 246478 | 17 05 41.25 | 26 50 03.4 | … | 0.702 | 8 | R |
| ASAS 1808234439.8 | V496 CrA | 251092 | 18 08 23.05 | 44 39 46.7 | … | 0.110 | 389 | N |
| ASAS 182658+0109.0 | C* 2586 | 252675 | 18 26 57.64 | +01 09 03.1 | 4013 | 0.115 | 343 | D |
| ASAS 1858173543.8 | IRAS 185493547 | 255280 | 18 58 17.19 | 35 43 44.7 | … | 0.127 | 251 | N |
| ASAS 1919091554.4 | V1942 Sgr | 256869 | 19 19 09.60 | 15 54 30.1 | 4229 | 0.543 | 17 | D |
| ASAS 1942452137.0 | … | 258411 | 19 42 45.05 | 21 36 59.8 | … | 0.112 | 376 | N |
| ASAS 2030056208.0 | NSV 13098 | 261023 | 20 30 04.96 | 62 07 59.2 | … | 0.340 | 52 | R |
Note. — This table contains only those sources which were selected for spectroscopic follow-up following visual inspection of their light curves.
2.4. Feature Importance
RF classifiers can provide quantitative feedback about the relative importance of each feature used for classification. The
RF feature importance measure describes the decrease in the overall classifier performance following the replacement of a
single feature with a random permutation of its values (see Breiman 2001 for further details). We measure the
importance of each feature using the average importance from a one-versus-one classifier whereby the RCB class is
iteratively classified against each of the 27 other science classes on an individual basis. This procedure is run five times
and the average of all runs is taken to reduce the variance present in any single run. Unsurprisingly, we find that
mplitude is the most importnt feature. The importance measure does not properly capture the covariance between
features and as a result the majority of the important features have to do with amplitude. The second and third most
important features that are not highly covariant with amplitude are qso_log_chi2nuNULL_chi2nu,666This
is the same as the statistic, which is defined in Butler & Bloom (2011).
a measure of the dissimilarity between the photometric variations of the source and a typical quasar, and
req1_harmonics_req_0, the best fit period. Interestingly, req_signi, the
significance of the best fit period of the light curve, ranks as only the 31st most important out of the 71 features.
We summarize the results of these findings with two-dimensional cuts through the multi-dimensional feature space showing amplitude versus period significance, , and period in Figure 2. We also show amplitude versus . In each panel we show the location of the RCB stars in the training set as well as the newly discovered RCBs and DYPers presented in this paper, and we use the values from the CV experiment from §2.2 for the RCB stars in the training set. We also show the location of cuts necessary to achieve 80% efficiency (blue dashed line) when selecting candidates using only two features, as well as the cuts necessary to achieve 100% efficiency (red dashed line). As would be expected based on the results presented above, it is clear that and period are far more discriminating than period significance when selecting RCB candidates. To achieve an efficiency near 100%, is vastly superior to any two dimensional slice through feature space. We note that the discretization seen in the distribution of is the result of using a finite number of trials within the RF classifier. The probability of belonging to a class is defined as the total number of times a source is classified within that class divided by the total number of trials. These discrete values are then smeared following the calibration procedure described in §2.1.
Many of the known and new RCB stars have very similar measured best periods clustered near 2400 and 5300 days, which for each corresponds to the largest period searched during the Lomb-Scargle analysis in Richards et al. (2012b). Folding these light curves on the adopted periods clearly shows that they are not periodic on the adopted periods, despite the relatively high period significance scores (see the upper left panel of Figure 2), which suggests some peculiarity in the feature generation process for these sources. We are exploring improved metrics for periodicity to be used in future catalogs. Nevertheless, despite these spurious period measurements, the ML classifier has correctly identified that this feature tends to be erroneous for RCB stars, and as such it is a powerful discriminant for finding new examples of the class.
3. Archival Data and New Observations
3.1. ASAS Photometry
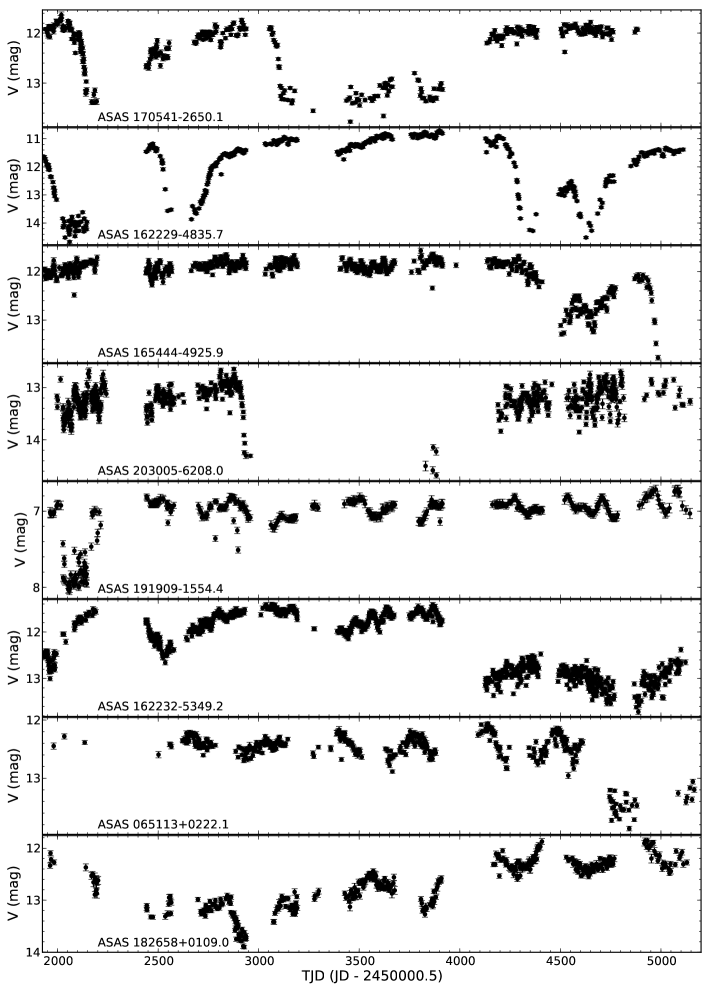
All optical photometric observations were obtained during ASAS-3, which was an extension of ASAS, conducted at the Las Campanas Observatory (for further details on ASAS and ASAS-3 see Pojmański 1997, 2001). Light curves were downloaded from the ACVS777http://www.astrouw.edu.pl/asas/?page=acvs, and imported into our DotAstro.org (http://dotastro.org) astronomical light-curve warehouse for visualization and used with internal frameworks (Brewer et al., 2009). The ACVS provides -band measurements for a set of 50,124 pre-selected ASAS variables, measured in five different apertures of varying size (Pojmański, 2002). For each star in the catalog an optimal aperture selection procedure is used to determine the final light curve, as described in Richards et al. (2012b).888These optimal aperture light curves can be obtained from DotAstro.org. The ASAS-3 -band light curves for the eight new RCB stars and DYPers are shown in Figure 3.
3.2. Spectroscopy
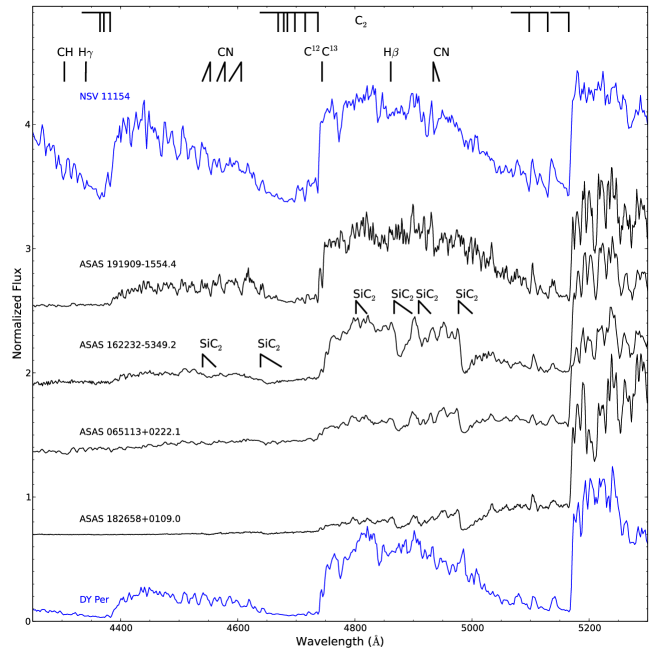
Optical spectra of the candidate RCB stars were obtained between 2011 Sep. and 2012 May with the Kast spectrograph on the Lick 3-m Shane telescope on Mt. Hamilton, California (Miller & Stone, 1993), the Low-Resolution Imaging Spectrometer (LRIS) on the 10-m Keck I telescope on Mauna Kea (Oke et al., 1995), and the RC Spectrograph on the SMARTS 1.5-m telescope at the Cerro Tololo Inter-American Observatory (Subasavage et al., 2010). All spectra were obtained via long slit observations, and the data were reduced and calibrated using standard procedures (e.g., Matheson et al. 2000; Silverman et al. 2012). On each night of observations, we obtained spectra of spectrophotometric standards to provide relative flux calibration for our targets. For queue-scheduled observations on the RC spectrograph, all observations in a single night are conducted with the slit at the same position angle. Thus, the standard stars and targets were not all observed at the parallactic angle, leading to an uncertain flux correction (Filippenko, 1982). We note, however, that the uncertainty in the flux correction does not alter any of the conclusions discussed below. A summary of our observations is given in Table 3, while the blue portion of the optical spectra are shown in Figures 4–5.
| Name | UT Date | InstrumentaaKast: Kast spectrograph on Lick 3-m telescope. LRIS: low resolution imaging spectrometer on Keck-I 10-m telescope. RC: RC spectrograph on the SMARTS 1.5-m telescope. | Range | Res. | Exp. |
|---|---|---|---|---|---|
| (Å) | (Å) | Time (s) | |||
| ASAS 060105+1654.7 | 2011-08-28.644 | LRIS | 3300–5630 | 4 | 60 |
| ASAS 060105+1654.7 | 2011-08-28.644 | LRIS | 5810–7420 | 2 | 60 |
| ASAS 1705412650.1 | 2011-09-26.206 | LRIS | 3300–5630 | 4 | 60 |
| ASAS 1705412650.1 | 2011-09-26.205 | LRIS | 5720–7360 | 2 | 30 |
| ASAS 1919091554.4 | 2011-09-26.212 | LRIS | 3300–5630 | 4 | 5 |
| ASAS 1919091554.4 | 2011-09-26.212 | LRIS | 5720–7360 | 2 | 2 |
| ASAS 1622325349.2 | 2012-01-16.375 | RC | 3300–9370 | 17 | 720 |
| ASAS 0952214329.7 | 2012-01-19.151 | RC | 3300–9370 | 17 | 540 |
| ASAS 065113+0222.1 | 2012-02-01.204 | Kast | 3450–9850 | 4bbThe Kast spectrograph is a dual arm spectrograph with a resolution of 4 Å on the blue side, which is relevant for the spectra shown in Figure 4. The typical resolution on the red side is 10 Å. | 300ccExposure time for the blue arm of the spectrograph. Due to the red nature of the SED the exposure time for the red arm was shorter than the blue. |
| ASAS 1622294835.7 | 2012-02-06.373 | RC | 3300–9370 | 17 | 540 |
| ASAS 1622325349.2 | 2012-02-13.325 | RC | 3660–5440 | 4 | 2700 |
| ASAS 1622294835.7 | 2012-02-15.348 | RC | 3660–5440 | 4 | 2700 |
| DY Per | 2012-02-23.107 | Kast | 3450–9850 | 4bbThe Kast spectrograph is a dual arm spectrograph with a resolution of 4 Å on the blue side, which is relevant for the spectra shown in Figure 4. The typical resolution on the red side is 10 Å. | 380ccExposure time for the blue arm of the spectrograph. Due to the red nature of the SED the exposure time for the red arm was shorter than the blue. |
| ASAS 0734562250.1 | 2012-03-15.225 | LRIS | 3350–10000 | 4 | 60ccExposure time for the blue arm of the spectrograph. Due to the red nature of the SED the exposure time for the red arm was shorter than the blue. |
| ASAS 1654444925.9 | 2012-03-15.651 | LRIS | 3250–10000 | 4 | 30ccExposure time for the blue arm of the spectrograph. Due to the red nature of the SED the exposure time for the red arm was shorter than the blue. |
| ASAS 182658+0109.0 | 2012-03-15.654 | LRIS | 3250–10000 | 4 | 30ccExposure time for the blue arm of the spectrograph. Due to the red nature of the SED the exposure time for the red arm was shorter than the blue. |
| ASAS 1858173543.8 | 2012-03-15.667 | LRIS | 3250–10000 | 4 | 30ccExposure time for the blue arm of the spectrograph. Due to the red nature of the SED the exposure time for the red arm was shorter than the blue. |
| ASAS 1532142854.4 | 2012-03-15.670 | LRIS | 3250–10000 | 4 | 60ccExposure time for the blue arm of the spectrograph. Due to the red nature of the SED the exposure time for the red arm was shorter than the blue. |
| ASAS 2030056208.0 | 2012-03-23.426 | RC | 3660–5440 | 4 | 2160 |
| NSV 11154 | 2012-04-02.524 | Kast | 3450–9850 | 4bbThe Kast spectrograph is a dual arm spectrograph with a resolution of 4 Å on the blue side, which is relevant for the spectra shown in Figure 4. The typical resolution on the red side is 10 Å. | 210ccExposure time for the blue arm of the spectrograph. Due to the red nature of the SED the exposure time for the red arm was shorter than the blue. |
| ASAS 1942452137.0 | 2012-04-23.513 | Kast | 3450–9850 | 4bbThe Kast spectrograph is a dual arm spectrograph with a resolution of 4 Å on the blue side, which is relevant for the spectra shown in Figure 4. The typical resolution on the red side is 10 Å. | 120ccExposure time for the blue arm of the spectrograph. Due to the red nature of the SED the exposure time for the red arm was shorter than the blue. |
| ASAS 1808234439.8 | 2012-05-17.626 | LRIS | 5420–10000 | 4 | 16 |
4. Analysis
4.1. Spectroscopic Confirmation
While the unique photometric behavior of RCB stars makes them readily identifiable in well sampled light curves taken over the course of several years, there are several examples of high-amplitude variables being classified as RCB stars which are later refuted by spectroscopic observations. Most of the misidentified candidates are either cataclysmic, symbiotic or semi-regular variables (see e.g., Lawson & Cottrell 1990; Tisserand et al. 2008). RCB stars are a subclass of the HdC stars. For an RCB candidate to be confirmed as a true member of the class, its spectrum must show the two prominent features of HdC stars: anomalously strong carbon absorption and a lack of atomic and molecular H features.
To confirm the RCB candidates found in the ACVS, we obtained low-resolution spectra of the 15 candidates presented in § 2. Candidates observable from the northern hemisphere were observed with Kast and LRIS, while those only accessible from the southern hemisphere were observed with the RC spectrograph. For some of the southern hemisphere targets very low resolution spectra were obtained first to confirm the presence of C2 before slightly higher resolution observations were obtained (see Table 3).
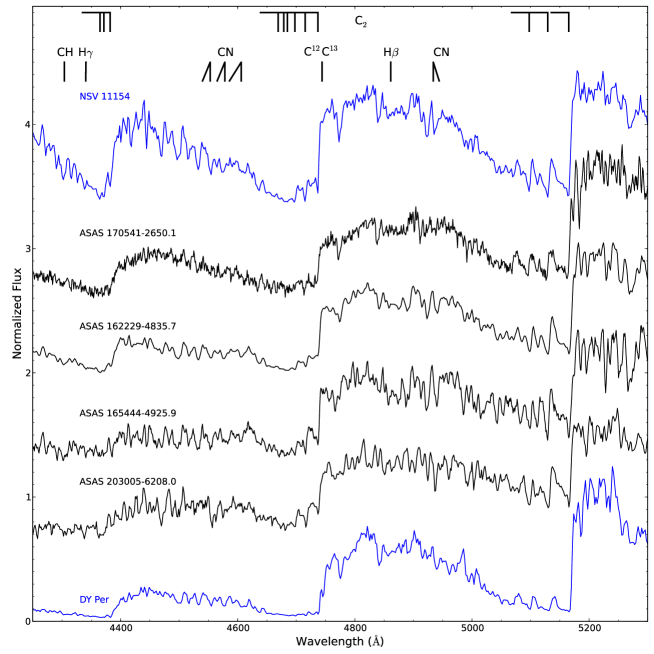
We searched the spectra for the presence of strong carbon features, primarily C2 and CN, and a lack of Balmer absorption to confirm the RCB classification for the ACVS candidates. We find these characteristics in eight of the spectroscopically observed stars (see Figures 4–5), which we consider good RCB and DYPer candidates as summarized in Table 4. The remaining candidates were rejected as possible RCB stars based on their spectra, which typically showed strong TiO and VO absorption or clear evidence for H. The properties of the rejected candidates are summarized in Table 5. In the remainder of this paper we no longer consider these stars candidates and restrict our discussion to the eight good candidates listed in Table 4.
In addition to the hallmark traits of overabundant carbon and a lack of Balmer absorption, RCB stars show a number of other unique spectroscopic characteristics. In particular, they show a very high ratio of 12C/13C and no evidence for band absorption. To search for the presence of 13C, we examined the spectra for the 4744 band head of 12C13C, which is typically very weak or absent in the spectra of RCB stars. We find evidence for 12C13C in ASAS 1919091554.4, ASAS 1622325349.2, ASAS 065113+0222.1, and ASAS 182658+0109.0 while ASAS 1622325349.2 shows possible evidence for the 13C13C band at 4752. The presence of 13C suggests that these four stars are likely DYPers. We consider these four stars closer analogs to DY Per and the DYPers found in the LMC and SMC (Alcock et al., 2001; Tisserand et al., 2009) than they are to classical RCB stars. One of the DYPers, ASAS 065113+0222.1, shows weak evidence for CH 4300 ( band) absorption and possible evidence for H, which is sometimes seen in the spectra of DYPers. We note that the signal-to-noise ratio (S/N) of all our spectra in the range between 4300–4350 is relatively low, making definitive statements about the presence or lack of both CH and H challenging. Finally, we note that we see evidence for the Merrill-Sanford bands of SiC2 in three of our candidates: ASAS 1622325349.2, ASAS 065113+0222.1, and ASAS 182658+0109.0. To our knowledge this is the first identification of SiC2 in a DYPer spectrum, though the presence of this molecule should not come as a surprise as RCB stars are both C and Si rich (Clayton, 1996).
| Name | aaObserved quantity, not corrected for Galactic reddening. | mag | t | 13C | H/CH | pulsations | RCB/ | |
|---|---|---|---|---|---|---|---|---|
| (mag) | (d) | (mag day-1) | DYPer | |||||
| ASAS 1705412650.1 | 11.9 | 1.2 | 31 | 0.04 | Weak 4744? | None | NbbThe period of ASAS observations covers very little time around maximum light, and as a result there is a relatively short period of data suitable for searching for pulsations. See § 4.3. | RCB |
| ASAS 1622294835.7 | 10.8 | 2.8 | 83 | 0.03 | None | Weak H?, Weak CH | Y | RCB |
| ASAS 1654444925.9 | 11.8 | 1.6 | 48 | 0.03 | None | weak H?, H? | Y | RCB |
| ASAS 2030056208.0 | 13.2 | 1.4 | 30 | 0.05 | None | H?, H? – blends | Y | RCB |
| ASAS 1919091554.4 | 6.9 | 1.0 | 20 | 0.05 | Y | None | Y | DYPer |
| ASAS 1622325349.2 | 11.5 | 1.7 | 256 | 0.007 | Y | None | Y | DYPer |
| ASAS 065113+0222.1 | 12.4 | 1.0 | 140 | 0.007 | Y | weak H?, Weak CH | Y | DYPer |
| ASAS 182658+0109.0 | 12.1 | 1.6 | 960 | 0.002 | Y | None | Y | DYPer |
| Name | aaObserved quantity, not corrected for Galactic reddening. | Remarks |
|---|---|---|
| (mag) | ||
| ASAS 060105+1654.7 | 12.3 | No C2; strong H, band |
| ASAS 0734562250.1 | 12.8 | C2; strong H emission |
| ASAS 0952214329.7 | 10.6 | Strong TiO, VO; H? |
| ASAS 1532142854.4 | 12.3 | No C2; H emission, strong band; SRPVbbIdentified as a semi-regular periodic variable in the General Catalog of Variable Stars (Samus et al., 2008). |
| ASAS 1808234439.8 | 12.1 | Strong TiO, VO |
| ASAS 1858173543.8 | 10.9 | Strong TiO, VO |
| ASAS 1942452137.0 | 12.5 | Strong TiO, VO |
4.2. Photometric Behavior
In addition to spectral differences, RCB stars and DYPers show some dissimilarities in their photometric evolution as well. The first order behavior is the same: both show deep, irregular declines in their light curves which can take anywhere from a few months to a several years to recover to maximum brightness. Beyond that generic behavior, however, the shape of the decline tends to differ: RCB stars show fast declines with slow recoveries whereas DYPers tend to show a more symmetric decline and recovery.
The photometric properties of our candidates, including decline rates for the most prominent and well sampled declines, are summarized in Table 4. As previously noted in the caption of Figure 1, the full amplitude of the variations of these stars are likely underestimated due to the large PSF on ASAS images. This means that the decline rates should be treated as lower limits, since the true brightness of the star may be below that measured in a large aperture. Nevertheless, the decline rates for the four RCB stars are relatively fast and consistent with those given in Tisserand et al. (2009) for RCB stars in the MCs, 0.04 mag day-1. The most telling feature of the light curves is the shape of the declines, however. For the four spectroscopic RCB stars, ASAS 1705412650.1, ASAS 1622294835.7, ASAS 1654444925.9, and ASAS 2030056208.0 the declines are very rapid. While we do not detect ASAS 1654444925.9 after its sharp decline on TJD5000, the other three show slow asymmetric recoveries to maximum light. The four spectroscopic DYPers generally show a slower decline with a roughly symmetric recovery, though we note that the full recoveries of ASAS 065113+0222.1 and ASAS 1622325349.2 are not observed.
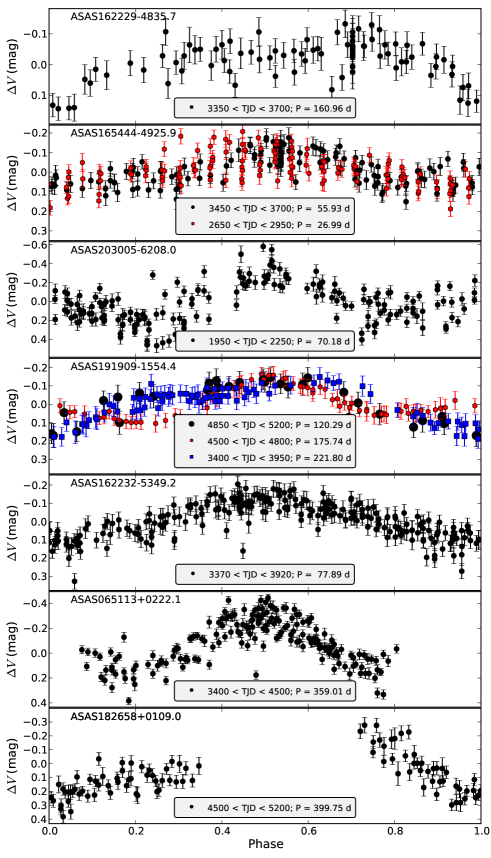
4.3. Pulsations
All RCB stars are variable near maximum light, with most and possibly all of the variations thought to be due to pulsation (Lawson et al., 1990; Clayton, 1996). Typical periods are 40–100 days, and the amplitudes are a few tenths of a magnitude. The pulsational properties of DYPers are not as well constrained, because the sample is both small and only recently identified. Each of the four DYPers identified in Alcock et al. (2001) shows evidence for periodic variability near maximum light, with typical periods of 100–200 days.
To search for the presence of pulsations in our candidate RCB stars, we use a generalized Lomb–Scargle periodogram (Lomb 1976; Scargle 1982; Zechmeister & Kürster 2009) to analyze each star (see Richards et al. 2011 for more details on our Lomb–Scargle periodogram implementation). Our analysis only examines data that are well separated from decline phases, and we focus on the portions of light curves where the secular trend is slowly changing relative to the periodic variability. For each star we simultaneously fit for the harmonic plus linear or quadratic long-term trend in the data. The frequency that produces the largest peak in the periodogram, after masking out the 1 day alias, is adopted as the best-fit period.
We find evidence for periodicity in the light curves of each star, except for ASAS 1622294835.7. For most of the observing window ASAS 1622294835.7 was in or near a decline, and we predict that additional observations of ASAS 1622294835.7, be they historical or in the future, will show periodic variability near maximum light. The trend-removed, phase-folded light curves of the remaining seven stars are shown in Figure 6. Insets in each panel list the range of dates that were included in the Lomb-Scargle analysis, as well as the best fit period for the data.
Some RCB stars are known to have more than a single dominant period (see Clayton 1996 and references therein). We find evidence for multiple periods in ASAS 1919091554.4, with periods of 120, 175, and 221 days that appear to change every 1–2 years. Evidence for multiple periods also appears to be present in ASAS 1654444925.9. The best fit periods in this case are 27 and 56 days, which differ by roughly a factor of two. The longer period may in this case simply be a harmonic of the shorter period. Finally, we note that the best fit period for ASAS 1622325349.2, 359 days, is very close to one year, and it is possible that the data are beating against the yearly observation cycle. The folded light curve appears to traverse a full cycle over half the full phase cycle. The slight upturn in the folded data around phase 0.15 suggests that the true period is likely 180 days, half the best fit period.
4.4. Spectral Energy Distributions
All RCB stars are known to have an infrared (IR) excess due to the presence of circumstellar dust (Feast, 1997; Clayton, 1996), and all the known DYPers in the MCs also show evidence for excess IR emission (Tisserand et al., 2009). To check for a similar excess in the new ACVS RCB stars and DYPers, broadband spectral energy distributions (SEDs) were constructed with catalog data obtained from USNO-B1 (Monet et al., 2003), the Two Micron All Sky Survey (2MASS; Skrutskie et al. 2006), the Wide-Field Infrared Survey Explorer (WISE, Wright et al. 2010), AKARI (Murakami et al., 2007), the Mid-course Space Experiment (MSX; Mill et al. 1994), and the Infrared Astronomical Satellite (IRAS; Neugebauer et al. 1984).999Catalog data for each of these surveys can be found at: http://irsa.ipac.caltech.edu/ The USNO-B1 catalog contains measurements made on digital scans of photographic plates corresponding roughly to the , , and bands. Repeated and plates were taken typically more than a decade apart. To convert the five separate USNO-B1 magnitude measurements to the standard system of the Sloan Digital Sky Survey (SDSS; Fukugita et al. 1996), we invert the filter transformations from (Monet et al. 2003; see also Sesar et al. 2006). The two measurements each for the and the band are then averaged to get the reported SDSS and magnitudes, unless the two measurements differ by 1 mag, in which case it is assumed that the fainter observation occurred during a fading episode of the star. Then the final adopted SDSS magnitude is that of the brighter measurement. There is a large scatter in the transformations from USNO-B1 to SDSS (Monet et al., 2003; Sesar et al., 2006), which, leads us to adopt a conservative 1- uncertainty of 40% in flux density on each of the transformed SDSS flux measurements. The 2MASS magnitude measurements are converted to fluxes via the calibration of Cohen et al. (2003) and the WISE magnitudes are converted to fluxes via the calibration in Cutri et al. (2011). The remaining catalogs provide flux density measurements in Jy rather than using the Vega magnitude system.
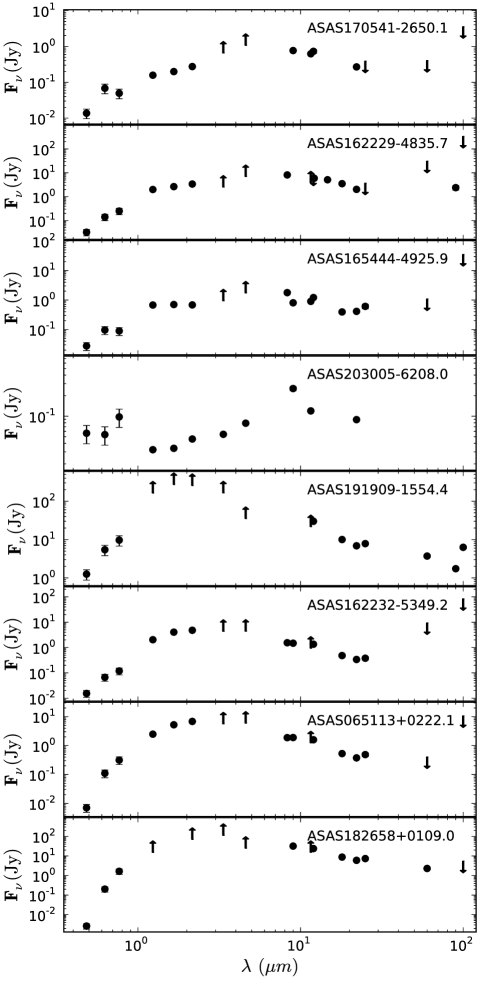
The full SEDs extending from the optical to the mid-infrared for each of the new RCB stars and DYPers are shown in Figure 7. All of the candidates but ASAS 2030056208.0 saturate the W1 (3.5 m) and W2 (4.6 m) bands of WISE, while of those all but ASAS 1705412650.1 and ASAS 1654444925.9 saturate W3 (11.6 m) as well. ASAS 1919091554.4 and ASAS 182658+0109.0 saturate all three of the 2MASS filters and are the only candidates detected at either 60 and/or 100 m by IRAS. ASAS 1622294835.7 and ASAS 1919091554.4 were the only candidates detected at 90 m by AKARI.
Using RCB stars and DYPers in the MCs, Tisserand et al. (2009) find that the RCB stars typically have SEDs with two distinct peaks, whereas DYPers typically have a single peak. It is argued in Tisserand et al. that the SEDs of both can be understood as emission from a stellar photosphere and surrounding dust shell; the cooler photospheric temperatures of DYPers are less distinct relative to the dust emission leading to a single broad peak rather than two. We caution that the reddening toward each of the new Galactic candidates is unknown, which makes a detailed analysis of their SEDs challenging. Furthermore, the observations were not taken simultaneously in each of the various bandpasses. Nevertheless, a few interesting trends can be gleaned from the data. The four stars that spectroscopically resemble RCB stars, ASAS 1705412650.1, ASAS 1622294835.7, ASAS 1654444925.9, and ASAS 2030056208.0 all show clear evidence for a mid-infrared excess relative to their optical brightness. The peak of emission from ASAS 1919091554.4 and ASAS 182658+0109.0 is not well constrained because they saturate the detectors between 1 and 6 m, yet interestingly both show evidence for an infrared excess redward of 50 m. This suggests that there might be some very cool ( 100 K) dust in the circumstellar environment of these stars, which is observed in some of the bright, nearby RCB stars. For instance, Spitzer and Herschel observations of R CrB show evidence for a large, 4 pc, cool, K, and diffuse shell of gas that is detected in the far-IR (Clayton et al., 2011). ASAS 1622325349.2 and ASAS 065113+0222.1 show evidence for a single broad peak in their SED occurring around 2 m, which is similar to the SEDs of the DYPers observed in the MCs.
4.5. Near-infrared Variability
An overlap in the survey fields between 2MASS and the DEep Near Infrared Souther Sky Survey (DENIS; Epchtein et al. 1994) allows measurements of the NIR variability of four of the newly discovered RCB stars and DYPers. Photometric measurements from 2MASS and the two epochs of DENIS observations for these stars are summarized in Table 6. Unfortunately the 2MASS and DENIS observations proceeded the ASAS monitoring, and so we cannot provide contextual information such as the state of the star (near maximum, on decline, during deep minimum, etc.) at the time of the NIR observations. To within a few tenths of a magnitude, ASAS 1622294835.7 is not variable between the 2MASS and DENIS observations. On timescales of a few weeks to months both ASAS 1622325349.2 and ASAS 1705412650.1 show evidence for variations 1 mag in the NIR. Similar variations have been observed for several of the RCB stars and DYPers in the MCs (e.g., Tisserand et al. 2004, 2009). The largest variations were observed in ASAS 2030056208.0, which changed by 4 mag in the band during the 4 yr between the DENIS and 2MASS observations. ASAS 2030056208.0 also shows a large variation between the DENIS band measurement and the -band measurement from USNO-B1, with mag. This star is clearly a large-amplitude variable, which likely explains its unusual SED. In the DENIS observations, which provide simultaneous optical and NIR measurements, ASAS 2030056208.0 is always fainter in the optical, suggesting that the unusual shape to its SED (see Figure 7) is the result of non-coeval observations.
| Name | Epoch2MASSaaCatalog measurement from the 2MASS point source catalog (Cutri et al., 2003). | aaCatalog measurement from the 2MASS point source catalog (Cutri et al., 2003). | aaCatalog measurement from the 2MASS point source catalog (Cutri et al., 2003). | aaCatalog measurement from the 2MASS point source catalog (Cutri et al., 2003). | EpochDENISbbCatalog measurement from the DENIS point source catalog (Epchtein et al., 1999). | bbCatalog measurement from the DENIS point source catalog (Epchtein et al., 1999). | bbCatalog measurement from the DENIS point source catalog (Epchtein et al., 1999). | bbCatalog measurement from the DENIS point source catalog (Epchtein et al., 1999). |
|---|---|---|---|---|---|---|---|---|
| (JD) | (mag) | (mag) | (mag) | (JD) | (mag) | (mag) | (mag) | |
| ASAS 1705412650.1 | 2451004.658 | 10.01 | 9.28 | 8.46 | 2451730.639 | 11.09 | 10.18 | 9.13 |
| 2451749.592 | 9.94 | 8.91 | 7.96 | |||||
| ASAS 1622294835.7 | 2451347.541 | 7.26 | 6.47 | 5.73 | 2451387.540 | 9.10 | 6.90 | 5.40 |
| 2451395.492 | 8.98 | 7.13 | 5.45 | |||||
| ASAS 1622325349.2 | 2451347.538 | 7.24 | 6.01 | 5.36 | 2451387.532 | 9.12 | 6.59 | 4.40 |
| 2451395.485 | 9.20 | 6.30 | 4.28 | |||||
| ASAS 2030056208.0 | 2451701.878 | 11.73 | 11.20 | 10.40 | 2450267.768 | 17.62 | 15.66 | 12.06 |
| 2451003.746 | 15.82 | 14.37 | 11.89 |
Note. —
5. Individual Stars
We discuss the individual stars and whether they should be considered RCB stars or DYPers below. We also use SIMBAD to identify alternate names for these stars and previous studies in the literature (see also Table 2).
5.1. ASAS 1705412650.1 (GV Oph)
This star was first identified as a variable source on Harvard photographic plates with the name Harvard Variable 4368, and was cataloged as a likely long period variable based on the large amplitude of variations from 13.9 mag to below the photographic limit of 16.5 mag (Swope, 1928). It was later named GV Oph in the General Catalog of Variable Stars (GCVS; Kukarkin et al. 1971; Samus et al. 2008) as a variable of unknown type with rapid variations. The light curve, spectrum, and SED of this star are consistent with it being an RCB star.
5.2. ASAS 1622294835.7 (IO Nor)
This star is listed as a Mira variable in the GCVS with the name IO Nor. In Clarke et al. (2005) it is identified as a star with an IR excess based on MSX observations. On the basis of its NIR and mid-IR colors, it is identified as a RCB candidate in Tisserand (2012), and considered a likely RCB star on the basis of its ASAS light curve.101010In Tisserand (2012) two additional stars with IR colors consistent with RCB stars, V653 Sco and V581 CrA, are identified as highly likely RCB stars on the basis of their ASAS light curves. V581 CrA is not included in ACVS and therefore is not included in the MACC. V653 Sco is listed in the GCVS as a Mira variable and classified as a semi-regular periodic variable in the MACC, . It has and . The light curve is somewhat similar to ES Aql, in that it fades below the ASAS detection limits and it is highly active during the 8 yr it was observed, meaning it that folds decently well on a period of 450 days. A spectrum will be needed to disambiguate between an RCB and long period variable classification for V653 Sco. We independently identified IO Nor as a likely RCB star on the basis of its light curve (in the MACC it is the most likely RCB in ACVS), and our spectrum confirms that it is a genuine RCB star. The previous classification as a Mira variable is likely based on the late spectral type and large amplitude of variability, but Figure 3 clearly shows that ASAS 1622294835.7 is not a long period variable.
5.3. ASAS 1654444925.9 (C* 2377)
The variability of this star has not been cataloged to date, and it is listed in the CGCS as C* 2377 (Alksnis et al., 2001). The spectrum, SED, and pulsations exhibited by this star are consistent with RCB stars. There may be evidence for weak CH absorption, though we caution that the S/N is low near 4300 Å. The light curve shows a sharp decline, similar to RCB stars, but the recovery is not observed. Nevertheless, the evidence points to ASAS 1654444925.9 being a new member of the RCB class.
5.4. ASAS 2030056208.0 (NSV 13098)
This star was first identified as variable by Luyten (1932) with a maximum brightness of 14 mag and a minimum 18 mag. Luyten assigned it the name AN 141.1932, and it was later cataloged as a possible variable star in the GCVS as NSV 13098. The light curve, spectrum, and SED are all consistent with an RCB classification. Higher resolution and S/N spectra are needed to confirm if H absorption is present, though we note that some RCB stars do show evidence of H in their spectra (e.g., V854 Cen; Kilkenny & Marang 1989), leading us to conclude that ASAS 2030056208.0 is an RCB star.
5.5. ASAS 1919091554.4 (V1942 Sgr)
This star is listed as a slow irregular variable of late spectral type with the name V1942 Sgr in the GCVS. It is the brightest star among our candidates, and as such it is one of the best studied carbon stars to date. According to SIMBAD ASAS 1919091554.4 is discussed in more than 50 papers in the literature. In the CGCS it is listed as C* 2721. ASAS 1919091554.4 is detected by Hipparcos (HIP 94940) and has a measured parallax of 2.520.82 mas (Perryman et al., 1997). This corresponds to a distance pc and a distance modulus 8 mag. ASAS 1919091554.4 is one of the few Galactic carbon stars with a measured parallax, and it is important for constraining the luminosity function of carbon stars (Wallerstein & Knapp, 1998). In their spectral atlas of carbon stars, Barnbaum et al. (1996) identify ASAS 1919091554.4 as having a spectral type of N5+ C25.5. Relative abundance measurements by Abia & Isern (1997) show that 12C/13C, which is low relative to classical RCB stars. The proximity of ASAS 1919091554.4 allows its circumstellar dust shell to be resolved in IRAS images (e.g., Young et al. 1993), and Egan & Leung (1991) use ASAS 1919091554.4 and other carbon stars with resolved dust shells and 100 m excess to statistically argue that each of these stars must be surrounded by two dust shells, one that is old, 104 yr, and the other that is produced by a current episode of mass loss. Recent H I observations by Libert et al. (2010) have shown evidence for the presence of H in the circumstellar shell of ASAS 1919091554.4. The shallow, symmetric fade of the light curve, along with the N type carbon star spectrum and the presence of 13C in the spectrum, leads us to conclude that ASAS 1919091554.4 is a DYPer. This is the only candidate within our sample for which we can measure the absolute magnitude, since we have the Hipparcos parallax measurement. Adopting a maximum light brightness of 6.8 mag, we find that ASAS 1919091554.4 has mag. This is roughly 0.4 mag fainter than the faintest DYPers in the MCs (Tisserand et al., 2009), suggesting that either the luminosity function extends fainter than that observed in the MCs or there is unaccounted for dust extinction toward ASAS 1919091554.4.
5.6. ASAS 1622325349.2 (C* 2322)
The variability of this star has not been cataloged to date, and it is listed in the CGCS as C* 2322. The relatively slow, symmetric decline and recovery in the light curve of ASAS 1622325349.2 lead us to classify it as a DYPer variable. The presence of 13C in the spectrum and the single peak in the SED support this classification.
5.7. ASAS 065113+0222.1 (C* 596)
The variability of this star has not been cataloged to date, and it is listed in the CGCS as C* 596. The presence of 13C in the spectrum and the single peak in the SED lead us to classify ASAS 065113+0222.1 as a DYPer variable.
5.8. ASAS 182658+0109.0 (C* 2586)
The variability of this star has not been cataloged to date, and it is listed in the CGCS as C* 2586. Based on weekly averages of DIRBE NIR observations taken over 3.6 yr, Price et al. (2010) list ASAS 182658+0109.0 as a non-variable source. Low resolution spectra taken with IRAS show 11 m SiC dust emission, which typically indicates significant mass loss from a carbon star (Kwok et al., 1997). The light curve shows a 5–6 yr symmetric decline, and there is clear evidence for 13C in the spectrum. The IRAS detection at 60 m shows a clear IR excess relative to a single temperature blackbody. While there is no evidence for H, the S/N in our spectrum is low blueward of 4700 Å. We consider ASAS 182658+0109.0 a likely DYPer, though higher S/N spectra are required for a detailed abundance analysis to confirm this classification.
6. Discussion
6.1. New Candidates from an Expanded Training Set
| Name | Other ID | DotAstroaaID from the MACC. | bbReported coordinates from the Two Micron All Sky Survey point source catalog (Cutri et al., 2003). | bbReported coordinates from the Two Micron All Sky Survey point source catalog (Cutri et al., 2003). | CGCSccID from the General Catalog of Galactic Carbon Stars (CGCS; Alksnis et al. 2001). | ddProbability of belonging to the RCB class when using the augmented training set. | R(RCB)eeRelative rank of when using the augmented training set. | Remarks |
|---|---|---|---|---|---|---|---|---|
| ID | (hh mm ss.ss) | (dd mm ss.s) | ID | new | new | |||
| ASAS 053302+1808.0 | IRAS 053011805 | 219583 | 05 33 01.72 | 18 07 59.0 | 980 | 0.339 | 380 | 1 |
| ASAS 0811213734.9 | C* 1086 | 227950 | 08 11 21.39 | 37 34 54.2 | 2106 | 0.145 | 492 | 1 |
| ASAS 1252455441.6 | … | 237449 | 12 52 44.92 | 54 41 37.5 | … | 0.309 | 394 | 2 |
| ASAS 1600332726.3 | 1RXS J160033.8272614? | 243486 | 16 00 33.16 | 27 26 18.5 | … | 0.142 | 498 | 2,3 |
| ASAS 1752263411.5 | IRAS 174913410 | 249729 | 17 52 25.50 | 34 11 28.2 | … | 0.166 | 460 | |
| ASAS 200531+0427.2 | V902 Aql | 259768 | 20 05 30.83 | 04 27 12.8 | … | 0.382 | 353 | 2,4 |
Note. — Remarks: 1. Known carbon star, shows evidence for multiple declines that may be periodic. Semi-regular variable? 2. Shows evidence for a single partially resolved decline or recovery. 3. This star is 9″ from the cataloged X-ray source 1RXS J160033.8272614. The possible association with an X-ray counterpart suggests that it may be a Be star. 4. This star is listed as having an M spectral type in the GCVS. We were unable to find a published reference listing this spectral type and suggest a new spectrum be taken to determine the spectral type.
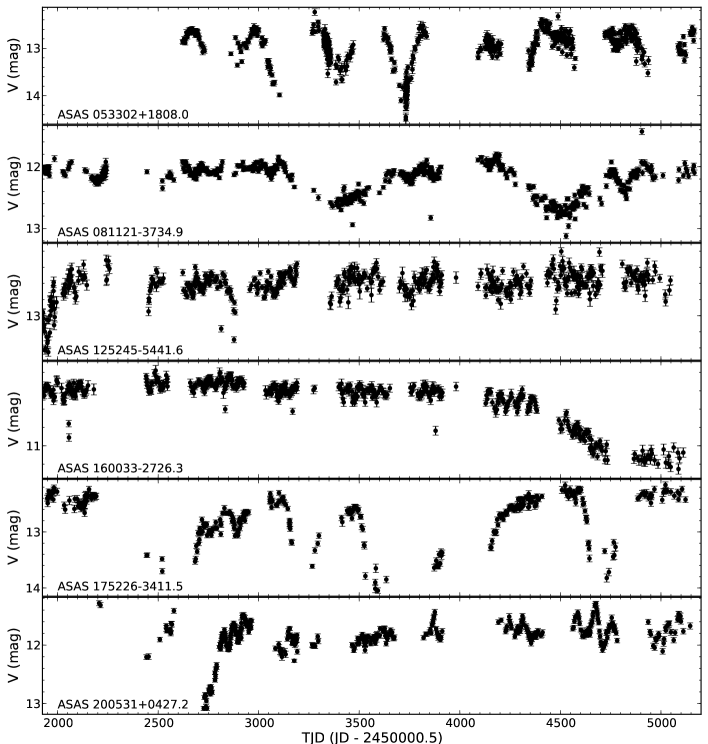
As mentioned in § 2.1, one of the major strengths of ML classification is that new discoveries may be fed back into the machinery in order to improve future iterations of the classifier. In an attempt to recover more RCB stars and DYPers in the ACVS that were missed in our initial search of the MACC, we created an augmented RCB training set by adding the eight new RCB stars and DYPers identified in this paper to the 17 sources already included in the training set. This augmented training set should increase the likelihood of discovering new candidates, particularly DYPers, of which there were no examples in the original training set.
Using the augmented training set we re-ran the RF classifier from Richards et al. (2012b) on all the ACVS light curves to search for any additional good candidates. We focus our new search on candidates with a significant change in , which were not examined in the initial search of the MACC. In particular, we visually examine the light curves of all sources with , , and . There are a total of 96 sources that meet these criteria, which were not included in the 472 visually inspected sources from the original MACC. Of these 96, we conservatively select six as candidate RCB stars or DYPers. One is a highly likely RCB star with multiple declines and asymmetric recoveries, three show evidence for a single decline which is only partially sampled, and two are known carbon stars that are likely semi-regular periodic variables. We list the candidates in Table 7 with brief comments on each and show their light curves in Figure 8.
6.2. Future Improvements to the Classifier
Restricting our search for bright RCB stars to only those sources in the ACVS has biased the results of our search. As was mentioned in § 2.2, there are seven known RCB stars that show clear variability in their ASAS light curves yet were not selected for inclusion in the ACVS. This suggests that several large-amplitude ASAS variables are missing from the ACVS, presumably including a few unknown RCB stars. This bias can easily be corrected by searching all of ASAS for RCB stars, however, such a search would include significant new challenges as there are 12 million sources in ASAS. In addition, our existing classification framework is not designed to deal with a catalog where the overwhelming majority of sources are not in fact variable. Nevertheless, both of these challenges must be addressed prior to the LSST era. We have developed frameworks that can ingest millions of light curves and are currently experimenting with methods to deal with non-variable sources, the results of which will be presented in a catalog with classifications for all 12 million sources in ASAS (Richards et al., in prep). Furthermore, it has been shown that the use of mid-infrared colors is a powerful discriminant when trying to select RCB stars (Tisserand et al., 2011; Tisserand, 2012). While our use of NIR colors is important for selecting RCB stars (see e.g., Soszyński et al. 2009), adding the mid-infrared measurements from the all-sky WISE survey will dramatically improve our purity when selecting RCB candidates as several of the Mira and semi-regular variables that served as interlopers in the current search (§ 2.3) would be eliminated with the use of mid-infrared colors.
7. Conclusions
We have used the 71-feature Random Forest machine-learning ACVS classification catalog from Richards et al. (2012b) to identify likely DYPers and RCB stars in the ACVS catalog. The RF classifier provides several advantages over previous methods to search time-domain survey data for RCB stars and DYPers. Previously successful searches for RCB stars have developed a methodology focused on large amplitude variables that do not show strong evidence for periodicity (e.g., Alcock et al. 2001; Zaniewski et al. 2005; Tisserand et al. 2008). While the RF classifier is capable of capturing the large variations and irregular declines observed in RCB stars, the use of many features allows complex behavior, such as the shape of the decline and recovery, to be captured as well. Another advantage of RF classification is that it does not require hard cuts on any individual light curve feature, which can exclude real RCB stars from the final candidate selection. There are a total of 472 stars with 0.1 in version 2.3 of the MACC, 15 of which were selected as good RCB or DYPer candidates after visual inspection and existing spectroscopic information.
Following spectroscopic observations eight of the good candidates were identified as bona fide RCB stars or DYPers. Four of these, ASAS 1705412650.1 (GV Oph), ASAS 1622294835.7 (IO Nor), ASAS 1654444925.9, and ASAS 2030056208.0 were confirmed as new RCB stars on the basis of (i) their light curves showing irregular, sharp declines of large amplitude ( 1 mag), (ii) carbon rich spectra showing a lack of evidence for H and 13C, and (iii) the mid-infrared excess observed in their SEDs. Four of the candidates, ASAS 1919091554.4 (V1942 Sgr), ASAS 065113+0222.1, ASAS 1622325349.2, and ASAS 182658+0109.0 appear to be Galactic DYPers on the basis of (i) shallow, symmetric declines in their light curves occurring at irregular intervals, (ii) carbon rich spectra resembling carbon N stars showing 13C and weak or no H, and (iii) SEDs that show a single peak, but which are too broad to be explained via a single temperature blackbody. With the exception of ASAS 1705412650.1, all of the new candidates show evidence for periodic variability near maximum light. We incorporate the newly confirmed RCB stars and DYPers into the training set to identify six new candidates as likely RCB stars.
Our effort has increased the number of known Galactic DYPers from two to six. While the sample size is small, it appears that DYPers have pulsations with period days at maximum light, which is longer than the typical timescale for pulsation in RCB stars (see also Alcock et al. 2001). Each of the new RCB stars and DYPers is bright, 12 mag, which will enable high-resolution spectroscopy for future studies of the detailed abundances of these stars. This is particularly important in the case of the four new DYPers, as DY Per itself is the only member of the class which has been observed at high resolution to confirm the lack of H absorption in the spectrum (Keenan & Barnbaum, 1997; Začs et al., 2007). If these stars are shown to be H deficient, it would be strong evidence that DYPers are the cool (3500 K) analogs to RCB stars.
We view the results presented herein as one culmination of a broader effort to extract novel science from the time-domain survey data deluge. Earlier work focused on determining the most suitable ML frameworks for classification and subsequent classification efficiency (see Bloom & Richards 2011 for review). While production of ML-based catalogs (e.g., ACVS; Pojmański 2000) have been the norm for over a decade, we know of no concerted effort to validate the predictions of those catalogs. Now having a probabilistic catalog of variable sources (Richards et al., 2012b) to work with, we can select our demographic priors on classes of interest and also decide just how many false-positives we are willing to tolerate in the name of improved efficiency. In the case of the construction of a new set of very common stars (e.g., RR Lyrae catalog), we might be willing to tolerate a reduced discovery efficiency to preserve a high level of purity. Management of the available resources to follow-up the statements made in a probabilistic catalog becomes the next challenge. We were obviously most interested in finding new exemplars of two rare classes and thus tolerated a high impurity. In the discovery and characterization of several bright RCB stars and DYPers, the payoff of the efficient use of follow-up resources enabled by probabilistic classification is evident.
The classification taxonomy of variable stars clearly conflates phenomenology (e.g., “periodic”) within a physical understanding (“pulsating”) of the origin of what is observed. And while phenomenologically based mining around an envelope of class prototypes can turn up new class members, we have shown that the diversity of RCB stars and DYPers demands an expanded approach to discovery. We speculate that the richness and connections of the feature set in the ML search may be also capturing some of the phenomenological manifestations of the underlying physics, however nuanced, that we cannot (yet) express.
References
- Abia & Isern (1997) Abia, C., & Isern, J. 1997, MNRAS, 289, L11
- Alcock et al. (2001) Alcock, C., Allsman, R. A., Alves, D. R., et al. 2001, ApJ, 554, 298
- Alksnis (1994) Alksnis, A. 1994, Baltic Astronomy, 3, 410
- Alksnis et al. (2001) Alksnis, A., Balklavs, A., Dzervitis, U., et al. 2001, Baltic Astronomy, 10, 1
- Barnbaum et al. (1996) Barnbaum, C., Stone, R. P. S., & Keenan, P. C. 1996, ApJS, 105, 419
- Bloom & Richards (2011) Bloom, J. S., & Richards, J. W. 2011, ArXiv e-prints, arXiv:1104.3142 [astro-ph.IM]
- Breiman (2001) Breiman, L. 2001, Machine learning, 45, 5
- Brewer et al. (2009) Brewer, J. M., Bloom, J. S., Kennedy, R., & Starr, D. L. 2009, in Astronomical Society of the Pacific Conference Series, Vol. 411, Astronomical Data Analysis Software and Systems XVIII, ed. D. A. Bohlender, D. Durand, & P. Dowler, 357
- Butler & Bloom (2011) Butler, N. R., & Bloom, J. S. 2001, AJ, 141, 93
- Clarke et al. (2005) Clarke, A. J., Oudmaijer, R. D., & Lumsden, S. L. 2005, MNRAS, 363, 1111
- Clayton (1996) Clayton, G. C. 1996, PASP, 108, 225
- Clayton et al. (2007) Clayton, G. C., Geballe, T. R., Herwig, F., Fryer, C., & Asplund, M. 2007, ApJ, 662, 1220
- Clayton et al. (2002) Clayton, G. C., Hammond, D., Lawless, J., et al. 2002, PASP, 114, 846
- Clayton et al. (2006) Clayton, G. C., Kerber, F., Pirzkal, N., et al. 2006, ApJ, 646, L69
- Clayton et al. (2009) Clayton, G. C., Kilkenny, D., Wils, P., & Welch, D. L. 2009, PASP, 121, 461
- Clayton et al. (2011) Clayton, G. C., Sugerman, B. E. K., Stanford, S. A., et al. 2011, ApJ, 743, 44
- Cohen et al. (2003) Cohen, M., Wheaton, W. A., & Megeath, S. T. 2003, AJ, 126, 1090
- Cutri et al. (2003) Cutri, R. M., Skrutskie, M. F., van Dyk, S., et al. 2003, 2MASS All Sky Catalog of point sources., ed. Cutri, R. M., Skrutskie, M. F., van Dyk, S., et al.
- Cutri et al. (2011) Cutri, R. M., Wright, E. L., Conrow, T., et al. 2011, Explanatory Supplement to the WISE Preliminary Data Release Products, Tech. rep.
- Debosscher et al. (2007) Debosscher, J., Sarro, L. M., Aerts, C., et al. 2007, A&A, 475, 1159
- Dubath et al. (2011) Dubath, P., Rimoldini, L., Süveges, M., et al. 2011, MNRAS, 414, 2602
- Egan & Leung (1991) Egan, M. P., & Leung, C. M. 1991, ApJ, 383, 314
- Epchtein et al. (1994) Epchtein, N., de Batz, B., Copet, E., et al. 1994, Ap&SS, 217, 3
- Epchtein et al. (1999) Epchtein, N., Deul, E., Derriere, S., et al. 1999, A&A, 349, 236
- Feast (1997) Feast, M. W. 1997, MNRAS, 285, 339
- Filippenko (1982) Filippenko, A. V. 1982, PASP, 94, 715
- Fukugita et al. (1996) Fukugita, M., Ichikawa, T., Gunn, J. E., et al. 1996, AJ, 111, 1748
- Hastie et al. (2009) Hastie, T., Tibshirani, R., & Friedman, J. 2009, The Elements of Statistical Learning: Data Mining, Inference, and Prediction, Second Edition, 2nd edn., Springer Series in Statistics (Springer)
- Iben et al. (1996) Iben, Jr., I., Tutukov, A. V., & Yungelson, L. R. 1996, ApJ, 456, 750
- Ivezic et al. (2008) Ivezic, Z., Tyson, J. A., Acosta, E., et al. 2008, ArXiv e-prints, arXiv:0805.2366
- Keenan & Barnbaum (1997) Keenan, P. C., & Barnbaum, C. 1997, PASP, 109, 969
- Kijbunchoo et al. (2011) Kijbunchoo, N., Clayton, G. C., Vieux, T. C., et al. 2011, PASP, 123, 1149
- Kilkenny & Marang (1989) Kilkenny, D., & Marang, F. 1989, MNRAS, 238, 1P
- Kukarkin et al. (1971) Kukarkin, B. V., Kholopov, P. N., Pskovsky, Y. P., et al. 1971, in General Catalogue of Variable Stars, 3rd ed. (1971), 0
- Kwok et al. (1997) Kwok, S., Volk, K., & Bidelman, W. P. 1997, ApJS, 112, 557
- Lawson & Cottrell (1990) Lawson, W. A., & Cottrell, P. L. 1990, The Observatory, 110, 132
- Lawson et al. (1990) Lawson, W. A., Cottrell, P. L., Kilmartin, P. M., & Gilmore, A. C. 1990, MNRAS, 247, 91
- Libert et al. (2010) Libert, Y., Gérard, E., Thum, C., et al. 2010, A&A, 510, A14
- Lomb (1976) Lomb, N. R. 1976, Ap&SS, 39, 447
- Luyten (1932) Luyten, W. J. 1932, Astronomische Nachrichten, 246, 437
- Matheson et al. (2000) Matheson, T., Filippenko, A. V., Ho, L. C., Barth, A. J., & Leonard, D. C. 2000, AJ, 120, 1499
- Mill et al. (1994) Mill, J. D., O’Neil, R. R., Price, S., et al. 1994, Journal of Spacecraft and Rockets, 31, 900
- Miller & Stone (1993) Miller, J. S., & Stone, R. P. S. 1993, The Kast Double Spectrograph, Lick Observatory Technical Reports 66, University of California
- Monet et al. (2003) Monet, D. G., Levine, S. E., Canzian, B., et al. 2003, AJ, 125, 984
- Murakami et al. (2007) Murakami, H., Baba, H., Barthel, P., et al. 2007, PASJ, 59, 369
- Nelemans et al. (2001) Nelemans, G., Yungelson, L. R., Portegies Zwart, S. F., & Verbunt, F. 2001, A&A, 365, 491
- Neugebauer et al. (1984) Neugebauer, G., Habing, H. J., van Duinen, R., et al. 1984, ApJ, 278, L1
- Ochsenbein et al. (2000) Ochsenbein, F., Bauer, P., & Marcout, J. 2000, A&AS, 143, 23
- Oke et al. (1995) Oke, J. B., Cohen, J. G., Carr, M., et al. 1995, PASP, 107, 375
- Pandey et al. (2008) Pandey, G., Lambert, D. L., & Rao, N. K. 2008, ApJ, 674, 1068
- Perryman et al. (1997) Perryman, M. A. C., Lindegren, L., Kovalevsky, J., et al. 1997, A&A, 323, L49
- Pojmański (1997) Pojmański, G. 1997, Acta Astron., 47, 467
- Pojmański (2000) —. 2000, Acta Astron., 50, 177
- Pojmański (2001) Pojmański, G. 2001, in Astronomical Society of the Pacific Conference Series, Vol. 246, IAU Colloq. 183: Small Telescope Astronomy on Global Scales, ed. B. Paczynski, W.-P. Chen, & C. Lemme, 53
- Pojmański (2002) —. 2002, Acta Astron., 52, 397
- Price et al. (2010) Price, S. D., Smith, B. J., Kuchar, T. A., Mizuno, D. R., & Kraemer, K. E. 2010, ApJS, 190, 203
- Richards et al. (2011) Richards, J. W., Starr, D. L., Butler, N. R., et al. 2011, ApJ, 733, 10
- Richards et al. (2012a) Richards, J. W., Starr, D. L., Brink, H., et al. 2012a, ApJ, 744, 192
- Richards et al. (2012b) Richards, J. W., Starr, D. L., Miller, A. M., et al. 2012b, ArXiv e-prints, arXiv:1204.4180 [astro-ph.CO]
- Samus et al. (2008) Samus, N. N., Durlevich, O. V., & et al. 2008, VizieR Online Data Catalog, 1, 2025
- Scargle (1982) Scargle, J. D. 1982, ApJ, 263, 835
- Sesar et al. (2006) Sesar, B., Svilković, D., Ivezić, Ž., et al. 2006, AJ, 131, 2801
- Silverman et al. (2012) Silverman, J. M., Foley, R. J., Filippenko, A. V., et al. 2012, ArXiv e-prints, arXiv:1202.2128 [astro-ph.CO]
- Skrutskie et al. (2006) Skrutskie, M. F., Cutri, R. M., Stiening, R., et al. 2006, AJ, 131, 1163
- Soszyński et al. (2009) Soszyński, I., Udalski, A., Szymański, M. K., et al. 2009, Acta Astron., 59, 335
- Subasavage et al. (2010) Subasavage, J. P., Bailyn, C. D., Smith, R. C., et al. 2010, in Society of Photo-Optical Instrumentation Engineers (SPIE) Conference Series, Vol. 7737, Society of Photo-Optical Instrumentation Engineers (SPIE) Conference Series
- Swope (1928) Swope, H. H. 1928, Harvard College Observatory Bulletin, 857, 1
- Tisserand et al. (2004) Tisserand, P., Marquette, J. B., Beaulieu, J. P., et al. 2004, A&A, 424, 245
- Tisserand et al. (2008) Tisserand, P., Marquette, J. B., Wood, P. R., et al. 2008, A&A, 481, 673
- Tisserand et al. (2009) Tisserand, P., Wood, P. R., Marquette, J. B., et al. 2009, A&A, 501, 985
- Tisserand et al. (2011) Tisserand, P., Wyrzykowski, L., Wood, P. R., et al. 2011, A&A, 529, A118
- Tisserand (2012) Tisserand, P. 2012, A&A, 539, A51
- Wallerstein & Knapp (1998) Wallerstein, G., & Knapp, G. R. 1998, ARA&A, 36, 369
- Wright et al. (2010) Wright, E. L., Eisenhardt, P. R. M., Mainzer, A. K., et al. 2010, AJ, 140, 1868
- Young et al. (1993) Young, K., Phillips, T. G., & Knapp, G. R. 1993, ApJS, 86, 517
- Zaniewski et al. (2005) Zaniewski, A., Clayton, G. C., Welch, D. L., et al. 2005, AJ, 130, 2293
- Začs et al. (2007) Začs, L., Mondal, S., Chen, W. P., et al. 2007, A&A, 472, 247
- Zechmeister & Kürster (2009) Zechmeister, M., & Kürster, M. 2009, A&A, 496, 577