Dust-to-Gas Ratio in the Extremely Metal Poor Galaxy I Zw 18
Abstract
The blue compact dwarf galaxy I Zw 18 is one of the most metal poor systems known in the local Universe (12 + log(O/H) 7.17). In this work we study I Zw 18 using data from Spitzer, Herschel Space Telescope and IRAM Plateau de Bure Interferometer. Our data set includes the most sensitive maps of I Zw 18, to date, in both, the far infrared and the CO transition. We use dust emission models to derive a dust mass upper limit of only M M⊙ ( limit). This upper limit is driven by the non-detection at 160 m, and it is a factor of times smaller than previous estimates (depending upon the model used). We also estimate an upper limit to the total dust-to-gas mass ratio of MDust/M. If a linear correlation between the dust-to-gas mass ratio and metallicity (measure as O/H) were to hold, we would expect a ratio of 3.9. We also show that the infrared SED is similar to that of starbursting systems.
Subject headings:
galaxies: dwarf — galaxies: ISM —galaxies: individual(I Zw 18)1. Introduction
The link between dust-to-gas mass ratio (DGR) and heavy element abundance (metallicity) in galaxies remains an open issue (e.g, Lisenfeld & Ferrara, 1998; Edmunds, 2001; Hunt et al., 2005). Specifically, in very low metallicity systems () it is unclear how the DGR scales with metallicity. Models considering dust destruction by supernovae (Hirashita et al., 2002) or mass outflows from the galaxy (Lisenfeld & Ferrara, 1998) predict a nonlinear relation. On the other hand, if the fraction of metals incorporated in the dust is constant (James et al., 2002), we expect a linear relation between DGR and metallicity, in a sense that the ratio decreases as metallicity decreases. Measurements of DGRs over a range of metallicity are necessary to better constrain this relationship.
The blue compact dwarf galaxy I Zw 18 has one of the lowest nebular metallicities measured to date. Skillman & Kennicutt (1993) measure an oxygen abundance of 12+log(O/H) = 7.17. This is 3.2% of the solar abundance (using the scale of Asplund et al. 2009). Most local universe galaxies have 12+log(O/H) (e.g., Moustakas et al., 2010, for SINGS), and the Milky Way has 12+log(O/H) (Baumgartner & Mushotzky, 2006). I Zw 18 therefore represents the extreme low end of the metallicity range in the local universe and is thus a key datum for understanding the relationship between DGR and metallicity.
The dust mass of I Zw 18 is poorly known. Typical galaxies of similar morphology (blue compact dwarfs) have dust masses that range between 10 M⊙, with DGR ranging between (Lisenfeld & Ferrara, 1998). Using H/H flux ratios as a dust tracer, Cannon et al. (2002) find a total dust mass for I Zw 18 of M⊙111We scale Cannon et al. (2002) and Engelbracht et al. (2008) result by a factor of (18.2/12.6)2 and Galametz et al. (2011) result by a factor of (18.2/13)2 to account for the differences in assumed distances. We note that our final result, the DGR, is distance independent. by assuming a linear scaling between DGR and metallicity (as measured by O/H). Engelbracht et al. (2008), using Spitzer data limited by a non-detection at 160 m, measure an upper limit for the dust mass of M⊙. A more recent study of a large sample by Galametz et al. (2011) uses previously published Spitzer and SCUBA data to constrain the dust mass of I Zw 18 to be M⊙ and the DGR to .
I Zw 18 contains intense radiation fields stemming from active star formation. It therefore provides a nearby testing ground to probe the physics of distant primeval sources. Previous studies using Spitzer (Engelbracht et al., 2008; Wu et al., 2007) show that its continuum emission from 15 to 70 m has a slope characteristic of a starburst galaxy of solar abundance. Moreover, its mid-infrared spectrum from 5 to 36 m shows no detectable emission from polycyclic aromatic hydrocarbons (PAHs). Such low abundance of PAHs is likely the consequence of a high radiation field in combination with the low metallicity of the source.
In this paper we estimate the DGR for I Zw 18. We use previously unpublished Spitzer Space Telescope and archival Herschel Space Observatory222Herschel is an ESA space observatory with science instruments provided by European-led Principal Investigator consortia and with important participation from NASA. continuum observations, combined with dust emission models and a gas mass (van Zee et al., 1998) to constrain the radiation field intensity, temperature, dust mass and DGR in I Zw 18. Throughout this paper we assume a distance of 18.2 Mpc (Aloisi et al., 2007). Revisions to this distance will affect our dust and gas masses, but not the DGR.
2. Methods
2.1. Observations
We use a variety of data from several different facilities to map the far infrared, sub millimeter, millimeter and radio wave emission of I Zw 18. Therefore our data set uses the following observatories and instruments: Spitzer Multiband Imaging Spectrometer (MIPS, Rieke et al. 2004); Herschel Photodetector Array Camera and Spectrometer (PACS, Poglitsch et al. 2010); Herschel Spectral and Photometric Imaging Receiver (SPIRE, Griffin et al. 2010); IRAM Plateau de Bure Interferometer (PdBI) and Very Large Array (VLA). In this section we will briefly describe new observations.
Spitzer: We observed I Zw 18 at 70 and 160 m using MIPS in photometry mode as part of a cycle 5 proposal (P.I. A. Bolatto, AOR: 22369536). The total observation time was 8 hours. The reduction of these images very closely follows the procedure described in Gordon et al. (2007) and Stansberry et al. (2007) for the 70 and 160 m map respectively.
Herschel/PACS: We use archival 70 and 160 m observations from Herschel . The observations were taken with PACS using the Large Scan Map mode as part of the Herschel Guaranteed Time Key Program, Dwarf Galaxy Survey (P.I. S. Madden, obs. ID: 1342187135/36). The scan maps were taken at 90∘ angles from one another at the medium scan speed ( s-1) and then combined together in order to reduce the noise caused by streaking along the scan direction. The scan leg length is and the total on source time for the combined images was 192 s.
Unlike Spitzer data, the methods to reduce PACS data are still evolving significantly. Therefore, we reduce the data in two separate ways. We first use Herschel Interactive Processing Environment (HIPE) v4.2 with the standard pipeline scripts. We also process the data up to level 1 in HIPE v7. We use the standard pipeline, which includes pixel flagging, flux density conversion, and sky coordinate association for each pixel of the detector. At this stage, the PACS timelines are still affected by noise and baseline drifts. In order to subtract the baseline, remove glitches, and project the timelines on the final map, we applied the scanamorphos algorithm (Roussel, 2012) to the level-1 PACS timelines.
Herschel/SPIRE: We use archival Herschel Spectral and Photometric Imaging Receiver (SPIRE; Griffin et al. 2010) photometric observations at 250, 350, and 500 . Observations were made in the large map mode with the nominal scan speed of 30 arcsec s-1 and the cross-scanning method as part of Herschel Science Demonstration Phase (PI: S. Madden; obs. ID 1342188663). Data reprocessing was carried out in HIPE using the standard large map pipeline with the latest SPIRE calibration tree available333We used HIPE 8.1 and the SPIRE calibration tree v. 8.1. which includes deglitching the timeline data, flux calibration and various corrections. After removal of a linear baseline, images were made using the standard naive mapper. The final maps are in units Jy beam-1 with pixel scales of 6, 10 and 14 arcsec at 250, 350 and 500 m, respectively as described in the SPIRE Data Reduction Guide.
PdBI: We present new observations of the CO transition in I Zw 18 using the IRAM Plateau de Bure Interferometer as project t027 (P.I. A. Leroy). The data were observed on 24, 27, and 28 September 2009 using the ”5Dq” configuration, meaning that 5 telescopes were operational and that the array was in a compact configuration. They data is calibrated in the standard way in December 2009 using the PdBI pipeline implemented in the CLIC and MAPPING packages of GILDAS. The effective time on source was 12.5 hours after flagging during the pipeline run. The effective bandwidth was MHz, or about 2200 km s-1 with native resolution MHz (6.5 km s-1). We do not detect CO emission. At 26 km s-1 velocity resolution we achieved an RMS noise of 1.26 mJy beam-1, implying a flux upper limit for a point source of 0.131 Jy km s-1.
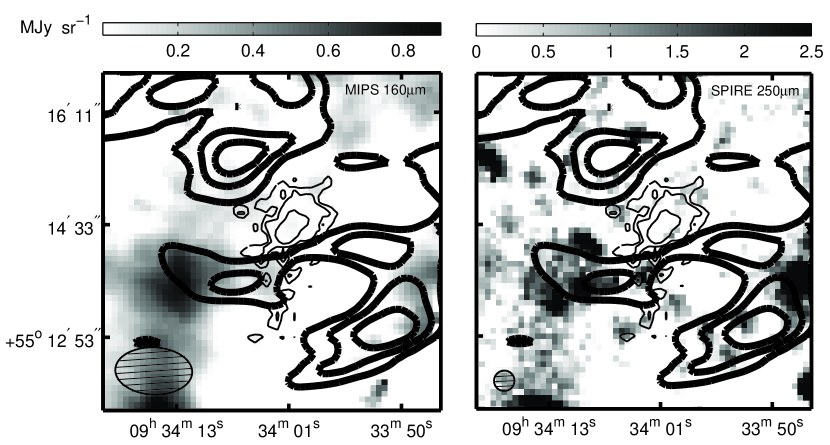
VLA: The observations used to construct the HI map are described in van Zee et al. (1998). We obtained two hours of Rapid Response 21 cm VLA observations (project 08B-246; P.I. A. Bolatto) to evaluate the Galactic foreground contribution. This contribution can be estimated by measuring the HI column density toward I Zw 18 and convert it to dust emission using typical high-latitude Galactic ratios (e.g, Boulanger et al., 1996). The observations were obtained during the move between CnD and D configuration with a synthesized beam size of , and a native resolution of 6.1 kHz (1.3 km s-1). Data was reduced in AIPS using the standard procedure and calibrations, and care was taken to remove the baselines affected by the frequency aliasing problems due to the VLA-JVLA transition. At 10.3 km s-1 velocity resolution we achieved an RMS noise of 1.1 mJy beam-1, implying an HI column density of N cm-2. Galactic neutral hydrogen emission was observed in the central 30 km s-1 of the passband. Nonetheless, even after spatially filtering the 160 m MIPS map to approximately match the coverage of the VLA the correlation between the high resolution HI column density and the 160 m surface brightness remained extremely low (Fig. 2) , showing that most of the emission present in the 160 and 250 m images is not due to the high-latitude Galactic foreground.
2.2. Photometry
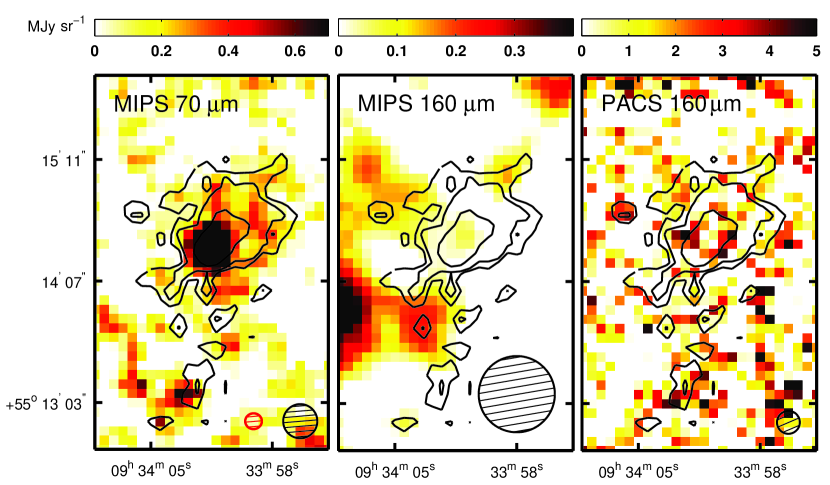
In Fig. 1 we present the Spitzer MIPS 70 and 160 m maps and the Herschel PACS 160 m image for I Zw 18. Overlaid on each image is the HI column density distribution observed by van Zee et al. (1998). The HI contours correspond to 0.7, 1.4 and 5 1020 cm-2 enclosing 98, 96 and 78% of the total flux at 70 m. We use the MIPS 70 m map over the PACS 70 m because it has a much better surface brightness sensitivity ( versus MJy sr-1), yielding a better signal to noise. The bulk of the 70 m emission coincides with the HI column density maximum. This peak also coincides with the location of active star forming regions observed by Cannon et al. (2002) using the Hubble Space Telescope (HST). The diffuse component at 70 m extends preferentially 3 kpc north-west from the peak. We subtract the background emission measured in a region free of sources. We integrate the flux using a circular aperture with radius of 45” centered at the peak of the 70 m emission and applying an aperture correction factor of 1.13 (determined by integrating over the point spread function and compatible with those in the MIPS Instrument Handbook). The calibration error on Spitzer is about 5% at 70m. We estimate a photometry error of 1.7 mJy by adding in quadrature the calibration uncertainty and the background noise We measure a total flux density of 33.61.7 mJy at 70 m. Our flux value is consistent with the 70 m flux measured by Engelbracht et al. (2008) of 34.94.79 mJy.
The Spitzer 160 m map is confusion-limited. The bulk of the emission is associated with sources outside the HI emitting region of I Zw 18. Although the Galactic latitude of I Zw 18 is 44∘, it could be possible that a significant source of confusion were Galactic cirrus. We use the VLA HI observations to explore this possibility. Fig. 2 shows the MIPS 160 m and the SPIRE 250 m map of a 55 arcmin field around I Zw 18. The thick lines represent the HI foreground emission from VLA. The thin lines represent the HI emission of I Zw 18. It is clear from visual inspection that the maxima of the HI foreground and the 160 m and 250 m emission are not coincident. We find a Pearson correlation coefficient close to zero. In most of the Spitzer confusion-limited images at 160 m the confusion is mainly due to faint unresolved background sources (Dole et al., 2004). The bulk of the 160 m emission, located south-east of our object, fragments into at least three point sources in the 250 m map, which has finer spatial resolution. The 160 m peak also coincides with several background galaxies in deep B and R-band images (S. Janowiecki, private communication). The difference between the 160 and 250 m maps is consistent with what one would observe if the peak of the emission at a 160 m is associated with background galaxies.
The background contamination and the absence of correlation between the 160/250 m emission and the HI foreground emission makes it impossible to recover the flux associated with I Zw 18. Thus, we use an annular sector around the galaxy to measure a one-sigma surface brightness sensitivity of 0.18 mJy sr-1 that includes the effects of confusion. We estimate the flux upper limit multiplying this value by the area associated with the 1.4 atoms cm-2 HI contour that encloses 96 of the 70 m flux and 62 of the HI mass. To find the aperture correction factor associated to this area, we can approximate the contour using a circular aperture of 48″ radius. This corresponds to an aperture correction factor of 1.6 at 160 m. After applying the aperture correction factor, we obtain a corresponding 3 flux upper limit of 40.5 mJy. This new upper limit is a factor of 2 lower than the previous upper limit published by Engelbracht et al. (2008).
The Herschel PACS image at 160 m also fails to detect I Zw 18. In this case, however, the image is not confusion-limited. The surface brightness sensitivity is 1.8 MJy sr-1. If we assume that the emission from I Zw 18 is compact on scales, the corresponding 3 flux upper limit integrating over the beam and applying an aperture correction factor of 1.32 is 27.2 mJy.
We will work with the PACS 160 m flux upper limit of 27.2 mJy for the rest of the paper. However, the upper limit measured from the PACS data relies upon the assumption that the source is compact. If the 160 m emission is significantly extended over scales larger than (1 kpc), it may be more appropriate to use the MIPS 160 m upper limit of 40.5 mJy.
Finally, the SPIRE maps at 250, 350 and 500 m show no detection of I Zw 18. From these images we measure a surface brightness sensitivity using an annular sector around the source. We then apply aperture corrections and point source color corrections assuming ( in ) described in the SPIRE Photometry Cookbook (Bendo, G. J. and the SPIRE-ICC, 2011) We measure 3 flux upper limits of 22.2, 23.9 and 25.4 mJy at 250, 350 and 500 m, respectively.
3. Results
3.1. Dust Mass
We use two methods to estimate the dust mass of I Zw 18. In the first, we follow the procedure outlined by Hildebrand (1983), assuming an idealized graybody source with a single temperature. In the second one we use the Draine & Li (2007) (DL07) model. The main difference between the DL07 model and the idealized graybody is that DL07 assumes a grain size distribution that reproduces the observed wavelength-dependence extinction in the Milky Way, and consequently a distribution of temperatures. Giving the extreme nature of I Zw 18, it is not clear that either model is exactly applicable. Nonetheless, we used them so we can make a consistent comparison to larger samples of galaxies.
3.1.1 Modified Blackbody Model
For an idealized cloud, the dust mass is estimated by fitting its far infrared spectrum as the product of a blackbody spectrum () and a mass absorption coefficient (). The absorption coefficient varies with wavelength as the negative power of the grain emissivity index (, where represents the emissivity index). Then, for a cloud that is optically thick to starlight and optically thin to far infrared emission, the dust mass MDust is given by the following expression:
| (1) |
where D is the distance to the galaxy, Fλ is the observed flux and is the blackbody intensity. The flux at any point on a graybody spectrum is F, with independent of wavelength. Therefore, we can solve for the color temperature (T70/160) using the ratio F70 / F160.
Measured values for at 250 m () span the range cm2 g-1(Alton et al., 2004), and commonly used values for are depending on the environment. For this work we adopt 9.5 cm2 g-1 and ; these are commonly used values for low metallicity galaxies(e.g. Leroy et al., 2007a). Using or 2 changes our dust mass limits by .
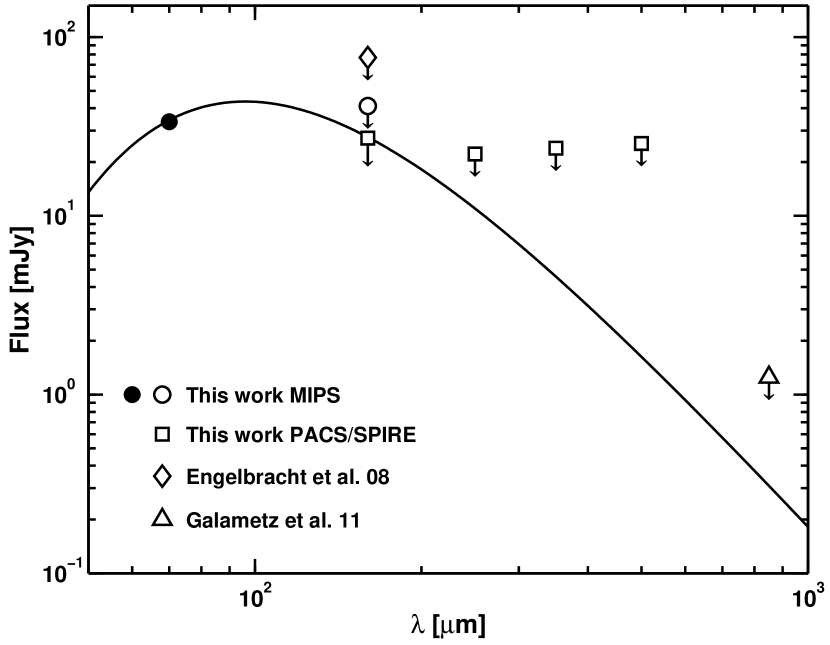
Fig. 3 shows the spectral energy distribution (SED) of I Zw 18. The source is only detected at 70 m. At longer wavelengths each point corresponds to a flux upper limits. Among these limits, the 160 m upper limit represents the strongest constraint on the I Zw 18 SED. Thus, based on the 70 and 160 m emission, the modified blackbody spectrum model constrains the dust temperature to be T K. This translates into a predicted 850 m flux of 0.28 mJy, compatible with the observed upper limit of 1.25 mJy (Galametz et al., 2011). Combining our temperature lower limit with the 70 m flux, Eq. 1 yields a dust mass of M M⊙. If we use the MIPS 160 m upper limit instead of the PACS upper limit, we measure a temperature limit T K and a dust mass a factor of 2 higher, i.e., M M⊙
3.1.2 Draine & Li Model
For a detailed description we refer to DL07 and Draine et al. (2007). Essentially, DL07 models characterize the dust as a mixture of carbonaceous and amorphous silicate grains with size distributions chosen to match the observed extinction in the Milky Way. To characterize the intensity of the radiation that is heating the dust, the model adopts the spectrum of the local interstellar radiation field (this may not be a good approximation for I Zw 18, a starburst system characterized by high intensity radiation fields and low metallicity). In DL07, most dust is heated by the interstellar radiation field, and a small fraction is heated by stronger radiation fields associated with star formation.
| Object | MDust (M⊙) | Umin | (%) | TUmin (K) | ||
|---|---|---|---|---|---|---|
| I Zw 18 | 21.1 | 13.1 | 48.9 | 24.4 | ||
| Mrk 33 | 4.0 | 14.3 | 11.8 | 47.6 | 21.4 | |
| Tol 89 | 2.0 | 3.6 | 6.4 | 33.2 | 19.1 | |
| NGC 3049 | 3.0 | 5.1 | 6.1 | 32.6 | 20.4 | |
| SINGSaafootnotemark: | 1.5 | 1.5 | 1.7 | 0.9 | 7.8 | 18.2 |
Median values for 48 SINGS galaxies (Table 5, Draine et al., 2007)
We caution the reader that estimating dust masses based on broadband infrared fluxes, as we do here, is a poorly constrained technique; there are very few data points compared to the number of parameters in the model. The DL07 model uses five parameters to characterize the emission from dust in galaxies: , , , and . The dust mass is represented by . represents the interstellar radiation field heating the diffuse ISM, and represents the upper limit on the interstellar radiation field. The starlight heating the dust is described using the dimensionless parameter , that by definition is always between and . The value is the local interstellar radiation in the Milky Way. The parameter represents the fraction of gas that is exposed to strong radiation fields with intensities in the range . Finally, characterizes the distribution of starlight intensities. In practice we fix two of these parameters, and . We adopt the values set by Draine & Li (2007) of and . Therefore three parameters are free in the model (, , and ). We remind the reader that we constrain this model with only four broadband fluxes, at 8, 24, 70 and 160 m. We can also use the returned values of these parameters to calculate a temperature for the majority of the dust grains (), the fraction of dust luminosity that originates in photon dominated regions (), and the dust-weighted mean starlight intensity ().
Muñoz-Mateos et al. (2009) derived empirical fits relating a grid of DL07 emission model outputs to the Spitzer fluxes. In particular, the DL07 parameters , , , and can all be derive using measurements at 8, 24, 70 and 160 m. We can calculate using and according to Eq. (33) in DL07. For the I Zw 18 fluxes at 8 and 24 m we used the values measured by Engelbracht et al. (2008) of 0.47 and 6.28 mJy respectively. The agreement between the dust mass derived using the empirical fits and DL07 models is very good, with a scatter of about 9% and an offset of . The DL07 dust masses are strongly dependent on R, with M R. R70 is sensitive to the temperature of the largest grains dominating the FIR emission, and any new constraint or detection at 160 m will strongly affect the resulting dust mass. Essentially, the smaller the 160 m flux, the hotter the temperature and thus the less dust is needed to produce the observed 70 m emission.
The derived dust properties for I Zw 18 are summarized in Table 1. Median values for 48 SINGS galaxies analyzed by Draine et al. (2007) and three starburst system out of the same sample are included for comparison. The lower limits obtained for , , and in I Zw 18 are high compared to the mean values in the SINGS sample (Draine et al., 2007). The high radiation intensity environment of I Zw 18 is comparable to starbursting systems like Mrk 33, Tol 89 and NGC 3049, as also found by Wu et al. (2007). We find that the DL07 model yields a mass upper limit of M 1.1 104 M⊙. Just like the modified blackbody case, if we use the MIPS 160 m upper limit instead of the PACS upper limit, we measure a dust mass a factor of 2 higher, i.e., M 2.6 104 M⊙.
3.2. Comparison of Dust Masses
The DL07 dust mass upper limit is a factor 3.5 larger than the dust mass estimated using the modified blackbody model. DL07 model treats dust emission as an ensemble of dust grains at different temperatures that includes larger masses of dust at colder temperatures than what is predicted by the single temperature fit. Therefore, it is not surprising that this model generates a higher dust mass than the modified blackbody model. However, the fact that these two measurements are not extremely different increases our confidence in the dust mass limit, which we conservatively take to be that resulting from the DL07 model.
It is interesting to compare this result to other modeling efforts for I Zw 18 and low metallicity galaxies. In particular, Galametz et al. (2011) determine dust masses in a large sample of galaxies with literature data, using full spectral energy distribution modelling based on the Zubko et al. (2004) grain model. They find that the inclusion of submm-wave data tends to drive dusty galaxies toward lower dust masses, while for low metallicity galaxies the inclusion of submm-wave constraints yields higher dust mass predictions than those from far-infrared alone. By contrast Draine et al. (2007) found their masses to be robust to the inclusion of submm-wave data. This is in part driven by modeling choices, in particular the inclusion of a minimum radiation field or the interpretation of submm-wave excess (Israel et al., 2010; Bot et al., 2010) as caused by cold dust. The latter appears to be associated to low metallicities, and although recent studies suggest that it is not caused by cold dust (Galliano et al., 2011), it remains a large systematic uncertainty in dust mass determinations. Also note that for dwarf galaxies the SCUBA data included by Galametz et al. 2011 is much deeper than the data used by Draine et al. 2007. Observational biases and limitations have a non negligible impact on the interpretation of the observed trends in dust-to-gas ratio versus metallicity.
Galametz et al. (2011) use a 160 m flux upper limit of 76.8 mJy (Engelbracht et al., 2008). For submm-wave data they use a 850 m flux upper limit of 1.25 mJy (Galliano et al., 2008). They measure an upper limit to the dust mass of M⊙ scaled to our adopted distance. Our dust mass upper limit is an order of magnitude smaller than that of Galametz et al. (2011). Using the DL07 model and the data in Galametz et al. (2011) we would obtain an upper limit of M⊙. This is nearly equivalent to the dust mass Galametz et al. (2011) finds, highlighting the fact that the mass limits are likely reasonably robust to the choice of models. Therefore, our lower dust mass limit is due to the tighter flux limits at 160 m.
3.3. Gas Mass
The total HI mass of I Zw 18 is M⊙ (van Zee et al., 1998). The molecular content of I Zw 18, however, remains unknown since no CO emission has been detected. Our new upper limit on the CO luminosity of I Zw 18 is K km s-1 pc2 (4), which corresponds to M⊙ for a standard conversion factor ( (K km s-1 pc2)-1). Note that our luminosity is similar to that quoted by Leroy et al. (2007b) because we adopt here a larger distance (for matched smoothing and assumptions we improve the sensitivity of that study by a factor of 2). Using this Milky Way based conversion factor, MH2 is at most of the total gas mass.
There is no reason to expect that the Milky Way based conversion factor between CO luminosity and H2 mass applies to low metallicity galaxies like I Zw 18. In the Local Group, is a strong function of metallicity (Leroy et al., 2011). Genzel et al. (2012) derive a correlation between oxygen abundance and conversion factor, . Applying their formula to a galaxy with the metallicity of I Zw 18, we find a conversion factor M⊙ (K km s-1 pc2)-1. This factor is times larger than in a typical spiral galaxy. Using this conversion factor we calculate a molecular gas mass upper limit of M⊙. This is of the total gas mass.
There is some evidence that, at low metallicities, the star formation activity may be a better indicator of the molecular mass than the CO emission (Krumholz et al., 2011; Bolatto et al., 2011; Schruba et al., 2011). The H flux of I Zw 18 suggests a recent star formation rate (SFR) of M⊙ yr-1. In large star-forming galaxies, a typical H2-to-SFR ratio (H2 depletion time) is Gyr (Bigiel et al., 2011). The H2 mass corresponding to this amount of star formation in such a galaxy would thus be M⊙. Given the level at which star formation obviously dominates the morphology and ISM conditions in I Zw 18 we strongly suspect that this kind of equilibrium assumption very much overestimates the H2, which will have been dissociated or otherwise destroyed by the recent burst. Nonetheless, even in this limit the H2 only makes up of the integrated gas mass. The similarity with the results obtained from applying the Genzel et al. (2012) correlation is not surprising, since the underlying assumption is the same. Because of its uncertainty, we do not include the H2 correction in the following calculations.
3.4. Dust-to-Gas Mass Ratio and Metallicity
Draine et al. (2007) finds that the DGR changes significantly depending on whether the dust mass is compared to the total gas mass or only the gas mass enclosed in the aperture where the infrared emission is measured. For example, IC 2574 (a dwarf galaxy in the SINGS sample), only 19% of the HI gas mass is enclosed in the area where the infrared emission is detected (Walter et al., 2007). We take the point of view that these are two valid definitions of the DGR: global, or local where the dust emission is detected. Using the total HI mass from van Zee et al. (1998), we measure an upper limit for the global DGR . Using instead the HI mass enclosed in the area were we measure the 160 m flux upper limit (62% of the total HI mass), yields a local DGR .
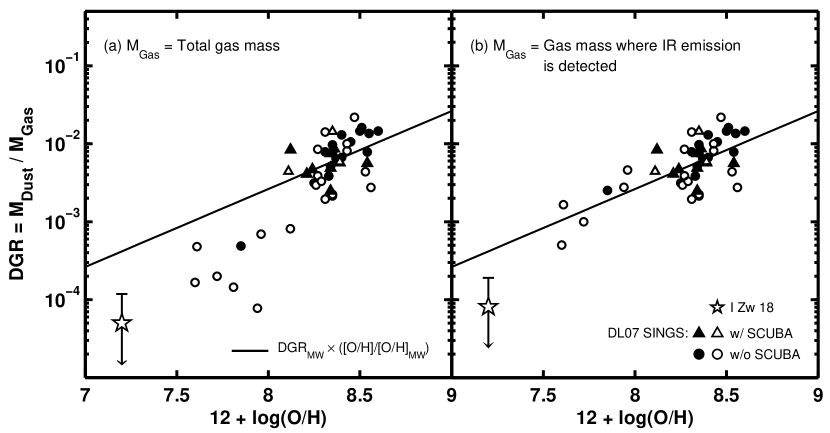
Figure 4 shows the DGR as a function of oxygen abundance for I Zw 18 and a subsample of SINGS galaxies. Open symbols indicate 3 upper limits. The solid line represents a linear scaling of the DGR with metallicity. This linear relation assumes that the abundances of all heavy elements are proportional to the oxygen abundance and that the same fraction of all heavy elements are in solid form as in the Milky Way (Draine et al., 2007). The I Zw 18 DGR upper limit is primarily driven by the upper limit in the dust mass, while in the SINGS galaxies the upper limits are due to lower limits in the gas mass (due to the non inclusion of H2). As we discussed in Section 3.1, we obtain different dust masses for I Zw 18 depending on the assumption we make about the distribution of the 160 m emission (point-like with PACS and extended with MIPS). The open star shows the DGR of I Zw 18 when we assume point-like emission, while the upper limit of the bar shows the DGR when we assume extended emission. For the SINGS galaxies, the dust and gas masses are from Draine et al. (2007) and the metallicities are from Moustakas et al. (2010). Note that Draine et al. (2007) computes molecular gas masses assuming a fixed factor of 4 1020 cm-2 (K km s-1)-1 following (Blitz et al., 2007). We show SINGS galaxies with and without measured SCUBA fluxes as triangles and circles respectively, as Draine et al. (2007) find that the dust mass estimates with and without SCUBA data can differ by a factor of 2.
The left panel of Figure 4 shows the global DGR, estimated using the total gas masses. The right panel shows how the DGR changes when estimating it locally in low metallicity systems, including I Zw 18, by using the gas mass enclosed in the region where the infrared emission is detected. For SINGS galaxies with metallicities 12 + log(O/H) 8.1, the total DGR seems to agree within a factor of 2 with a linear relationship between DGR and metallicity. Low metallicity galaxies do not seem to follow the same linear correlation that includes the Milky Way DGR. The I Zw 18 global DGR falls below the linear scaling by a factor of . The right panel of Figure 4 shows the local DGR. The DGRs of the SINGS low metallicity systems scale up and appear consistent with the linear relationship within a factor of 2, although most of the low metallicity points are only upper limits. For I Zw 18, however, the local DGR falls below the linear scaling by a factor of . Therefore, our dust mass limits for I Zw 18 suggest a breakdown of the linear relationship between DGR and metallicity at very low metallicities. Note further that, at least in terms of the global DGR, I Zw 18 seems to continue the trend found for other low metallicity galaxies.
We show in Fig. 4 that only one of the seven SINGS galaxies with 12 + log(O/H) 8.1 has a DGR that is not an upper limit. It may be possible that the local DGR of this system is higher than other low metallicity galaxies and the trend is really steeper than linear, as our result for I Zw 18 and other studies suggest (Lisenfeld & Ferrara, 1998; Muñoz-Mateos et al., 2009). Clearly more work is needed to determine, robustly, wether low metallicity galaxies do or do not follow the linear scaling shown in Fig. 4.
Note that the abundance of oxygen may not be the correct abundance to refer to. Indeed, the abundances of refractory elements that constitute the bulk of the dust such as carbon or silicon are likely more relevant to establishing the DGR. Garnett et al. (1999), for example, find a trend of increasing C/O with O/H for a sample of irregular and spiral galaxies observed with HST. This could suggest that the nonlinear trend of DGR with metallicity is really an artifact of using O/H as a proxy for metallicity, and the relation could become more nearly linear when plotted against C/H. Garnett et al. (1999) find a gas-phase abundance of C in I Zw 18 that is significantly higher than that predicted by the extrapolation of the observed C/O vs. O/H trend in low metallicity irregular galaxies. In fact, C/O in I Zw 18 is only 0.3 dex lower than Solar. This is barely enough to reconcile our limits on the local DGR with a linear trend with C/H, and probably not enough to explain our low global DGR, but it certainly goes in the right direction.
4. Conclusions
In this work we study I Zw 18 using data from Spitzer, Herschel Space Telescope and IRAM Plateau de Bure Interferometer. We reduce the flux upper limit at 160 m by a factor of 3 and the CO flux upper limit by a factor of 2 compared to previous measurements. Combining these observations with the dust emission model from Draine & Li (2007), we constrain the dust mass to be M . We note that any dust mass measurement relies on assumptions about the mass emissivity of dust grains in the interstellar medium, with the important associated systematic uncertainties. We find a global dust-to-gas mass ratio of MM, while the ratio measured in regions where the 70 m emission peaks is MM.
These measurements are suggestive that low metallicity galaxies do not follow the same linear relationship between metallicity and DGR as typical local spirals. At face value our DGR upper limit is inconsistent with the hypothesis that the fraction of heavy elements incorporated into dust is the same in high metallicity galaxies (such as the Milky Way) and in extremely low metallicity galaxies (such as I Zw 18). There are other scenarios, however, that can produce a break or non-linear power-law relationship between DGR and metallicity. For instance, models that include more detailed physical processes such as the production and destruction of dust by supernovae, removal of dust through outflows from galaxies, and dust production in the envelopes of stars (e.g, Lisenfeld & Ferrara, 1998; Edmunds, 2001; Hirashita et al., 2002) may yield non-linear relations. Much more work is needed with sensitive maps of low metallicity galaxies, like I Zw 18, to better understand the realtionship between DGR and metallicity.
References
- Aloisi et al. (2007) Aloisi, A., et al. 2007, ApJ, 667, L151
- Alton et al. (2004) Alton, P. B., Xilouris, E. M., Misiriotis, A., Dasyra, K. M., & Dumke, M. 2004, A&A, 425, 109
- Asplund et al. (2009) Asplund, M., Grevesse, N., Sauval, A. J., & Scott, P. 2009, ARA&A, 47, 481
- Baumgartner & Mushotzky (2006) Baumgartner, W. H., & Mushotzky, R. F. 2006, ApJ, 639, 929
- Bigiel et al. (2011) Bigiel, F., et al. 2011, ApJ, 730, L13
- Blitz et al. (2007) Blitz, L., Fukui, Y., Kawamura, A., Leroy, A., Mizuno, N., & Rosolowsky, E. 2007, Protostars and Planets V, 81
- Bolatto et al. (2011) Bolatto, A. D., et al. 2011, ApJ, 741, 12
- Bot et al. (2010) Bot, C., Ysard, N., Paradis, D., Bernard, J. P., Lagache, G., Israel, F. P., & Wall, W. F. 2010, A&A, 523, A20
- Boulanger et al. (1996) Boulanger, F., Abergel, A., Bernard, J.-P., Burton, W. B., Desert, F.-X., Hartmann, D., Lagache, G., & Puget, J.-L. 1996, A&A, 312, 256
- Cannon et al. (2002) Cannon, J. M., Skillman, E. D., Garnett, D. R., & Dufour, R. J. 2002, ApJ, 565, 931
- Dole et al. (2004) Dole, H., et al. 2004, ApJS, 154, 93
- Draine & Li (2007) Draine, B. T., & Li, A. 2007, ApJ, 657, 810
- Draine et al. (2007) Draine, B. T., et al. 2007, ApJ, 663, 866
- Edmunds (2001) Edmunds, M. G. 2001, MNRAS, 328, 223
- Engelbracht et al. (2008) Engelbracht, C. W., Rieke, G. H., Gordon, K. D., Smith, J., Werner, M. W., Moustakas, J., Willmer, C. N. A., & Vanzi, L. 2008, ApJ, 678, 804
- Galametz et al. (2011) Galametz, M., Madden, S. C., Galliano, F., Hony, S., Bendo, G. J., & Sauvage, M. 2011, A&A, 532, A56+
- Galliano et al. (2008) Galliano, F., Dwek, E., & Chanial, P. 2008, ApJ, 672, 214
- Galliano et al. (2011) Galliano, F., et al. 2011, A&A, 536, A88
- Garnett et al. (1999) Garnett, D. R., Shields, G. A., Peimbert, M., Torres-Peimbert, S., Skillman, E. D., Dufour, R. J., Terlevich, E., & Terlevich, R. J. 1999, ApJ, 513, 168
- Genzel et al. (2012) Genzel, R., et al. 2012, ApJ, 746, 69
- Gordon et al. (2007) Gordon, K. D., et al. 2007, PASP, 119, 1019
- Griffin et al. (2010) Griffin, M. J., et al. 2010, A&A, 518, L3
- Hildebrand (1983) Hildebrand, R. H. 1983, QJRAS, 24, 267
- Hirashita et al. (2002) Hirashita, H., Tajiri, Y. Y., & Kamaya, H. 2002, A&A, 388, 439
- Hunt et al. (2005) Hunt, L., Bianchi, S., & Maiolino, R. 2005, A&A, 434, 849
- Israel et al. (2010) Israel, F. P., Wall, W. F., Raban, D., Reach, W. T., Bot, C., Oonk, J. B. R., Ysard, N., & Bernard, J. P. 2010, A&A, 519, A67
- James et al. (2002) James, A., Dunne, L., Eales, S., & Edmunds, M. G. 2002, MNRAS, 335, 753
- Krumholz et al. (2011) Krumholz, M. R., Leroy, A. K., & McKee, C. F. 2011, ApJ, 731, 25
- Leroy et al. (2007a) Leroy, A., Bolatto, A., Stanimirovic, S., Mizuno, N., Israel, F., & Bot, C. 2007a, ApJ, 658, 1027
- Leroy et al. (2007b) Leroy, A., Cannon, J., Walter, F., Bolatto, A., & Weiss, A. 2007b, ApJ, 663, 990
- Leroy et al. (2011) Leroy, A. K., et al. 2011, ApJ, 737, 12
- Lisenfeld & Ferrara (1998) Lisenfeld, U., & Ferrara, A. 1998, ApJ, 496, 145
- Moustakas et al. (2010) Moustakas, J., Kennicutt, Jr., R. C., Tremonti, C. A., Dale, D. A., Smith, J., & Calzetti, D. 2010, ApJS, 190, 233
- Muñoz-Mateos et al. (2009) Muñoz-Mateos, J. C., et al. 2009, ApJ, 701, 1965
- Poglitsch et al. (2010) Poglitsch, A., et al. 2010, A&A, 518, L2+
- Rieke et al. (2004) Rieke, G. H., et al. 2004, ApJS, 154, 25
- Roussel (2012) Roussel, H. 2012, in prep.
- Schruba et al. (2011) Schruba, A., et al. 2011, AJ, 142, 37
- Skillman & Kennicutt (1993) Skillman, E. D., & Kennicutt, Jr., R. C. 1993, ApJ, 411, 655
- Stansberry et al. (2007) Stansberry, J. A., et al. 2007, PASP, 119, 1038
- van Zee et al. (1998) van Zee, L., Westpfahl, D., Haynes, M. P., & Salzer, J. J. 1998, AJ, 115, 1000
- Walter et al. (2007) Walter, F., et al. 2007, ApJ, 661, 102
- Wu et al. (2007) Wu, Y., et al. 2007, ApJ, 662, 952
- Zubko et al. (2004) Zubko, V., Dwek, E., & Arendt, R. G. 2004, ApJS, 152, 211