High-resolution optical imaging of the core of the globular cluster M15 with FastCam
Abstract
We present high-resolution -band imaging of the core of the globular cluster M15 obtained at the 2.5 m Nordic Optical Telescope with FastCam, a low readout noise L3CCD based instrument. Short exposure times (30 ms) were used to record 200000 images (512 x 512 pixels each) over a period of 2 hours 43 min. The lucky imaging technique was then applied to generate a final image of the cluster centre with FWHM and FoV. We obtained a catalogue of objects in this region with a limiting magnitude of . -band photometry and astrometry are reported for 1181 stars. This is the deepest -band observation of the M15 core at this spatial resolution. Simulations show that crowding is limiting the completeness of the catalogue. At shorter wavelengths, a similar number of objects has been reported using HST/WFPC observations of the same field. The cross-match with the available HST catalogues allowed us to produce colour-magnitude diagrams where we identify new Blue Straggler star candidates and previously known stars of this class.
keywords:
instrumentation: high angular resolution – techniques: photometric – binaries: close – stars: blue stragglers – globular clusters: individual: M15 – Hertzsprung–Russell and colour–magnitude diagrams1 Introduction
The cores of globular clusters contain a very dense stellar population reaching up to 106 stars pc-3. They are test laboratories for studying the dynamics in dense environments and provide crucial information on the evolution of the cluster. Encounters and direct collisions between core cluster stars are highly probable leading to a variety of exotic species of stellar objects such as close interacting binaries, pulsars, x-ray sources and Blue Stragglers (BS). The globular cluster cores are also potential hosts of intermediate mass black holes (McNamara et al. (2003)), which may be revealed by the dynamics of the stars in their very inner regions. Resolving the core stellar population is required to establish the existence and determine the mass of any central compact object. Studies of the stellar populations in the globular cluster most inner regions have been conducted in the optical using the Hubble Space Telescope (see e.g. Yanny et al. (1994), Guhathakurta et al. (1996)) and in the near infrared using Adaptive Optics systems in ground based telescopes (see e.g. Davidge & Courteau (1999)).
M15 is one of the oldest and most massive globular clusters with an unusually compact core and a high central velocity dispersion (McNamara et al. (2003)). This cluster is particularly suitable to investigate the presence of a massive central compact object. High-resolution observations of the M15 core have already been obtained by Yanny et al. (1994) with the HST/PC camera with the filters F336W, F555W and F785LP ( bands) and by Ferraro & Paresce (1993) using F140W, F220W and F342W filters and the HST/FOC camera. These early data were taken with aberrated optics and it was difficult to perform accurate photometry of the core stars. After post-repair HST took images of the core with the HST/WFPC2 with the filters F336W, F439W and F555W ( bands) (Guhathakurta et al. (1996)), and more data in the band were reported by McNamara et al. (2003). High resolution optical images using adaptive optics in the Canada-France-Hawaii Telescope have been reported by Gebhardt et al. (2000). Piotto et al. (2002) and van der Marel et al. (2002) also performed independent photometry of the data taken by Guhathakurta et al. (1996) and in particular, the catalogue by Piotto et al. (2002) has been used to study Blue Straggler stars by Moretti et al. (2008). The inner region of M15 has been studied more recently using deep FUV F140LP and NUV F220W images obtained with the HST/ACS camera (Dieball et al. (2007)) which show the presence of horizontal branch stars, blue stragglers and white dwarfs.
The development of fast readout very low noise L3CCD detectors has opened the possibility of obtaining high-resolution images of the cores of globular clusters using ground based telescopes and the lucky imaging technique (Law et al. (2006)). Here we present lucky imaging observations in the I-band of the core of the globular cluster M15 obtained with FastCam (Oscoz et al. (2008)) at the 2.5m Nordic Optical Telescope. We report -band photometry for 1181 sources in a radius of 6.5 arcsec from the centre of M15 and compare with available stellar catalogues from HST. We find that the lucky imaging technique provides reliable photometric measurements for stars in crowded fields. We take advantage of this technique to study known variable stars and to search for new objects in the core. The same instrument was used recently to obtain high contrast optical imaging of substellar companions (Labadie et al. (2011)) and combined with adaptive optics to produce high precision astrometry of a brown dwarf binary (Femenía et al. (2011)).
2 Observations and data reduction
Observations were obtained on the night of 2008 July 25 with the FastCam instrument on the 2.5-m Nordic Optical Telescope using the -band filter (820 nm) which matches the Johnson-Bessell system. FastCam was equipped with a 512 x 512 pixels L3CCD from Andor Technology. The optics was designed to provide a spatial scale of about 30 mas/pixel which was later determined accurately via comparison with available HST astrometry for M15 stars and using visual binaries from the Washington double star catalogue (Mason et al. (2001)). We pointed the telescope to the centre of M15 (R.A.= and Dec= ) and collected 200 series (“cubes”) of 1000 images each with individual exposures of 30 ms. These 200000 images were obtained during 2 hours 43 min of real observing time. The average seeing during this observing period was 0.65 arcsec as measured in the final -band image (combining all of the I-band images without applying the shift-and-add algorithm).
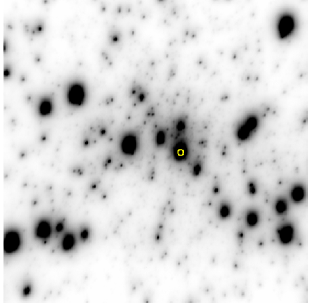
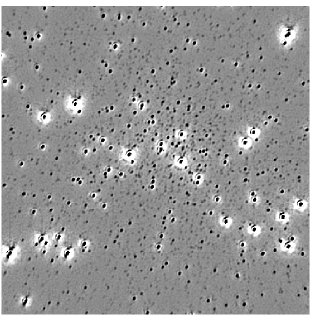
We made the raw data reduction in two steps. First, we selected the best 70 images of each cube (7% of the total) as follows. We defined a circular region on the first image of a cube with a 45 pixels diameter ( 1”.3), centred in the brightest star (ID 6290 in reference van der Marel et al. (2002), it is marked with a yellow circle on the left panel of figure 1) near the centre of the field. This star was always the brightest available within this circular region. We checked that in all the images the reference star was present within this region. Then we identified the brightest pixel within this region for each image. We selected the 70 images with the highest values of the brightest pixel (i.e. 7 % of the total). We determined the position of the brightest pixels and applied a shift-and-add algorithm to these selected images and generated one final image per cube. Our shift-and-add algorithm employs integral pixel shifts (sub-pixel shifts provide a slight improvement of order 5 % of the FWHM of the final image with respect the case of integer shifts). In this way, we obtained 200 images with an effective integration time of 2.1 s each. This procedure was carried out for different percent criteria and found that the best compromise between sensitivity and spatial resolution was achieved by selecting a fraction of images in the range 5-10%, therefore we adopted the 7% criterion.
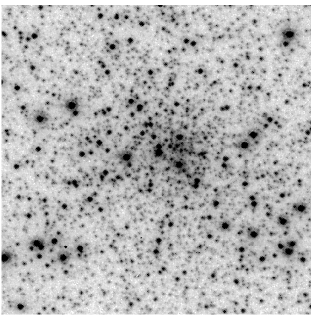
As a second step we took a reference image from these 200 images and defined a new circular region of 45 pixels of diameter centred in the previous bright star. Those images where the selected bright star was out of this region were ruled out in order to avoid too large shifts for the final combined image. Only two images were ruled out of 200. Then we applied the shift-and-add algorithm again and obtained a final image of pixels. Only in the central pixels there is an effective integration time of 415.8 s, due to the maximum shift applied to the images ( pixels). This central field is shown on the left panel of figure 1 and we will focus on this region to carry out the photometric work. On the right panel we display observations of the same field with HST/WFPC2 (central chip) in the F555W (V) filter (Guhathakurta et al. (1996)).
3 Analysis
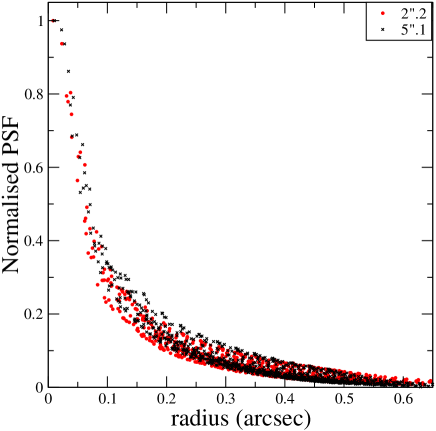
In Fig. 2, we show the average of the light profile of 14 relatively isolated stars in our image. Each stellar profile is normalised and a PSF template is built with a shift-and-add algorithm at sub-pixel scales, each pixel of the PSF template is shown with a point in the figure. We note the presence of a remarkable narrow core and an extended halo. This is the characteristic profile of stars in images obtained using the lucky imaging technique as described in previous work (Baldwin et al. (2008)). The FWHM of the average normalised PSF in our final image is 0′′.1 very close to the diffraction limit of 0′′.084 of the telescope at the wavelength of the observations. The normalised light profiles for two stars are shown in figure 3, the profile marked with red circles belongs to a star at a distance of 2′′.2 from the the star that was used for image alignment and the profiles marked with crosses () belongs to a star at a distance of 5′′.1. There are slight differences between the two which may indicate a modest amount of anisoplanicity and that the dominant turbulent layer at the time of the observations was probably at very low altitude. It should be pointed out that the stars are not perfectly round. We do not have an obvious explanation for this, in particular it could be related to guiding issues which may be at play. We also note the relatively broad azimutal distribution of fluxes in the halo of the two stars which is caused by the presence of very close weaker contaminant stars.

3.1 Detection of stars
In order to carry out the detection of objects in our final image we applied a derivative filter to the whole image, we used the Laplacian of Gaussian filter, often called “mexican hat”, which works efficiently in dense stellar fields (Debray et al. (1994)),
| (1) |
where controls the width of the Gaussian and x, y determine the coordinates of the pixel. In the image convolved with the “mexican hat” (with pixel), the peaks are enhanced and the saddle points approach the background, so the detectability of the sources is definitely improved.
The local maxima are detected on the convolved image using a threshold, set at 3 times the standard deviation of the background determined in the less crowded part of the image. In order to measure this background we divided the image into squares of pixels and measured the standard deviation for each. The lowest of these values was adopted as the standard deviation () of the less crowded part of the image. We note that no region was completely free of sources. We determined the local maxima by comparison of each pixel with its 8 neighbours. In this way we generated a list of potential objects with their positions determined as the centroid of a box of pixels centred around each maximum. On the central panel of figure 1 we can see the resulting convolved image. 1682 objects were detected in this image of pixels ( arcsec2). Only a very small fraction are false detections.
3.2 Cross-match with HST/WFPC2 data
The spatial scale of the image was obtained from a cross-match with the available HST/WFPC2 catalogue by van der Marel et al. (2002) as described below. We first made a linear transformation of the catalogue into our list and identified 762 common pairs with within a tolerance of 2 pixels of FastCam. We improved the number of matches among the two datasets using a second order transformation from the - plane in our image to the R.A.-Dec. plane of the catalogue. The transformation equations modelled a zero point difference, a scale change, a rotation, a tilt, and second order distortion corrections. These transformations include 12 unknown coefficients that are solved using a least squares method
| (2) |
| (3) |
with R.A. = R.A. - R.A, decl. = decl. - decl.cent, x = x - xcent and y = y - ycent, where R.A.cent, decl.cent, xcent and ycent are taken from the object nearest to the centre in our image.
Using the initial list of 762 matched objects with we found the transformation coefficients using least squares. These coefficients were used to compute the positions of our objects in the R.A.-Dec. plane. For each object in our list, we determined distances to the objects in the HST catalogue, the minimum of these distances determines the correlation length for the object. We assume that a FastCam object can be matched with an HST object when the correlation length is smaller than arcsec ( pixels). We removed from the original list used for the transformation objects with correlation length larger than arcsec and and performed an iterative process until we obtained a collection of FastCam objects which all have a correlation length smaller than such value. The final list of objects used to calculate the coefficients of the transformations have 770 objects with distributed uniformly over the whole image. Then we used these transformations to cross-match the 1682 objects found by FastCam with objects in the catalogue of reference van der Marel et al. (2002) and finally selected those with a correlation length smaller than arcsec, which corresponds to 1 pixel in the central chip of HST/WFPC2 van der Marel et al. (2002). We obtained 1481 matched stars and 201 unmatched, we note that these unmatched stars include some potential false detections in the FastCam image.
In the catalogue given by van der Marel et al. (2002) and obtained from the images presented in Guhathakurta et al. (1996), there are 3015 objects in the field observed by FastCam. These authors used a combined F336W, F439W and F555W image ( bands) to detect stars and added manually faint stars with peak brightness below the detection threshold of the DAOPHOT/FIND routine. From the same set of observations but using only the and images Piotto et al. (2002) detected 2221 objects in this field. We can increase the number of detections in our image by decreasing the threshold used in subsection 3.1 to detect local maxima. For a threshold we obtain 1911 objects matched with the catalogue by van der Marel et al. (2002) and 384 unmatched; and at , we obtain 2275 matched and 1452 unmatched objects. In this work we restrict the study to the 1682 objects detected at level. We removed the false detections among the 201 unmatched objects by visual inspection and concluded that 46 out of these 201 were true stars, which included both new stars non reported by van der Marel et al. (2002) and stars with too large uncertainty in the measured positions to perform a reliable correlation. For 41 of these stars the difference between the centroid position and the location of the maximum signal in the convolved image was more than 1 pixel. This difference is mainly caused by the presence of a brighter contaminating star in the vicinity. There are 5 unmatched stars. Finally, we verified that the transformation coefficients associated with tilt and second order distortion corrections were negligible, and therefore using a linear transformation was sufficient to determine a plate scale of mas/pixel for the FastCam image.
3.3 Photometry
In order to perform photometry we use the technique adopted by Guhathakurta et al. (1996) which incorporates a set of standard DAOPHOT routines. Firstly we construct an empirical PSF by iteration. In each iterative step we construct a PSF template of radius 22 pixels by averaging 14 bright and relatively isolated stars. Then we remove the neighbours of these stars using the PSF template from the previous iteration and calculate again the PSF template of these stars. In each iteration the quality of the PSF is improved because the neighbours are removed with increasing precision, convergence is reached after five iterations. From all the template functions tested the penny2 function which vary linearly with the image position provides the best approximation to the actual PSF. The penny2 function is a Gaussian core with a Lorentzian profile, in which both components can be tilted. Then the final PSF template is fitted to all stars detected on the FastCam image with the ALLSTAR routine in DAOPHOT. Due to the difficulty to find relatively isolated stars on the image, the PSF subtraction does not work perfectly and the stars are not subtracted completely. This is because the PSF used for subtraction of the flux of neighbour stars is determined locally using the brightest, nearest stars, but sometimes there are no bright stars which can help to define the local PSF with very good S/N and therefore the correction may not be perfect. This prevents to carry out direct PSF photometry in our image. Therefore, in order to obtain accurate photometry we followed the hybrid method described by Guhathakurta et al. (1996) which combines direct aperture photometry and PSF fitting. This method works as follows: we take a star from our list of objects and subtract the PSF to each neighbouring star within a 44 pixel radius (two times the radius of the region used to calculate the PSF). Then aperture photometry is obtained for the star using a circular aperture of radius 2.5 pixels (0,078 arcsec) with a local sky background measured in a surrounding annulus. This procedure was repeated for each detected target and obtained instrumental magnitudes, Ifc.
3.4 Photometric calibration
The instrumental magnitudes were converted to the Johnson standard system using stars in the catalogue by Yanny et al. (1994). These authors had transformed their instrumental magnitudes to Johnson system (Johnson (1966)) and we directly adopted their magnitudes. We correlated with this catalogue using the algorithm described in subsection 3.2 and obtained 269 stars in common. The zeropoint of the calibration was obtained via an iterative process using only 219 stars in the magnitude range 12-18. The transformation was found to be linear and no colour term was found to be significant (figure 4).

The number of FastCam detected stars in 0.25 mag bins as a function of magnitude is represented in figure 5. We can see that this number increases until the 19-19.25 mag bin, and reach stars as faint as . We removed 82 stars from our catalogue which had false photometry due to their proximity to much brighter stars. Our catalogue provides -band photometry of 1181 stars with , they are ordered from low to high magnitude and it is presented in its entirety in the electronic edition of MNRAS. For reference the first 10 entries are listed in table 1.

| ID | IDVM | ||||
|---|---|---|---|---|---|
| (1) | (2) | (3) | (4) | (5) | (6) |
| 1 | 4.387 | -0.053 | 12.03 | 13.369 | 4113 |
| 2 | 2.101 | -2.216 | 12.13 | 13.696 | 5469 |
| 3 | 7.188 | -6.430 | 12.17 | 13.605 | 5166 |
| 4 | -4.717 | 2.919 | 12.21 | 13.352 | 6041 |
| 5 | -0.110 | -2.527 | 12.27 | 13.743 | 6290 |
| 6 | -2.850 | -1.718 | 12.69 | 13.977 | 6947 |
| 7 | -5.211 | -4.359 | 12.72 | 13.900 | 8408 |
| 8 | 5.711 | -0.607 | 12.74 | 14.072 | 3891 |
| 9 | -4.681 | -6.160 | 12.77 | 13.870 | 8777 |
| 10 | 4.732 | -6.416 | 12.85 | 13.952 | 5956 |
Notes.– Table 1 is presented in its entirety in the electronic edition of MNRAS. The first 10 entries of the -band FastCam photometric catalogue described in the text are shown here for guidance regarding its form and content. The full catalogue contains 1181 stars. Col. (1) is the ID number of the star. Cols. (2) and (3) give coordinates (R.A., Dec.) for each star, measured in arcseconds with respect to the M15 cluster star AC 211 (which according to Kulkarni et al. (1990) has R.A.= and Dec= )). Col. (4) gives the magnitude obtained with FastCam and cols. (5) and (6) the magnitude and the corresponding ID from the van der Marel et al. (2002) catalogue.
3.5 Photometric accuracy
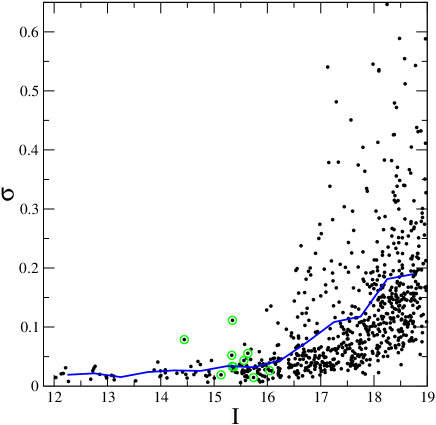
In order to investigate the statistical errors of the photometry in the final FastCam image, we bin the series of 200 images into combinations of 40 images each and perform the same photometric analysis described above. We therefore obtain the photometry for each star in our catalogue which is bright enough to be detected in each of the 5 images. Figure 6 shows the standard deviation of the 5 measurements as a function of stellar magnitude. In the magnitude range 12-15 the statistical errors are below 0.05 mag. In the plot we mark stars that are known to be variable (see section 4). In the final combined image we expect these statistical errors to decrease significantly and the final error to be dominated by the systematic effects resulting from the variation of the PSF with position in the image and the residual contamination of poorly subtracted neighbouring stars.


In order to study the impact of systematic errors we simulate stars using the previous PSF template obtained with the penny2 function which vary linearly with the position in the image. The stars are simulated in different positions on a pixels image with initial zero background using standard DAOPHOT routines. We perform aperture photometry using a circular aperture of radius 2.5 pixels and find that the average difference between the measured and simulated magnitudes is less than 0.015 mag independent of the simulated stars. Such differences are smaller than the statistical error and could be caused by a non-perfect adequacy of the PSF template due to spatial variability.

Errors associated to crowding were investigated simulating stars of a given magnitude with a spatially constant PSF template. We explored the magnitude range I=12 to 20 mag simulating 100 stars for each step of 0.05 mag. In total, 16 images were generated each containing simulated stars of a given magnitude distributed uniformly on the final FastCam image with a minimum imposed separation of 4 pixels from any two stars (85% of the stars detected by FastCam have their nearest neighbours beyond 4 pixels and our detection algorithm only consider stars with separation larger than 3 pixels). Stellar magnitudes were then measured in theses images using the hybrid method described above. In the top panel of figure 7 we see the difference between the input and the output measured magnitudes for the simulated stars as a function of input magnitude. At the bottom panel of this figure we show the mean value and the dispersion for each magnitude bin. We conclude that there is no obvious bias in our photometric measurements associated to crowding. For the brightest objects the contribution of crowding to the photometric error appears to be less than 0.04 mag while for objects of magnitude is of order 0.2 mag. Therefore, in our final image errors associated to crowding are similar to the statistical errors for .
We also give in figure 8 the number of stars detected in the simulated images for each magnitude bin. For instance, in the 18.5-19 mag bin more than the 80% of the objects originally included in the simulation were detected by the algorithm described in subsection 3.1, and for the 19-19.5 mag bin more than 50% were still detected. To our knowledge this is the deepest and more complete high spatial resolution -band observation of the M15 core reported so far.
We also used the previous set of simulations to investigate any possible bias in our astrometry measurements. The difference between the input and recovered position for each artificial star in the simulated images is plotted at the top panel of figure 9 in milliarcseconds. The positions are measured by the method described in subsection 3.1. The mean value and the dispersion for each bin are shown at the bottom panel of figure 9.

4 Stellar populations in the core of M15
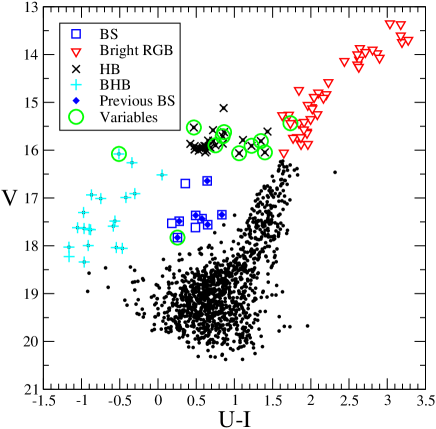
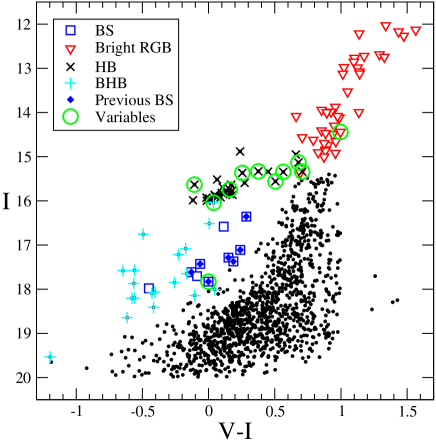
Figure 10 displays the colour-magnitude diagram (CMD) vs. for the 1312 stars cross-matched with the catalogue of van der Marel et al. (2002) and with . We note the main-sequence turnoff at . The CMD vs. shown in figure 11 offers the advantage of a long colour baseline resulting in a more clear separation of the various types of stars. These are denoted in the figure with different symbols: blue stragglers (, BS), bright red giant branch (, Bright RGB), (red) horizontal branch (, HB) and blue horizontal branch (, BHB). The colour criteria used to assign the various stellar types have been adopted according to Yanny et al. (1994) and are not strict. Number counts for the various types of stars found in the FastCam final full image are given in column 2 of table 2. For comparison with Yanny et al. (1994) we also list in columns 3 and 4 the number counts for arcsec obtained in this work and by these authors. We find no significant differences between the two. The CMD vs. is also shown in figure 12. Among the various types of stars that populate the core of M15 we have identified:
| Stellar type | Counts | Counts | Counts |
|---|---|---|---|
| () | () | ||
| (Yanny et al. (1994)) | |||
| Bright RGB | 40 | 26 | 25 |
| HB | 29 | 22 | 18 |
| BS | 10 | 7 | 7 |
| BHB | 20 | 12 | 12 |
4.1 Blue straggler stars
Blue straggler (BS) stars have bluer colours and are brighter than main sequence turnoff stars in globular clusters. The BS stars are frequently located in the densest regions of globular clusters where crowding makes difficult their identification. Previous work on M15 core stars has produced BS candidates selected on the basis of CMDs in the the far-ultraviolet Ferraro & Paresce (1993), vs. Yanny et al. (1994) or vs. (Moretti et al. (2008) using the data in Piotto et al. (2002)). Previously known blue stragglers are marked in figure 11 with filled diamonds.
In table 3 we list the BS stars found in the present work and in Yanny et al. (1994); Moretti et al. (2008). Column one gives the ID number in our catalogue, the following three columns list the BS status according to each reference, and the last column gives some comments. The horizontal lines separate the previously known BS stars (upper part), new BS stars identified in this work (middle) and BS star candidates in previous works which are not confirmed as such here (bottom section).
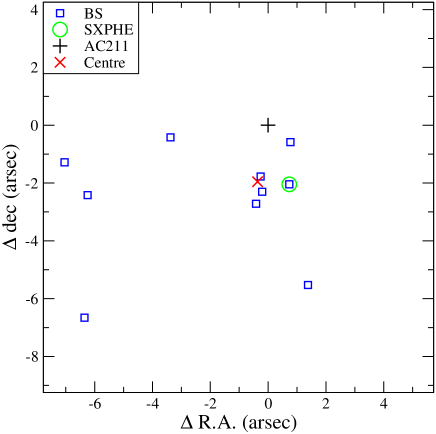
We find 10 BS candidate stars (location plotted in Figure 13), 7 were previously known and 3 are new candidates. One of the three new BS candidates is located at less than 1 arcsec () from the cluster centre. Three out of the seven previously known BS stars also have a distance from the cluster centre of less than 1.1 arcsec ().
We find in previous works 10 BS candidates which are not confirmed as such here. Only one of these 10 stars is listed in more than one reference (ID 145). For this object, we find a mag difference between the magnitude by Yanny et al. (1994) and the one by van der Marel et al. (2002). In the -band the difference is mag and comparing the -band in Yanny et al. (1994) with ours the difference is 0.41 mag. This may suggest variability, but the star is not listed as variable in Dieball et al. (2007).
The other not confirmed BS stars are listed as candidates in only one previous work, the three found by Yanny et al. (1994) are at less than 1 arcsec () from the cluster centre where accurate photometry is more difficult to perform due to crowding. The BS star candidate ID 369 is a variable star (ID V41 in Dieball et al. (2007)), classified as CV, it is likely a SX Phoenicis (SXPHE) star. This object is not listed in the catalogue of Yanny et al. (1994) possibly because of its variability.
4.2 LMXBs
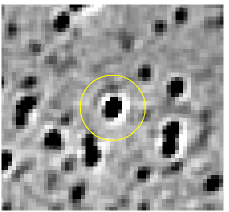
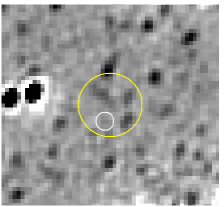
Located in the inner region of M15 the V 15 star AC 211 is optically one of the brightest known low mas X-ray binary (LMXB) systems. It was identified by Auriere et al. (1984) as the possible optical counterpart of the X-ray source 4U 2127+119 and Charles et al. (1986) provided spectroscopic evidence for the classification as LMXB. The high optical to X-ray luminosity ratio suggests that a very luminous central X-ray source is hidden behind the accretion disk. A detailed analysis by Ilovaisky et al. (1993) revealed an orbital period of 17.1 hr. This object is clearly identified in our FastCam images (see the left panel of figure 14) as a source of (ID 102). We have searched for photometric variability grouping our series of data into 20 consecutive cubes (see the subsection on variability below). For each cube one final image was produced and photometry performed. The standard deviation of the series of 20 photometric measurements is =0.05 mag, consistent with the statistical error.
A second luminous LMXB in the core of M15 was discovered by White & Angelini (2001) using the Chandra X-Ray Observatory. The Chandra observations resolved 4U 2127+119 into two X-ray sources, the previously known AC 211 and a second source named as M15 X-2 (CXO J212958.1+121002). This new X-ray source is 2.5 times brighter than AC 211 according to the Chandra counts rate and was associated with a mag star in the data from Guhathakurta et al. (1996) (star 590 in de Marchi & Paresce (1994)) located at from the M15 centre. Dieball et al. (2005) report time-resolved FUV photometry for the optical counterpart and argue that the FUV emission is dominated by an irradiated accretion disk around the neutron star primary. These authors concluded that M15 X-2 can be classified as an ultracompact X-ray binary. On the right panel of figure 14 we show the location of the X-ray source in our final FastCam image and indicate the position of the FUV star. We set a 3 upper limit to the I-band magnitude of this FUV source of .
| ID | This work | Yanny et al. | Moretti et al. | Comments |
|---|---|---|---|---|
| 263 | Yes | Yes | Yes | |
| 276 | Yes | Yes | Yes | |
| 285 | Yes | Yes | Yes | |
| 320 | Yes | Yes | Yes | |
| 239 | Yes | Yes | No | |
| 128 | Yes | No | Yes | |
| 369 | Yes | No | Yes | |
| 402 | Yes | No | No | |
| 156 | Yes | No | No | |
| 337 | Yes | No | No | |
| 145 | No | Yes | Yes | |
| 103 | No | Yes | No | |
| 180 | No | Yes | No | |
| 220 | No | Yes | No | |
| 406 | No | No | Yes | |
| 300 | No | No | Yes | |
| 552 | No | No | Yes | |
| 452 | No | No | Yes | |
| 615 | No | No | Yes | |
| 683 | No | No | Yes |
4.3 RR Lyrae, Cepheids and cataclysmic variable stars
RR Lyrae stars (IDs 43, 48, 57, 68, and 75, in our catalogue) and Cepheid stars (IDs 27, 44 and 46) previously reported by Dieball et al. (2007) are marked with green circles in figure 11. We also detect the cataclysmic variable star (ID 369) which has colours suggestive of a SX Phoenicis (SXPHE) star and note that the other known cataclysmic variable star (V39, Dieball et al. (2007)) with a magnitude of is very marginally detected (2 level) in our image. This object seems to have a rather blue colour when compared with previous observations at shorter wavelengths ( and ).
4.4 Variability: light curves of selected stars
We have used our series of images to study the short timescale variability of stars of the previous types with magnitude in the range 14.5-16 mag. For each set of 1000 images (each obtained over a period of 30 s real time) we generated a . 200 such images were produced, each 10 consecutive images were then averaged in order to increase S/N and perform photometry on the stars of interest. The total time span for the resulting series of 20 images is of 2 hours 43 min, each image corresponding to a time interval of 8.1 min. The series of photometric measurements obtained for a selection of the RR Lyrae, Cepheid, and LMXB stars in our image are shown in figure 15. The majority of these stars show very little variability in the -band. We note smooth trends in several of them (ID 43, 44, 46) which are consistent with the known periods of variability. In some cases, we also detect changes among consecutive 8.1 min images which are clearly beyond the measurement errors and may be indicative of intrinsic short time variability, for instance due to pulses. Remarkably, the LMXB star AC 211 did not show evidence for any significant variability on these time scales.

5 Conclusions
Observations of the M15 core with the 2.5-m Nordic Optical Telescope using FastCam and the lucky imaging technique provided -band images with spatial resolution and sensitivity close to those obtained by HST in this region. We cross-match with the published HST/WFPC star catalogues and calibrate photometrically and astrometrically our image. The number of objects recovered in our final FastCam image is comparable to that reported for the HST images. A catalogue of 1181 stars is presented in this paper. Based on number counts the limiting magnitude of the catalogue is . Errors in magnitudes and positions are estimated from simulations. These simulations also indicate that crowding and spatial resolution, more than sensitivity, limit the completeness of the catalogue to about one magnitude brighter. Using a CMD vs. we discuss the various stellar populations present in the M15 core. In particular, we identify a few new Blue Straggle star candidates and several new core stars which were not previously reported. We show that this imaging technique is particularly useful to investigate stellar populations in the core of globular clusters where the presence of bright stars may limit the use of more conventional techniques. Lucky imaging observations of the core of M15 and other globular clusters undertaken with a baseline of several years may provide proper motions of stars in the very inner region of the clusters () with the precision required to constrain the properties of intermediate-mass black holes.
Acknowledgments
We thank the Nordic Optical Telescope staff and the Instrument Maintenance team of the IAC for their support during the observations. Based on observations made with the Nordic Optical Telescope operated on the island of La Palma by the NOTSA in the Spanish Observatorio del Roque de los Muchachos of the Instituto de Astrofísica de Canarias. This research has been supported by by Project No. 15345/PI/10 from the Fundación Séneca and the Spanish Ministry of Economy and Competitiveness (MINECO) under the grant AYA2010-21308-C03-03. This research has made use of the VizieR catalogue access tool, CDS, Strasbourg, France. Based on observations made with the NASA/ESA Hubble Space Telescope, obtained from the data archive at the Space Telescope Science Institute. STScI is operated by the Association of Universities for Research in Astronomy, Inc. under NASA contract NAS 5-26555.
References
- Auriere et al. (1984) Auriere, M., Le Fevre, O., Terzan, A, 1984, A& A, 138, 415.
- Baldwin et al. (2008) Baldwin, J. E., Warner, P.J., Mackay, C. D., 2008, A& A, 480, 589.
- Charles et al. (1986) Charles, P. A.; Jones, D. C.; Naylor, T., 1986, Natur, 323, 417.
- Davidge & Courteau (1999) Davidge, T.J. & Courteau, S., 1999, AJ, 117, 1297.
- Debray et al. (1994) Debray, B., Llebaria, A., Dubout-Crillon, R., Petit, M., 1994, A& A, 281, 613.
- de Marchi & Paresce (1994) de Marchi, G., Paresce, F., 1994, ApJ, 422, 597.
- Dieball et al. (2005) Dieball, A., Knigge, C., Zurek, D. R., Shara, M. M., Long, K. S., Charles, P. A., Hannikainen, D., van Zyl, L., 2005, ApJ, 634, 105.
- Dieball et al. (2007) Dieball, A., Knigge, C., Zurek, D. R., Shara, M. M., Long, K. S., Charles, P. A., Hannikainen, D., 2007, ApJ, 670, 379.
- Femenía et al. (2011) Femenía, B., Rebolo, R., Pérez-Prieto, J.A., Hildebrandt, S.R., Labadie, L., Peérez-Garrido, A., Beéjar, V.J.S., Díaz-Sánchez, A., Villó, I., Oscoz, A., López, R., Rodríguez, L.F., Piqueras, J., 2011, MNRAS, 413, 1524.
- Ferraro & Paresce (1993) Ferraro, F.R. & Paresce, F., 1993, AJ, 106, 154.
- Gebhardt et al. (2000) Gebhardt, K., Pryor, C., O’Connell, R. D., Williams, T. B., Hesser, James E., 2000, AJ, 119, 1268.
- Guhathakurta et al. (1996) Guhathakurta, P., Yanny, B., Schneider, Donald P., Bahcall, J.N., 1996, AJ, 111, 267.
- Ilovaisky et al. (1993) Ilovaisky, S. A., Auriere, M., Koch-Miramond, L., Chevalier, C., Cordoni, J.-P., Crowe, R. A., 1993, A& A, 270, 139.
- Johnson (1966) Johnson, H.L., 1966, ARA&A, 4, 193.
- Kulkarni et al. (1990) Kulkarni, S. R., Goss, W. M., Wolszczan, A., Middleditch, J., 1990, ApJ, 363, L5.
- Labadie et al. (2011) Labadie, L., Rebolo, R., Villó, I., Pérez-Prieto, J.A., Pérez-Garrido, A., Hildebrandt, S.R., Femenía, B., Díaz-Sánchez, A., Beéjar-Sánchez, V., Oscoz, A., López, R., Piqueras, J., Rodríguez, L.F., 2011, A& A, 526, 144.
- Law et al. (2006) Law, N. M., Mackay, C. D., Baldwin, J. E., 2006, A& A, 446, 739.
- Mason et al. (2001) Mason, B.D., Wycoff, G. L., Hartkopf, W. I., Douglass, G. G., Worley, C. E., 2001, AJ, 122, 3466.
- McNamara et al. (2003) McNamara, B. J., Harrison, T. E., Anderson, J., 2003, ApJ, 595, 187.
- Moretti et al. (2008) Moretti, A., de Angeli, F., Piotto, G, 2008, A& A, 483, 183.
- Oscoz et al. (2008) Oscoz, A., Rebolo, R., López, R., et al. 2008, in Presented at the Society of Photo-Optical Instrumentation Engineers (SPIE) Conference, Vol. 7014, p. 701447, Society of Photo-Optical Instrumentation Engineers (SPIE) Conference Series.
- Piotto et al. (2002) Piotto, G.; King, I. R.; Djorgovski, S. G.; Sosin, C.; Zoccali, M.; Saviane, I.; De Angeli, F.; Riello, M.; Recio-Blanco, A.; Rich, R. M.; Meylan, G.; Renzini, A., 2002, A& A, 391, 945.
- van der Marel et al. (2002) van der Marel, R.P., Gerssen, J., Guhathakurta, P., Peterson, R.C., Gebhardt, K., 2002, AJ, 124, 3255.
- White & Angelini (2001) White, N. E., Angelini, L., 2001, ApJ, 561, 101.
- Yanny et al. (1994) Yanny, B., Guhathakurta, P., Bahcall, J.N., Schneider, D.P., 1994, AJ, 107, 1745.