H.E.S.S. observations of the Carina nebula and its enigmatic colliding wind binary Eta Carinae
Abstract
The massive binary system Eta Carinae and the surrounding HII complex, the Carina Nebula, are potential particle acceleration sites from which very-high-energy (VHE; GeV) -ray emission could be expected. This paper presents data collected during VHE -ray observations with the H.E.S.S. telescope array from 2004 to 2010, which cover a full orbit of Eta Carinae. In the 33.1-hour data set no hint of significant -ray emission from Eta Carinae has been found and an upper limit on the -ray flux of (99% confidence level) is derived above the energy threshold of 470 GeV. Together with the detection of high-energy (HE; 0.1 GeV 100 GeV) -ray emission by the Fermi-LAT up to 100 GeV, and assuming a continuation of the average HE spectral index into the VHE domain, these results imply a cut-off in the -ray spectrum between the HE and VHE -ray range. This could be caused either by a cut-off in the accelerated particle distribution or by severe - absorption losses in the wind collision region. Furthermore, the search for extended -ray emission from the Carina Nebula resulted in an upper limit on the -ray flux of (99% confidence level). The derived upper limit of on the cosmic-ray enhancement factor is compared with results found for the old-age mixed-morphology supernova remnant W 28.
keywords:
Galaxy: open clusters and associations – ISM: individual: Eta Carina – ISM: individual: Carina Nebula – gamma-rays: observations – X-rays: binaries1 Introduction
The Carina Nebula is one of the largest and most active HII regions in our Galaxy and a place of ongoing star formation. It is located at a distance of kpc and harbours eight open stellar clusters with more than 66 O-type stars, 3 Wolf-Rayet stars and the Luminous Blue Variable (LBV) Eta Carinae (Feinstein, 1995; Smith, 2006; Smith & Brooks, 2008). The existence of a -year-old neutron star indicates past supernova (SN) activity in the Carina complex (Hamaguchi et al., 2009; Pires et al., 2009). The age estimates of the member clusters Trumpler 14, 15 and 16 vary significantly, with an age spread of Myr to Myr, indicating several past episodes of star-formation in the northern region; more recent star formation is going on in the southern part of the nebula (see Preibisch et al., 2011a, and references therein). Extended X-ray emission has been reported by, e.g., Hamaguchi et al. (2007) based on observations with Suzaku, supplemented by XMM-Newton (Ezoe et al., 2008) and Chandra (Townsley et al., 2011) observations. These authors found a very low nitrogen-to-oxygen ratio, that, in addition to the presence of a neutron star, suggests that the diffuse plasma originates in one or several unrecognised supernova remnants, in particular in the area surrounding Eta Carinae. The emission may also be attributed to stellar winds from massive stars. In their sq.deg. survey of the diffuse X-ray emission, Townsley et al. (2011) also found evidence for a significant contribution due to charge exchange. This mechanism would originate in a contact layer between the hot plasma and the cold molecular clouds.
Eta Carinae, a member star of Trumpler 16 (Tr 16), is one of the most peculiar objects in our Galaxy, whose environment shows traces of massive eruptions that occurred in past epochs. A giant outburst in the 1840s (known as the Great Eruption) and a smaller outburst in the 1890s produced the Homunculus and little Homunculus Nebulae, respectively (see e.g. Ishibashi et al., 2003). The material expelled from the central star in the Great Eruption has a combined mass of and moves outwards at an average speed of km s-1, implying a kinetic energy of roughly erg (Smith et al., 2003). Smith (2008) found material that is moving ahead of the expanding Homunculus Nebula at speeds of km s-1, which doubles the estimate of the kinetic energy of the giant outburst. For a long time it was believed that the central object, Eta Carinae, is a single, hypergiant LBV star – one of only very few found in the Galaxy (see e.g. Clark et al., 2005). However, observations now suggest Eta Carinae to be composed of a massive LBV star and an O- or B-type companion star (Hillier et al., 2001; Pittard & Corcoran, 2002). The present-day period of the binary has been estimated to days (Damineli et al., 2008), its eccentricity to be (Nielsen et al., 2007) and the semi-major axis to be (Hillier et al., 2001). The LBV star has a very high mass loss rate of , (Hillier et al., 2001; Parkin et al., 2009) and a terminal wind velocity of , the companion star has a thin, fast wind ( and , Pittard & Corcoran (2002)). The total kinetic energy in stellar winds is of the order of a few for the LBV and the OB star together.
When stellar winds of such stars collide, they form a stellar wind shock, where particles can be accelerated to non-thermal energies (e.g. Eichler & Usov, 1993; Reimer et al., 2006). There is strong evidence for the existence of non-thermal particles in Eta Carinae based on X-ray measurements performed with the instruments aboard the INTEGRAL (Leyder et al., 2008, 2010) and Suzaku satellites (Sekiguchi et al., 2009). In the high-energy (HE; ) domain, the AGILE (Tavani et al., 2009) and Fermi-LAT (Abdo et al., 2009, 2010a, 2010b; Nolan et al., 2012) collaborations have reported on the detection of a source coincident with Eta Carinae (henceforth 2FGL J1045.0–5941). Recently Farnier et al. (2011) confirmed with the Fermi-LAT data the position of the HE -ray source and extracted an energy spectrum which features a low and a high-energy component. The high-energy component extends up to GeV, close to the energy threshold of the H.E.S.S. telescope array. The AGILE collaboration reported on a two-day -ray flare from the direction of Eta Carinae which occurred in October 2008. Although this increased -ray flux could not be confirmed by Farnier et al. (2011), Walter & Farnier (2011) found that the high-energy component flux shows a drop in the yearly light curve. Both these findings point to a possible origin of the HE -ray emission in the colliding wind region of Eta Carinae.
TeV J2032+4130 (Aharonian et al., 2002), HESS J1023–575 (Aharonian et al., 2007a) and the extended VHE -ray emission seen from the vicinity of Westerlund 1 (Abramowski et al., 2012) seem to indicate that VHE -ray emission can be linked to massive stars in our Galaxy and motivates an investigation of Eta Carinae and the Carina region as a whole as potential VHE -ray emitters. A further motivation comes from the detection of -ray emission from binary star systems such as LS 5039 (Aharonian et al., 2006c), PSR B1259–63 (Aharonian et al., 2005), LS I +61 303 (Albert et al., 2006) and the probable TeV binary HESS J0632+057 (Aharonian et al., 2007b; Bongiorno et al., 2011). Note that, unlike Eta Carinae these objects have a compact object (a neutron star or black hole) as stellar companion. Furthermore, the recent detection of HE -ray emission up to from the direction of Eta Carinae might hint at particle acceleration up to the VHE -ray regime in which H.E.S.S. is operating.
2 H.E.S.S. observations
2.1 H.E.S.S. Experiment
H.E.S.S. is an array of four VHE -ray imaging atmospheric Cherenkov telescopes (IACTs) located in the Khomas Highland of Namibia. Each of these telescopes is equipped with a tessellated spherical mirror of 107 m2 area and a camera comprising 960 photomultiplier tubes, covering a large Field-of-View (FoV) of 5∘ diameter. The system works in a coincidence mode, requiring at least two of the four telescopes to detect the same extended air shower. This stereoscopic approach results in an angular resolution of per event, a good energy resolution (15% on average) and an efficient rejection of the hadronic background (selection cuts retain less than 0.01% of the CRs; Benbow, 2005). H.E.S.S. has a point-source sensitivity of within 25 hours of observations (Aharonian et al., 2006a). This flux level corresponds to a 1% integral flux of the Crab Nebula for energies 0.2 TeV, and detection threshold of 5 (Li & Ma, 1983). The more advanced data analysis method that is used in this work is discussed later, and achieves a significantly better point-source sensitivity (Ohm et al., 2009).
2.2 Data Set
Observations of the (Sagittarius-) Carina arm tangent have been carried out as part of the H.E.S.S. Galactic plane survey (Aharonian et al., 2006b, 2008a). Additionally, observations pointing in the direction of Eta Carinae have been performed in the so-called wobble-mode, where the telescopes were alternately pointed offset in RA and Dec from Eta Carinae (Aharonian et al., 2006a). The Carina region and its surroundings were observed with the H.E.S.S. array for a total of 62.4 hours between 2004 and 2010. After standard data quality selection, where data taken under unstable weather conditions or with malfunctioning hardware have been excluded, the total exposure time after dead time correction of 3 to 4 telescope data is 33.1 hours (Aharonian et al., 2006a). Due to Eta Carinae’s very southern position on the sky, observations have been carried out at moderate zenith angles of 36∘ to 54∘, with a mean value of 39∘. The average pointing offset from Eta Carinae was 0.8∘.
2.3 Data Analysis
The available data have been analysed with the H.E.S.S. Standard Analysis for shower reconstruction (Aharonian et al., 2006a) and the Hillas-based Boosted Decision Trees (BDT) method for an efficient suppression of the hadronic background component 111The HESS Analysis Package (HAP) version 11-02-pl07 has been used to analyse the data set presented in this work.. This machine learning algorithm returns a continuous variable (called ) that was used to select -ray-like events. Compared to the H.E.S.S. Standard Analysis, a cut on this parameter results in an improvement in terms of sensitivity of % for spectral and morphological analysis For the generation of sky images, the spectral analysis and the production of light curves, the -cuts with a 60 photoelectron (p.e.) cut on the image intensity has been applied (see Ohm et al., 2009). The usage of this set of cuts leads to an energy threshold of 470 GeV for these observations. The 68% containment radius of the H.E.S.S. point spread function (PSF) for the analysis presented here is .
In order to search for a -ray signal from Eta Carinae and the Carina Nebula, two different background estimation techniques have been employed, i.e. the ring background and the reflected background model (Berge et al., 2007). The former has been applied to produce two-dimensional sky images, whereas the latter method has been used to derive spectral information and light curves. Table 1 summarises the properties of the different data sets used in this work and the orbital phases of Eta Carinae which are covered by H.E.S.S. observations. Note that throughout the paper the orbital phase is defined as phase angle with reference zero-time MJD 52822.492 corresponding to the periastron passage, and a period of 2022.7 days (Damineli et al., 2008).
| Data Set | date | MJD | Phase | live time (hrs) |
|---|---|---|---|---|
| 1 | 24.03.04 | 53088 | 0.12 | 1.4 |
| 2 | 11.02.05 | 53412 | 0.29 | 0.9 |
| 3 | 22.05.06 - 24.05.06 | 53877 - 53879 | 0.52 | 5.0 |
| 4 | 01.02.09 - 14.04.09 | 54863 - 54935 | 1.01 - 1.04 | 1.8 |
| 5 | 15.01.10 - 22.03.10 | 55211 - 55277 | 1.18 - 1.21 | 18.4 |
| 6 | 06.12.10 - 18.12.10 | 55536 - 55548 | 1.34 - 1.35 | 5.6 |
| all | 24.03.04 - 18.12.10 | 53088 - 55548 | 0.12 - 1.35 | 33.1 |
Observations have been carried out over a time span of six years, during which the reflectivity of the H.E.S.S. mirrors varied and the gains of the photomultipliers (PMTs) changed. The energy scale of the instrument is calibrated by looking at the response to single muons (Aharonian et al., 2006a).
Two different circular regions have been selected a priori and have been searched for a signal in the H.E.S.S. data. Both of them are shown in Fig. 1 and are centred on the Eta Carinae position at RA and Dec (J2000). Given the size of the Eta Carinae system of (), any VHE -ray signal would appear point-like to H.E.S.S. (Region 1, radius). The Carina Nebula, on the other hand, is a large and complex reflection nebula which shows extended emission seen in mid-infrared, optical and X-ray wavelengths on scales of . The second circular region (Region 2, radius) has a physical scale of 16 pc at 2.3 kpc distance and has been chosen such that the bulk of the diffuse X-ray emission (Townsley et al., 2011) and potential particle acceleration sites such as the massive young stellar clusters Tr 14, and Tr 16 are encompassed. Region 2 also encloses most of the H (Muller et al., 1998) and m emission which traces gaseous and dusty material.
All results presented in the following have been successfully checked for consistency with an analysis chain that is based on a different shower reconstruction method and -ray selection criteria (de Naurois & Rolland, 2009), and on a different calibration. During data taking, increased and variable single-telescope rates and, after quality selection, an increased but stable system trigger rate have been observed. This can be ascribed to the very high night-sky-background (NSB) level caused by the strong UV emission from the Carina Nebula. This NSB level is higher than in any other H.E.S.S. FoV from which results have been reported so far. Systematic tests have been performed and show that predominantly events which result in shower images with intensities below 60 p.e. are affected. However, the high NSB level does not affect the results presented here, since only events with image sizes greater than 60 p.e. are used. Moreover, the main analysis and the cross-check analysis – which models the NSB for shower reconstruction (de Naurois & Rolland, 2009) – give consistent results.
2.4 VHE -ray results
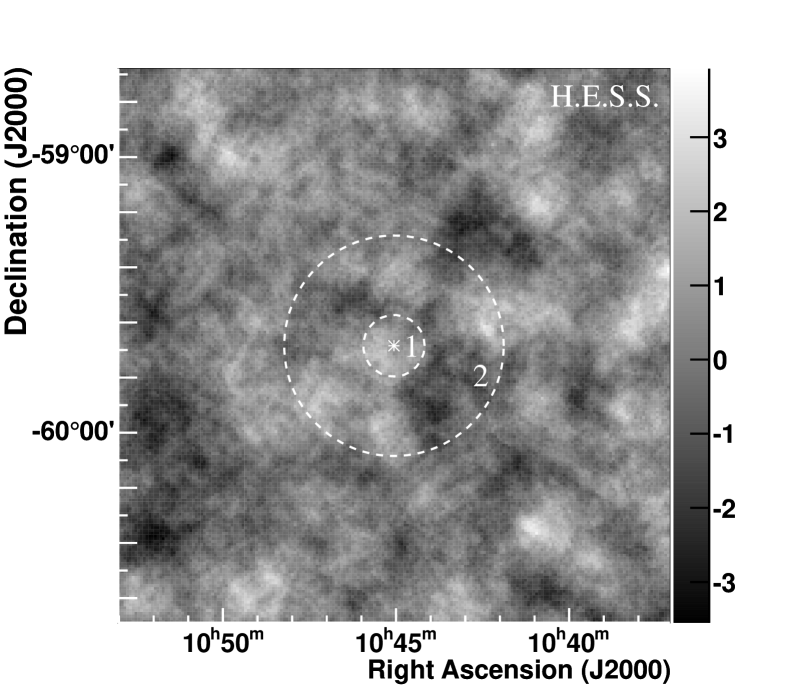
Fig. 1 shows the VHE -ray significance map of the region centred on the optical position of Eta Carinae, and calculated according to Li & Ma (1983). The map has been obtained with the ring background method and for an integration angle of . No evidence for significant VHE -ray emission is found from Region 1 or from Region 2. Assuming a point-like source at the position of Eta Carinae (Region 1) a total of excess events with a significance of are found. Within Region 2, excess events with a significance of are detected.
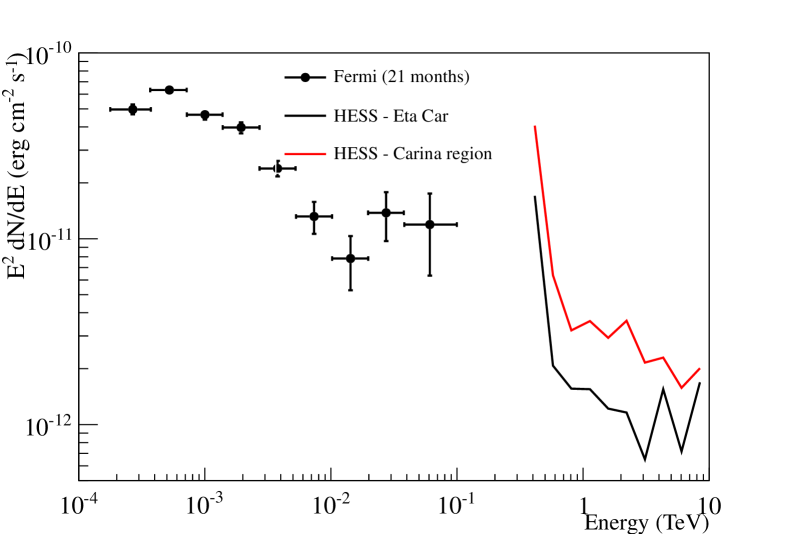
Upper limits (ULs) for the VHE -ray emission from Eta Carinae and the extended region of 0.4∘ radius which covers the inner parts of the Carina Nebula have been produced. Fig. 2 shows the 99% ULs (following Feldman & Cousins, 1998) on the VHE -ray flux from Eta Carinae and the Carina region, assuming an underlying power law distribution with photon index . Adjusting the assumed spectral index to changes the presented upper limits by less than 2%. Also shown is the HE -ray flux from the point-like source 2FGL J1045.0–5941, coincident with Eta Carinae, as detected by the LAT instrument onboard the Fermi satellite (Abdo et al., 2009, 2010b; Farnier et al., 2011). Above the energy threshold of 470 GeV, the derived 99% integral flux ULs are for a point-like source at the position of Eta Carinae and for the extended Region 2.
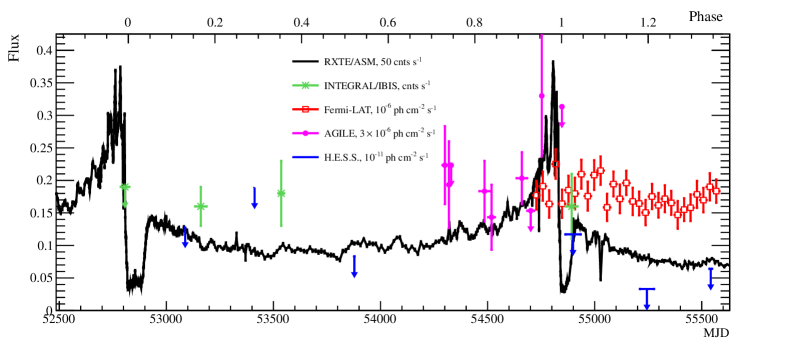
The light curve of the binary system Eta Carinae shows variability in the optical (e.g. Damineli et al., 2000), IR (e.g. Whitelock et al., 2004) X-ray (Corcoran et al., 2010) and HE -ray band (Walter & Farnier, 2011) on timescales of months to years. In order to search for a possible variability in VHE rays on similar timescales, the data collected during the H.E.S.S. observations between 2004 and 2010 have been split into six different data sets accordingly (see Table 1). Since no VHE -ray signal could be found in any of these data sets, flux ULs have been derived for the covered time periods using the same assumptions as before. The statistics, energy thresholds and ULs are summarised in Table 2. Fig. 3 shows the H.E.S.S. flux ULs (99% confidence level) above at the different orbital phases of Eta Carinae. Also shown are the RXTE/ASM light curve and the INTEGRAL/IBIS data points in the X-ray domain as well as the AGILE and monthly Fermi-LAT light curve in HE rays 222The light curve has been obtained following the procedure described in Farnier et al. (2011), but for an extended data set of 30 months (MJD 54682 to MJD 55595).
| Data Set | On | Off | Excess | Significance | 1 TeV) | Phase | |||
|---|---|---|---|---|---|---|---|---|---|
| TeV | ph cm-2 s-1 | ph cm-2 s-1 | |||||||
| 1 | 70 | 414 | 0.1633 | 2.4 | 0.3 | 0.43 | 2.99 | 1.29 | 0.12 |
| 2 | 14 | 218 | 0.0543 | 2.2 | 0.6 | 0.43 | 4.46 | 1.89 | 0.29 |
| 3 | 85 | 2300 | 0.0383 | -3.2 | -0.3 | 0.47 | 1.78 | 0.83 | 0.52 |
| 4 | 29 | 236 | 0.0875 | 8.3 | 1.6 | 0.52 | 2.26 | 1.17 | 1.01-1.04 |
| 5 | 350 | 3744 | 0.0852 | 31.1 | 1.6 | 0.52 | 0.64 | 0.33 | 1.18-1.21 |
| 6 | 100 | 2364 | 0.0426 | -0.6 | -0.1 | 0.52 | 1.23 | 0.64 | 1.34-1.35 |
| all | 648 | 11248 | 0.0540 | 40.2 | 1.6 | 0.47 | 0.77 | 0.36 | 0.12 - 1.35 |
On denotes the number of -ray-like events from Region 1, Off the number of -ray-like events from the background control regions, is the normalisation factor between the On and Off exposures, is the energy threshold in TeV, and and 1 TeV) are the 99% flux ULs above and 1 TeV, respectively, following Feldman & Cousins (1998).
3 Discussion
3.1 Eta Carinae
The detection of point-like HE -ray emission from 2FGL J1045.0–5941 was originally reported in the 3-months bright source list (Abdo et al., 2009) and was confirmed by Farnier et al. (2011) based on 21 months of data. The spectrum presented by Farnier et al. (2011) shows two distinct features: a low-energy component which is best fitted by a power law with index and exponential cut-off at GeV and a high-energy component which extends to GeV and is well described by a simple power law with index . If the HE -ray flux shown in Fig. 2 extended to the TeV regime, it would have been detectable in the H.E.S.S. data presented in this work. The non-detection of a significant VHE -ray signal from Eta Carinae at any orbital phase and in the complete H.E.S.S. data set has some interesting implications for the origin of the HE -ray emission which are discussed below.
Walter & Farnier (2011) showed that the flux of the high-energy component (E 10 GeV) decreases by a factor of 2–3 in the yearly light curve, which could point to a scenario in which the parent particle population is accelerated in the colliding wind region of the binary system (Tavani et al., 2009; Farnier et al., 2011; Bednarek & Pabich, 2011). However, the low-energy component does not seem to vary on yearly or monthly timescales. For the colliding wind model, the lower energy component ( GeV) detected by the LAT is interpreted as Inverse Compton (IC) -ray emission produced in interactions of the accelerated electrons with the dense stellar radiation fields of the binary stars. The hard HE -ray component can be interpreted in the colliding wind region model as either -decay rays, which are produced in proton-proton interactions in the dense stellar wind material (Farnier et al., 2011; Bednarek & Pabich, 2011, their Model B) or as a second leptonic IC contribution (Model A in Bednarek & Pabich, 2011). Interestingly, the H.E.S.S. flux ULs for the individual subsets above the threshold energies of TeV are all well below the extrapolated hard HE -ray component measured by Fermi-LAT (which is at a level of ) 333Note that for a steeper spectral index of the high-energy LAT component, i.e. , the H.E.S.S. ULs of the individual data sets are compatible with the Fermi-LAT spectrum.. This implies that the radiation spectrum has a cut-off below , caused either by a cut-off in the accelerated particle spectrum or resulting from significant - absorption in the radiation field close to the two stars in the colliding wind region model. Bednarek & Pabich (2011) concluded that in the case of accelerated protons, the resulting -decay -ray emission should extend to TeV energies at phases far from periastron. The H.E.S.S. data do not show -ray emission in the multi-TeV range at any orbital phase. Note, however, that the maximum detectable photon energy critically depends on the - absorption at the location where the photon is emitted, and on the alignment between the -ray production region, the star and the observer. For Eta Carinae, the optical depth for TeV particles becomes smaller than unity only at phases far from periastron, where the radiation field densities of both stars are low enough to allow rays to escape the system (see e.g. Fig. 3 in Bednarek & Pabich, 2011).
In an alternative scenario, particles are assumed to be accelerated in the outer blast wave which originates in the Great Eruption (Ohm et al., 2010). For a potential non-variable hadronic high-energy -ray component, as discussed in Skilton et al. (2012), the maximum particle energy of the parent proton population is limited by three different parameters: the time since the giant outburst, i.e. , the blast wave speed, which is measured as km s-1 (Smith, 2008) and the magnetic field, which is only poorly constrained. Contrary to the effects close to the wind-wind collision region, - absorption at the location of the blast wave has no significant effect on the -ray spectrum, given that the optical depth at this location is orders of magnitude smaller than in the colliding wind region. For the parameters used in Ohm et al. (2010) 444Note that Ohm et al. (2010) work in the limit of Bohm diffusion which might overestimate the particle acceleration efficiency., the maximum energy of protons producing rays of TeV energy would be of for magnetic field strengths in the blast wave of and a blast wave speed of . For this set of parameters, the H.E.S.S. measurement excludes larger magnetic fields and/or higher blast wave speeds for this model.
3.2 Carina Nebula
The Carina Nebula harbours many potential particle acceleration sites such as massive binary systems (e.g. WR 25, Eta Carinae, or the recently discovered HD 93250, Sana et al., 2011), young massive stellar clusters (e.g. Tr 14, Tr 16) and possibly one or more SNR shells. Electrons and hadrons accelerated at these places would diffuse out of the acceleration region and interact with interstellar radiation fields and/or gaseous material, producing -ray emission via -decay or IC processes. Potential HE or VHE -ray emission could therefore trace the regions where a SNR shell interacts with high-density gas in molecular clouds (MCs) (as observed e.g. for W 28 Aharonian et al., 2008b; Abdo et al., 2010). Additionally, low-energy CRs could be traced by ionisation of MCs (see e.g. Ceccarelli et al., 2011).
Townsley et al. (2011) investigated the complex structure and composition of the diffuse X-ray emission in the Carina Nebula with the Chandra satellite. The spectrum of this emission is phenomenologically best described by a multi-component model of different thermal plasmas in collisional ionisation equilibrium and in a non-equilibrium ionisation state. The X-ray emission does not seem to show any hint of a non-thermal component which would be indicative of particle acceleration in this region. Possible explanations for these observations are: e.g. that currently no particle acceleration is taking place and hence non-thermal emission is not expected, or that the potential synchrotron emission has a much lower flux level than the efficient plasma emission, or the SNR shock has been diluted in the ambient plasma. If, however, particle acceleration occurred in the past at e.g. the shocks from one or more potential SNR shells, electrons might have cooled via synchrotron or IC radiation to a level not detectable by Chandra or below the H.E.S.S. UL, respectively. Note that for a far-infrared luminosity of (Salatino et al., 2012) and a circular region of 16 pc radius, the IC cooling time for 1 TeV electrons would be .
CR hadrons on the other hand diffuse out of the acceleration region and interact with the gaseous or dusty material, producing -decay rays. The H.E.S.S. ULs can be used to constrain the CR density enhancement factor in units of the local CR density using Equation (10) from Aharonian (1991), assuming that all the gas located in Region 2 is irradiated by CRs at the same time. Following Preibisch et al. (2011b) and Yonekura et al. (2005), the total gas and dust mass in Region 2 can be estimated to . At a distance of 2.3 kpc this gives , where is the fraction of the molecular cloud mass effectively irradiated by high-energy CRs. Assuming , this value can be compared to the CR enhancement factors obtained from the H.E.S.S. detection of VHE -ray emission from W 28 (Aharonian et al., 2008b). W 28 is an old yrs, Kaspi et al. 1993), mixed-morphology SNR, which is seen to interact with molecular clouds belonging to the same massive star forming region (e.g. Brogan et al., 2006). Aharonian et al. (2008b) derive for clouds with masses and distances between 2 kpc and 4 kpc. However, there is at present no evidence for a SNR in the Carina Nebula, although SN explosions must have already occurred in the past (say yrs ago), in view of the presence of a neutron star. In that case, the lack of GeV-TeV emission from the nebula may have two explanations, separate or combined: (i) the factor being due to diffusive or advective transport of CRs in the region (too slow to fill the region or so fast that they escape), in which case the upper limit to , and/or (ii) the collision timescale (for an average gas density of cm-3 in the 50 pc region) is about 10 times less than the age of putative SNRs.
4 Summary
The search for VHE -ray emission from the colliding wind binary Eta Carinae and the most active HII region in the Galaxy, the Carina Nebula, has been presented. No sign of VHE -ray emission could be detected by H.E.S.S. for Eta Carinae and a 99% UL on the integral -ray flux of above 470 GeV has been derived using a 33-hour data set collected over 6 years and covering the full phase range of the binary. Given the detection of a HE -ray component by Fermi-LAT, that extents up to GeV, and assuming a spectral index of the high-energy Fermi-LAT component as found for the average spectrum by Farnier et al. (2011), the derived H.E.S.S. ULs imply a cut-off in the -ray spectrum below a few hundred GeV. H.E.S.S. observations did not reveal significant VHE -ray emission from the Carina Nebula either. The derived ULs allow us to estimate the CR enhancement factor in this region ( 23) which is at a comparable level to the values obtained for the W 28 complex, assuming that CRs illuminate the whole cloud complex. H.E.S.S. II, which adds a 600 m2 telescope to the existing system, will be operational during the next periastron passage in mid 2014 and will be sensitive to lower energies. Together with the future Cherenkov Telescope Array (CTA, Actis et al., 2011), with its greatly improved sensitivity and broader energy coverage, both instruments will close the gap between the HE and VHE -ray range and will allow to probe the cut-off region in the -ray spectrum of Eta Carinae and to search for any variability in this system at very high energies.
Acknowledgements
We thank the referee R. Walter for his helpful comments and suggestions. The support of the Namibian authorities and of the University of Namibia in facilitating the construction and operation of H.E.S.S. is gratefully acknowledged, as is the support by the German Ministry for Education and Research (BMBF), the Max Planck Society, the German Research Foundation (DFG), the French Ministry for Research, the CNRS-IN2P3 and the Astroparticle Interdisciplinary Programme of the CNRS, the U.K. Science and Technology Facilities Council (STFC), the IPNP of the Charles University, the Czech Science Foundation, the Polish Ministry of Science and Higher Education, the South African Department of Science and Technology and National Research Foundation, and by the University of Namibia. We appreciate the excellent work of the technical support staff in Berlin, Durham, Hamburg, Heidelberg, Palaiseau, Paris, Saclay, and in Namibia in the construction and operation of the equipment. SO acknowledges the support of the Humboldt foundation by a Feodor-Lynen research fellowship.
References
- Abdo et al. (2010) Abdo A. A. et al. (Fermi-LAT collaboration), 2010, ApJ, 718, 348
- Abdo et al. (2010a) Abdo A. A. et al. (Fermi-LAT collaboration), 2010a, ApJ, 723, 649
- Abdo et al. (2009) Abdo A. A. et al. (Fermi-LAT collaboration), 2009, ApJS, 183, 46
- Abdo et al. (2010b) Abdo A. A. et al. (Fermi-LAT collaboration), 2010b, Fermi/Large Area Telescope 1 year catalog. http://fermi.gsfc.nasa.gov/ssc/data/access/lat/1yr_catalog/1FGL_catalog_v2.pdf
- Abramowski et al. (2012) Abramowski A. et al. (H.E.S.S. collaboration), 2012, A&A, 537, A114
- Actis et al. (2011) Actis M. et al. (CTA consortium), 2011, Experimental Astronomy, 32, 193
- Aharonian et al. (2002) Aharonian F. et al. (HEGRA collaboration), 2002, A&A, 393, L37
- Aharonian et al. (2005) Aharonian F. et al. (H.E.S.S. collaboration), 2005, A&A, 442, 1
- Aharonian et al. (2008a) Aharonian F. et al. (H.E.S.S. collaboration), 2008a, A&A, 477, 353
- Aharonian et al. (2008b) Aharonian F. et al. (H.E.S.S. collaboration), 2008b, A&A, 481, 401
- Aharonian et al. (2006a) Aharonian F. et al. (H.E.S.S. collaboration), 2006a, A&A, 457, 899
- Aharonian et al. (2006b) Aharonian F. et al. (H.E.S.S. collaboration), 2006b, ApJ, 636, 777
- Aharonian et al. (2007a) Aharonian F. et al. (H.E.S.S. collaboration), 2007a, A&A, 467, 1075
- Aharonian et al. (2006c) Aharonian F. et al. (H.E.S.S. collaboration), 2006c, A&A, 460, 743
- Aharonian (1991) Aharonian F. A., 1991, Ap&SS, 180, 305
- Aharonian et al. (2007b) Aharonian F. A. et al. (H.E.S.S. collaboration), 2007b, A&A, 469, L1
- Albert et al. (2006) Albert J. et al. (MAGIC collaboration), 2006, Science, 312, 1771
- Bednarek & Pabich (2011) Bednarek W., Pabich J., 2011, A&A, 530, A49
- Benbow (2005) Benbow W., 2005, in Proc. Conf. Towards a Network of Atmospheric Cherenkov Detectors VII, Palaiseau, pp. 163–172
- Berge et al. (2007) Berge D., Funk S., Hinton J., 2007, A&A, 466, 1219
- Bongiorno et al. (2011) Bongiorno S. D., Falcone A. D., Stroh M., Holder J., Skilton J. L., Hinton J. A., Gehrels N., Grube J., 2011, ApJ Letters, 737, L11
- Brogan et al. (2006) Brogan C. L., Gelfand J. D., Gaensler B. M., Kassim N. E., Lazio T. J. W., 2006, ApJ Letters, 639, L25
- Ceccarelli et al. (2011) Ceccarelli C., Hily-Blant P., Montmerle T., Dubus G., Gallant Y., Fiasson A., 2011, ApJ Letters, 740, L4
- Clark et al. (2005) Clark J. S., Larionov V. M., Arkharov A., 2005, A&A, 435, 239
- Corcoran et al. (2010) Corcoran M. F., Hamaguchi K., Pittard J. M., Russell C. M. P., Owocki S. P., Parkin E. R., Okazaki A., 2010, ApJ, 725, 1528
- Damineli et al. (2008) Damineli A. et al., 2008, MNRAS, 384, 1649
- Damineli et al. (2000) Damineli A., Kaufer A., Wolf B., Stahl O., Lopes D. F., de Araújo F. X., 2000, ApJ Letters, 528, L101
- de Naurois & Rolland (2009) de Naurois M., Rolland L., 2009, Astroparticle Physics, 32, 231
- Eichler & Usov (1993) Eichler D., Usov V., 1993, ApJ, 402, 271
- Ezoe et al. (2008) Ezoe Y., Hamaguchi K., Gruendl R. A., Chu Y.-H., Petre R., Corcoran M. F., 2008, PASJ, 61, S123
- Farnier et al. (2011) Farnier C., Walter R., Leyder J., 2011, A&A, 526, A57+
- Feinstein (1995) Feinstein A., 1995, in Revista Mexicana de Astronomia y Astrofisica, Vol. 2, Revista Mexicana de Astronomia y Astrofisica Conference Series, V. Niemela, N. Morrell, & A. Feinstein, ed., pp. 57–+
- Feldman & Cousins (1998) Feldman G. J., Cousins R. D., 1998, Phys. Rev. D, 57, 3873
- Hamaguchi et al. (2009) Hamaguchi K. et al., 2009, ApJ Letters, 695, L4
- Hamaguchi et al. (2007) Hamaguchi K. et al., 2007, PASJ, 59, 151
- Hillier et al. (2001) Hillier D. J., Davidson K., Ishibashi K., Gull T., 2001, ApJ, 553, 837
- Ishibashi et al. (2003) Ishibashi K. et al., 2003, AJ, 125, 3222
- Leyder et al. (2008) Leyder J., Walter R., Rauw G., 2008, A&A, 477, L29
- Leyder et al. (2010) Leyder J., Walter R., Rauw G., 2010, A&A, 524, A59+
- Li & Ma (1983) Li T., Ma Y., 1983, ApJ, 272, 317
- Muller et al. (1998) Muller G. P., Reed R., Armandroff T., Boroson T. A., Jacoby G. H., 1998, in Society of Photo-Optical Instrumentation Engineers (SPIE) Conference Series, Vol. 3355, Society of Photo-Optical Instrumentation Engineers (SPIE) Conference Series, S. D’Odorico, ed., pp. 577–585
- Nielsen et al. (2007) Nielsen K. E., Corcoran M. F., Gull T. R., Hillier D. J., Hamaguchi K., Ivarsson S., Lindler D. J., 2007, ApJ, 660, 669
- Nolan et al. (2012) Nolan P. L. et al. (Fermi-LAT collaboration), 2012, ApJS, 199, 31
- Ohm et al. (2010) Ohm S., Hinton J. A., Domainko W., 2010, ApJ Letters, 718, L161
- Ohm et al. (2009) Ohm S., van Eldik C., Egberts K., 2009, Astroparticle Physics, 31, 383
- Parkin et al. (2009) Parkin E. R., Pittard J. M., Corcoran M. F., Hamaguchi K., Stevens I. R., 2009, MNRAS, 394, 1758
- Pires et al. (2009) Pires A. M., Motch C., Turolla R., Treves A., Popov S. B., 2009, A&A, 498, 233
- Pittard & Corcoran (2002) Pittard J. M., Corcoran M. F., 2002, A&A, 383, 636
- Preibisch et al. (2011a) Preibisch T. et al., 2011a, A&A, 530, A34
- Preibisch et al. (2011b) Preibisch T., Schuller F., Ohlendorf H., Pekruhl S., Menten K. M., Zinnecker H., 2011b, A&A, 525, A92+
- Reimer et al. (2006) Reimer A., Pohl M., Reimer O., 2006, ApJ, 644, 1118
- Salatino et al. (2012) Salatino M., de Bernardis P., Masi S., Polenta G., 2012, ApJ, 748, 1
- Sana et al. (2011) Sana H., Le Bouquin J.-B., De Becker M., Berger J.-P., de Koter A., Mérand A., 2011, ApJ Letters, 740, L43+
- Sekiguchi et al. (2009) Sekiguchi A., Tsujimoto M., Kitamoto S., Ishida M., Hamaguchi K., Mori H., Tsuboi Y., 2009, PASJ, 61, 629
- Skilton et al. (2012) Skilton J. L., Domainko W., Hinton J. A., Jones D. I., Ohm S., Urquhart J. S., 2012, A&A, 539, A101
- Smith (2006) Smith N., 2006, MNRAS, 367, 763
- Smith (2008) Smith N., 2008, Nature, 455, 201
- Smith & Brooks (2008) Smith N., Brooks K. J., 2008, The Carina Nebula: A Laboratory for Feedback and Triggered Star Formation, Reipurth, B., ed., pp. 138–+
- Smith et al. (2003) Smith N., Gehrz R. D., Hinz P. M., Hoffmann W. F., Hora J. L., Mamajek E. E., Meyer M. R., 2003, AJ, 125, 1458
- Tavani et al. (2009) Tavani M. et al. (AGILE collaboration), 2009, ApJ Letters, 698, L142
- Townsley et al. (2011) Townsley L. K. et al., 2011, ApJS, 194, 15
- Walter & Farnier (2011) Walter R., Farnier C., 2011, Proceeding of the 32nd International Cosmic-ray Conference, Bejing, 2011. http://galprop.stanford.edu/elibrary/icrc/2011/papers/OG2.2/icrc1076.pdf
- Whitelock et al. (2004) Whitelock P. A., Feast M. W., Marang F., Breedt E., 2004, MNRAS, 352, 447
- Yonekura et al. (2005) Yonekura Y., Asayama S., Kimura K., Ogawa H., Kanai Y., Yamaguchi N., Barnes P. J., Fukui Y., 2005, ApJ, 634, 476