Abstract
We report the results of a search for molecular oxygen (O2) toward the Orion Bar, a prominent photodissociation region at the southern edge of the H II region created by the luminous Trapezium stars. We observed the spectral region around the frequency of the O2 3– 12 transition at 487 GHz and the 5– 34 transition at 774 GHz using the Heterodyne Instrument for the Far Infrared on the Herschel Space Observatory. Neither line was detected, but the 3 upper limits established here translate to a total line-of-sight O2 column density 1.51016 cm-2 for an emitting region whose temperature is between 30 K and 250 K, or 11016 cm-2 if the O2 emitting region is primarily at a temperature of 100 K. Because the Orion Bar is oriented nearly edge-on relative to our line of sight, the observed column density is enhanced by a factor estimated to be between 4 and 20 relative to the face-on value. Our upper limits imply that the face-on O2 column density is less than 41015 cm-2, a value that is below, and possibly well below, model predictions for gas with a density of 104 – 105 cm-3 exposed to a far ultraviolet flux 104 times the local value, conditions inferred from previous observations of the Orion Bar. The discrepancy might be resolved if: (1) the adsorption energy of O atoms to ice is greater than 800 K; (2) the total face-on AV of the Bar is less than required for O2 to reach peak abundance; (3) the O2 emission arises within dense clumps with a small beam filling factor; or, (4) the face-on depth into the Bar where O2 reaches its peak abundance, which is density dependent, corresponds to a sky position different from that sampled by our Herschel beams.
Herschel∗ Search for O2 Toward the Orion Bar
Gary J. Melnick1, Volker Tolls1, Paul F. Goldsmith2, Michael J. Kaufman3,
David J. Hollenbach4, John H. Black5, Pierre Encrenaz6, Edith Falgarone7, Maryvonne Gerin7, Åke Hjalmarson5, Di Li8, Dariusz C. Lis9, René Liseau5, David A. Neufeld10, Laurent Pagani6,
Ronald L. Snell11, Floris van der Tak12, and Ewine F. van Dishoeck13,14
Received ; Accepted
∗ Herschel is an ESA space observatory with science instruments provided by European-led Principal Investigator consortia and with important participation from NASA
-
1
Harvard-Smithsonian Center for Astrophysics, 60 Garden Street, MS 66, Cambridge, MA 02138, USA
-
2
Jet Propulsion Laboratory, California Institute of Technology, 4800 Oak Grove Drive, Pasadena, CA 91109, USA
-
3
Department of Physics and Astronomy, San Jośe State University, San Jose, CA 95192, USA
-
4
SETI Institute, Mountain View, CA 94043, USA
-
5
Department of Earth & Space Sciences, Chalmers University of Technology, Onsala Space Observatory, SE-439 92 Onsala, Sweden
-
6
LERMA & UMR8112 du CNRS, Observatoire de Paris, 61 Av. de l’Observatoire, 75014 Paris, France
-
7
LRA/LERMA, CNRS, UMR8112, Observatoire de Paris & École Normale Supérieure, 24 rue Lhomond, 75231 Paris Cedex 05, France
-
8
National Astronomical Observatories, Chinese Academy of Sciences, A20 Datun Road, Chaoyang District, Beijing 100012, China
-
9
California Institute of Technology, Cahill Center for Astronomy and Astrophysics 301-17, Pasadena, CA 91125, USA
-
10
Department of Physics and Astronomy, Johns Hopkins University, 3400 North Charles Street, Baltimore, MD 21218, USA
-
11
Department of Astronomy, University of Massachusetts, Amherst, MA 01003, USA
-
12
SRON Netherlands Institute for Space Research, P.O. Box 800, 9700 AV, and Kapteyn Astronomical Institute, University of Groningen, Groningen, The Netherlands
-
13
Leiden Observatory, Leiden University, P.O. Box 9513, 2300 RA, Leiden, The Netherlands
-
14
Max-Planck-Institut f ur Extraterrestrische Physik, Giessenbachstrasse 1, 85748, Garching, Germany
1 INTRODUCTION
Searches for interstellar O2 have a long history, but their motivation has evolved with time. Prior to the late-1990’s, efforts to detect O2 were driven largely by a desire to confirm its predicted role as a major reservoir of elemental oxygen within dense molecular clouds and as the most important gas coolant – after CO – of cold (30 K), modestly dense ((H2)103 – 104 cm-3) gas (cf. Goldsmith & Langer, 1978; Neufeld, Lepp, & Melnick, 1995). The launch of the Submillimeter Wave Astronomy Satellite (SWAS) in 1998 and Odin in 2001, and the subsequent failure of these observatories to detect O2 toward a large number of sources at levels of a few percent of the abundances predicted by equilibrium gas-phase chemical models, have forced a shift in emphasis to a re-examination of the oxygen chemistry in dense molecular gas. Today, interest in O2 no longer lies in its being a significant reservoir of elemental oxygen or in its cooling power. Instead, because the abundance of gas-phase O2 is set by a balance of various formation, destruction, and depletion processes thought to affect the broader chemistry in dense gas – such as gas-phase reactions, grain-surface reactions, thermal sublimation, far-ultraviolet (FUV) photodesorption, cosmic-ray desorption, photodissociation, and freeze out – measures of O2 have become an important test of our current understanding of the relative effectiveness of these processes.
The capabilities of the Herschel Space Observatory’s Heterodyne Instrument for the Far-Infrared (HIFI; de Graauw et al., 2010) have enabled improved searches for O2 through: (1) its high sensitivity, including at 487 GHz – the frequency of the 33 – 12 transition observed previously by SWAS and Odin; and, (2) its broad frequency coverage that permits observations of additional O2 submillimeter transitions, some of which are expected to exhibit stronger emission than the 3– 12 line under certain physical conditions. The Open Time Key Program “Herschel Oxygen Project” (HOP; Co-PI’s P. Goldsmith and R. Liseau) is designed to survey Galactic sources with the goal to detect O2 or set meaningful limits on its abundance within these regions. Because the effectiveness of the processes that determine the O2 column density depends upon the gas density, temperature, and incident FUV flux (scaling factor in multiples of the average Habing local interstellar radiation field; Habing 1968) among other parameters, testing these models requires that the HOP observations include a range of source types, such as dense quiescent clouds, outflows and shocked gas regions, and FUV-illuminated cloud surfaces (see, for example, Goldsmith et al., 2011; Liseau et al., 2012).
In this paper, we report the results of a deep search for O2 emission toward the Orion Bar, a well known ionization front located approximately 2′ southeast of the Trapezium stars in Orion at the interface of the H II region created by these stars and the dense gas associated with the surrounding Orion molecular cloud. The Orion Bar lends itself well to the study of FUV-illuminated molecular gas for several reasons, including its nearly edge-on geometry, its proximity (420 pc; Menten et al., 2007; Hirota et al., 2007; Kim et al., 2008), its relatively high density ((H2) 3104 cm-3), and the strong (104 – 105) external FUV field irradiating this gas. The Orion Bar, and sources like it, are of particular interest since the dust grains within these regions are predicted to be sufficiently warm that the thermal evaporation of O atoms from the grain surfaces is enhanced, resulting in a higher fraction of O in the gas phase and the increased production of O2 via gas-phase chemical reactions (OOHOH). Under such circumstances, the O2 column density can be more than a factor of 10 greater than within gas exposed to lower (i.e., 500) external FUV fields (cf. Hollenbach et al., 2009). The inclusion of the Orion Bar within the HOP program was intended to test this prediction.
The observations and data reduction methods are described in §2 below. In §3, we present the resultant spectra and the upper limits to the O2 integrated intensity. In §4, we review the excitation conditions within the Orion Bar and the derived limits on the line-of-sight O2 column density. In §5, we discuss these limits in the context of recent chemical models that trace the O2 abundance from the FUV-illuminated cloud surface to the deep interior.
2 OBSERVATIONS AND DATA REDUCTION
The Herschel HIFI observations presented here were carried out using the HIFI Band 1a receiver for the 3– 12 487 GHz observations and the HIFI Band 2b receiver for the 5– 34 774 GHz observations. The 487 GHz observations were conducted on operational day (OD) 291 in spectral scan dual beam switch (DBS) mode, while the 774 GHz observations were conducted on OD 297 in spectral scan DBS mode and on OD 509 in HIFI single point DBS mode. Eight LO-settings were used for both the 487 GHz and the 774 GHz spectral scans to enable the spectral deconvolution, and the additional eight single point 774 GHz observations were observed also using eight different LO settings. The total integration time (on-sourceoff-source) for each polarization was 0.93 hours for the 487 GHz spectral scan, 0.86 hours for the 774 GHz spectral scan, and a total of 4.6 hours for the eight single point 774 GHz observations. The full-width-at-half-maximum (FWHM) beam sizes were 44.7′′ at 487 GHz and 28.2′′ at 774 GHz.
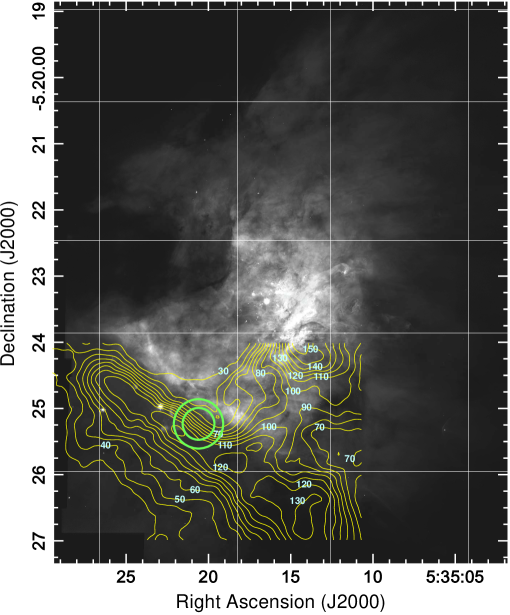
The observed position, 5h 35m 20.6s, 5o 25′ 14.0 ′′ (J2000), is shown in Fig. 1. We applied the total observing time allotted to HOP observations of the Orion Bar to a single spatial position – versus multiple positions – in order to achieve the lowest radiometric noise and, thus, the greatest sensitivity to weak O2 emission. In the absence of prior information about the possible O2 spatial distribution, our choice of sky position was guided by the desire to place the 487 GHz and 774 GHz beam centers a distance corresponding to approximately 8 visual magnitudes into the molecular gas measured from the ionization front, in accord with model predictions (see §5 for a full discussion). For an H2 density between 5104 cm-3 and 5105 cm-3, applicable to the interclump medium in the Bar, and 104, this corresponds to a projected angular distance of between 2.4′′ and 24′′ from the ionization front. As shown in Fig. 1, the selected position places the beams in the center of this range, while the beam sizes encompass the full range. The sky position parallel to the Orion Bar was selected to coincide with the molecular gas, as delineated by the 13CO 3 – 2 emission (see Fig. 1), and, for future analysis, one of the positions under present study by another Herschel Key Program.
The data were processed using the standard HIFI pipeline software HIPE version 7.3 (Ott, 2010), spurious signals (“spurs”) removed, spectra defringed, spectral scans deconvolved, and all data finally exported to GILDAS-CLASS format. Further processing was performed only on the Wide Band Spectrometer (WBS) spectra (0.5 MHz channel spacing and 1.1 MHz effective spectral resolution) using the IRAM GILDAS software package (http://iram.fr/IRAMFR/GILDAS/), including first-order baseline removal, averaging of the 774 GHz spectral scans and frequency-aligned single point observations, averaging of the H- and V-polarization spectra, and production of separate averages for both frequencies and both sidebands. The frequencies for the line identification were extracted from the JPL and CDMS databases (Pickett et al., 1998; Müller et al., 2005) as well as Drouin et al. (2010) in the case of O2.
3 RESULTS
A summary of the identified lines in the HIFI Band 1a and Band 2b spectra along with the observing modes, integration times, and Gaussian fit parameters is provided in Table 1. The summed H+V polarization spectra observed in Band 1a are shown in Fig. 2, while those observed in Band 2b are shown in Fig. 3. With the exception of the H2Cl+ chloronium 485 GHz spectrum, which is a blend of three hyperfine components (cf. Lis et al., 2010; Neufeld et al., 2011), all of the detected lines appear well fit by single Gaussian profiles with a common LSR line center of 10.680.14 km s-1 (1) and individual best-fit FWHM line widths ranging from about 1.8 km s-1 to 2.5 km s-1.
The upper limit to the integrated intensity of the O2 3– 12 and 5– 34 transitions is derived assuming each line is described by a single Gaussian profile, as is the case for the other unblended lines we detect toward this position. The rms noise in the O2 3– 12 487 GHz spectrum between LSR velocities of 110 km s-1 and 25 km s-1 – a velocity range within which there is no evidence for any spectral features – is 2.62 mK per 0.5 MHz channel. Similarly, the rms noise in the O2 5– 34 774 GHz spectrum between LSR velocities of 70 km s-1 and 30 km s-1 is 2.19 mK per 0.5 MHz channel. The intrinsic O2 line widths along this line of sight are unknown; however, we assume they lie between the extremes of 1.8 km s-1 and 2.5 km s-1 (FWHM) measured for the other unblended lines we detect along this line of sight (see Table 1). This leads to 3 upper limits of between 0.0150 and 0.0209 K km s-1 for the 3– 12 487 GHz line and between 0.0126 and 0.0175 K km s-1 for the 5– 34 774 GHz line.
4 EXCITATION AND LIMITS ON THE O2 COLUMN DENSITY
The Orion Bar, like many other photodissociation regions (PDRs), displays emission from a variety of ionic, atomic, and molecular species best fit by a mix of gas densities and temperatures. The broad picture to emerge is that of a layer consisting of at least two components: interclump gas with (H2) 3 – 2010cm-3 (Hogerheijde, Jansen, & Van Dishoeck, 1995; Wyrowski et al., 1997; Simon et al., 1997; Marconi et al., 1998) surrounding clumps with (H2) 106 – 10cm-3 (Lis & Schilke, 2003; Young Owl et al., 2000), which comprise about 10% of the mass (Jansen et al., 1995). Gas temperature estimates similarly vary, depending on the species observed and the component giving rise to most of the emission. Within the denser well-shielded gas, the gas temperature is thought to range between 50 and 85 K (Hogerheijde, Jansen, & Van Dishoeck, 1995; Gorti & Hollenbach, 2002). The gas temperature associated with the interclump medium is estimated to be 8530 K (Hogerheijde, Jansen, & Van Dishoeck, 1995), with some gas temperatures associated with the surfaces (AV 1) of the denser clumps ranging as high as 220 K (Jansen et al., 1995; Batrla & Wilson, 2003; Goicoechea et al., 2011). There is evidence for an even warmer component (300 – 700 K) based on emission from pure rotational lines of H2 and far-infrared fine-structure lines of [O I] at 63 and 145m and [C II] at 158m (Herrmann et al., 1997; Allers et al., 2005). This warmer component is believed to arise in the gas between the ionization front and the molecular region traced by 13CO emission (Walmsley et al., 2000). The strength of the FUV field incident on the Orion Bar has been estimated to be 1 – 4104 based upon the total radiation from the Trapezium stars – and the O star Ori C in particular – the intensity of the far-infrared [C II] and [O I] fine-structure lines mapped toward the Orion molecular ridge, the strength of several near-infrared lines whose intensities have been ascribed to recombinations to highly excited states of CI, and the strength of near-infrared NI lines excited by the fluorescence of UV lines (Herrmann et al., 1997; Marconi et al., 1998; Walmsley et al., 2000). Given a density of 105 cm-3 for the bulk of the material and a of 104, models predict that the O2 abundance peaks at AV 8 mag. (cf. Sternberg & Dalgarno, 1995; Hollenbach et al., 2009). At these depths into the cloud, the gas temperature is predicted to be 30 – 40 K (Hollenbach et al., 2009). Thus, in our analysis, we consider the possibility that the O2 emission could arise in gas with temperatures anywhere between 30 K and 250 K.
The weak line flux of the O2 magnetic dipole transitions makes them highly likely to be optically thin. Under the assumption that the O2 emission uniformly fills the HIFI beam, the observed integrated intensity in a given transition is:
| (1) |
where is the main beam temperature, is the line frequency (and is the line frequency in GHz), is the spontaneous decay rate between the transition upper level, , and lower level, , (O2) is the total O2 column density in cm-2, and is the fractional population in the transition upper level. The conversion between main beam and antenna temperature makes use of the efficiencies reported in Roelfsema et al. (2012).
To determine the fractional population of the transition upper state, , the excitation of the lowest 36 levels of O2, corresponding to a maximum upper-level temperature of 1141 K, was computed under the large velocity gradient (LVG) approximation. The spontaneous decay rates are those of Drouin et al. (2010) and the collisional rate coefficients are those calculated by Lique (2010) for He – O2 collisions, multiplied by 1.37 to account for the different reduced mass when H2 is the collision partner. For molecular hydrogen densities 3104 cm-3, both the 3– 12 and 5– 34 transitions are close to (or in) LTE and the values of depend essentially only on the temperature. Fig. 4 shows the resulting contours of integrated antenna temperature for the 3– 12 transition as functions of the total O2 column density and gas temperature between 30 and 250 K. Similarly, Fig. 5 shows the corresponding results for the 5– 34 transition.
Of the two O2 lines searched for here, an examination of Figs. 4 and 5 shows that our measured upper limits to the 5– 34 774 GHz integrated intensity place a more stringent limit on the maximum O2 column density for 35 K (and comparable limits to that set by the 487 GHz line at 30 K). Specifically, assuming the emission fills the beam, the total line-of-sight O2 column density must be less than 1.51016 cm-2 (3). If the O2 abundance peaks within the cooler well-shielded gas, for which 100 K, the upper limit to the total O2 column density is less than 11016 cm-2 (3).
5 DISCUSSION
O2 is produced primarily through the gas-phase reaction OOHO2H and is destroyed by photodissociation for the cloud depths of interest here. Thus, the O2 abundance is expected to peak where the FUV field has been heavily attenuated and where both the gas-phase O and OH abundances are high which, in externally FUV-illuminated clouds, is predicted to occur within a relatively narrow (i.e., a few AV deep) zone centered at an AV 9 mag. from the cloud surface (cf. Hollenbach et al., 2009). The proximity of this zone to the surface and the range of depths over which the peak abundance occurs are governed by several important processes. Near the cloud surface, where the FUV field is largely unattenuated, the equilibrium O2 abundance is low owing to a high photodissociation rate. Beyond a few AV into the cloud, the FUV field is attenuated, the photodissociation rate reduced, and a region of peak O2 (and H2O) abundance is attained.
Within most clouds with 500, the path to O2 formation is believed to start with the formation of water ice, H2Oice, on grains, which occurs when O atoms strike and stick to grains long enough to combine with an accreted H atom to form OHice and then H2Oice. Within this region the FUV field remains strong enough to photodesorb H2O from the ice mantles and subsequently photodissociate these molecules, creating sufficient gas-phase O and OH to produce O2 by the gas-phase chemical reaction above. Deeper into the cloud (i.e., greater AV), the FUV field is almost completely attenuated and the gas-phase OH and H2O produced through the photodesorption and photodissociation of H2Oice drops significantly; most O atoms that then strike dust grains and form H2Oice remain locked in ice as long as the grain temperature is 100 K. Over time (105 years), this process greatly reduces the gas-phase atomic oxygen abundance and suppresses the formation and abundance of O2. Hence, in the model of Hollenbach et al. (2009), the steady-state abundance profile of O2 (and H2O) resembles an elevated plateau that peaks at an AV 6 for gas with (H2)104 – 105 cm-3 and 500.
For regions subject to a greater than 500, such as the Orion Bar, the scenario above is altered and, for several reasons, the peak O2 abundance is higher and occurs at a higher AV. First, the high FUV field absorbed at the cloud surface leads to a high infrared field that keeps the grains warm, even deep within the cloud. For 104, 40 K to AV 8, resulting in a significant fraction of the O atoms being thermally desorbed from the grains before they can form H2Oice and leading to an increase in O in the gas phase. Second, the higher grain temperature also reduces the freezeout of such oxygen-bearing species as OH and O2, further increasing the amount of elemental O in the gas phase. Finally, the attenuated FUV flux at the higher values of AV lowers the photodestruction rates, allowing O2 to survive to greater cloud depths. The combined result of these effects is a peak O2 abundance about 3 times higher, and a total O2 column density more than 10 times greater than for comparably dense gas exposed to 500. This result is reflected in the detailed calculations presented in Hollenbach et al. (2009) and shown in Fig. 6, which is adapted from their paper. For this reason, the Orion Bar was considered a promising source for our attempts to detect O2 emission.
From Fig. 6, it would appear that the upper limits on the total O2 column density established here are not in serious disagreement with the model predictions. However, the results shown in Fig. 6 apply to a gas column perpendicular to the face of a planar cloud. This is not the geometry of the Orion Bar, which has often been described as an edge-on PDR, though its true structure has been the subject of some study and debate. For example, based on millimeter and submillimeter line observations, Hogerheijde, Jansen, & Van Dishoeck (1995) and Jansen et al. (1995) propose a model in which the Bar has a tilt angle, , of 3o from edge-on, resulting in an increase in the line-of-sight column density (beyond what would be measured for a face-on geometry) by a factor (sin)-1, or almost 20. Alternately, Walmsley et al. (2000) find that a cylindrical model, in which the axis is in the plane of sky and the radius is 0.3 pc, best reproduces the observed spatial distribution of the fluorescent OI 1.317m emission. In this scenario, the average geometrical enhancement of the line-of-sight depth into the Bar versus the face-on depth is about 5. Finally, Neufeld et al. (2006) find that a geometrical enhancement factor of 4 is required to reconcile observed and predicted C+ column densities.
The 3 upper limit to the face-on O2 column density can thus be inferred from our line-of-sight values to be 1.510sin cm-2, or 1.010sin cm-2 for 100 K. (We note that these upper limits are derived assuming the intrinsic O2 FWHM line width is 2.5 km s-1; if the intrinsic width is closer to the lower end of the observed range, i.e., 1.8 km s-1, the face-on O2 column density upper limits are further reduced by a factor of 1.4.) For gas densities 105 cm-3, which applies to most of the gas in the Bar, this is to be compared with a total predicted face-on O2 column density of 71015 cm-2, as shown in Fig. 6, with most of this column occurring inside a layer of peak O2 abundance with a width corresponding to approximately 2 magnitudes (see Fig. 7), or a linear size of 1.91016/ cm, where (H2)/[105 cm-3]. Viewed from a distance of 420 pc, this zone of peak O2 emission would subtend 3[(1/ + 162.4sin]′′, where is the physical length of the Bar in parsecs. For 0.6 pc (cf. Jansen et al., 1995) and 1, 6o would result in O2 emission that fills the Herschel/HIFI beam at 774 GHz, though a minimum geometric enhancement factor of 4, derived from other observations, suggests that does not exceed 15o. However, these tilt angles imply an upper limit to the face-on O2 column density between 1.61015 cm-2 and 3.91015 cm-2, which is below, and in some cases, significantly below that predicted by theory.
For 0.6 pc and 1, but 6o, the O2 layer no longer fills the 774 GHz beam. Although the peak O2 column density within the beam will continue to increase for angles less than 6o, the beam filling factor will decrease. These two effects offset exactly, and the beam-averaged O2 column density will remain the same for all tilt angles less than about 6o. Since the O2 emission is optically thin, the line emission will likewise remain constant within the under-filled beam. In this case, the geometrical enhancement factor would be 10, and the upper limit to the face-on O2 column density remains below that predicted. Therefore, we conclude that Bar geometry cannot account for the discrepancy between theory and observations.
What, then, can account for the discrepancy? The amount of O2 produced in externally FUV-illuminated dense gas depends on several factors, which we examine below:
Thermal evaporation: As noted earlier, the dwell time of an O atom on a grain surface can have a considerable effect on the O2 abundance, particularly when this time becomes less than the time to combine with an H atom on the surface. The timescale for thermal evaporation of an O atom is approximately 910-13 exp [800 K / ] seconds, where 800 K is the adsorption energy of O to water-ice (Hasegawa & Herbst, 1993) that applies to van der Waals binding to a chemically saturated surface. It is possible that the binding energy is greater than 800 K, which would increase the grain temperature, and thus the , required to thermally desorb O atoms on short timescales and produce the jump in the total O2 column density for 500 seen in Fig. 6. If, for example, the O adsorption energy was 1600 K, grains as warm as 42 K – the expected dust temperature at high AV in a 104 field – would, on average, retain their O atoms long enough to form H2Oice, thus delaying the 500 rise in O2 column density seen in Fig. 6 until 104.
Photodesorption yield of H2O from a grain surface, Y: The abundance (and column density) of O2 depends on the gas-phase abundance of O and OH, the latter being produced primarily through the photodissociation of H2O, much of which is either photodesorbed from grains or produced via the dissociative recombination of gas-phase H3O+. At high (and 20 K), short O-atom dwell times on grains suppress the formation of OHice and H2Oice. However, even though it is not formed on the grain surface in a high- environment, H2O formed in the gas phase via H3O+ dissociative recombination will be depleted through freezeout onto grains and will remain locked in H2Oice for as long as 100 K. Since the quantity of OH and H2O returned to the gas phase as a consequence of H2Oice photodesorption scales with , the total O2 column density likewise scales with , as is seen in Fig. 6. A value for less than 10-3 would help to reconcile theory and observation. However, fits to the SWAS and Odin H2O data (Hollenbach et al., 2009) as well as theoretical simulations and laboratory measurements (Andersson & van Dishoeck, 2008; Arasa et al., 2011; Westley et al., 1995a, b; Öberg et al., 2009) suggest, if anything, that the appropriate value of is greater than 10-3.
Grain cross-sectional area (per H): The equilibrium O2 abundance in the AV range of maximum O2 abundance scales as (), where is the grain cross-sectional area per H nucleus. Therefore, lowering will decrease the O2 column density, bringing model and observation into closer agreement. For an “MRN” (Mathis et al., 1977) grain size distribution , where is the grain radius, 210-21 cm2 for an assumed gas-to-dust mass ratio of 100 with grains ranging in radii between a minimum, , of 20 Å and a maximum, , of 2500 Å (the standard value in Hollenbach et al. 2009). Grains with 20 Å will be cleared of ice mantles by single photon heating or cosmic rays and, thus, are not significant ice reservoirs. Because (, in order to lower the value of while preserving the total mass in grains, either or both and must increase, such as through coagulation. For example, a reduction in , and thus the face-on O2 column density, by at least a factor of 2 could be achieved if the minimum grain radius were to increase to 80 Å.
Alternately, the buildup of an ice mantle, which can increase the radius of grains by as much as 50 Å, will increase the value of . For values of of 104 applicable to the Orion Bar, grain temperatures are expected to be 40 K, which is high enough to inhibit ice formation via surface reactions (absent a higher O adsorption energy); however, water formed in the gas phase via the reaction H3OH2OH can still freeze out and form an ice mantle. Toward Orion, there is evidence for a departure from the assumed gas-to-dust mass ratio of 100, which is consistent with the buildup of ice mantles (see, for example, Goldsmith, Bergin, & Lis, 1997). In addition, there is evidence for a deficiency in small grains and for grain growth, possibly due to radiation pressure, the preferential evaporation of small grains, and coagulation (e.g., Cesarsky et al., 2000; Pellegrini et al., 2009; Shaw et al., 2009). The net effect of lowering through these processes, and increasing through the accumulation of an ice mantle, is unclear in a high- environment like the Orion Bar.
Beam position: For an interclump H2 density between 5104 cm-3 and 5105 cm-3 and 104, the peak O2 abundance is predicted to occur at a face-on depth into the cloud corresponding to an AV8 (see Fig. 7). Thus, the linear distance from the AV0 surface, which we assume is the prominent ionization front, to the depth of peak O2 abundance is 7.61021/(H2) cm. For an assumed distance of 420 pc, the angular separation between the ionization front and the position of peak O2 abundance (and column density) is then 1.5 AV/[(H2)/105] arcseconds, where AV is the face-on depth of the O2 peak abundance in magnitudes. Thus, an interclump H2 density of 105 cm-3 should produce O2 emission that peaks 12′′ from the ionization front and close to the center of the observed sky positions (see Fig. 1). However, if the interclump density is more than a factor of 2 different from 105 cm-3 – values that remain within the range of density estimates for the interclump medium – then the peak O2 abundance is predicted to fall to either side of the observed beam center position.
Finally, we note that the inferred peak line-of-sight H2 column density, (H2), applicable to the interclump medium toward the Orion Bar is estimated to be 6.51022 cm-2 (Hogerheijde, Jansen, & Van Dishoeck, 1995). If the geometrical enhancement factor is 10, as would be the case for a tilt angle 5.5o, this would imply a face-on H2 column density of 6.51021 cm-2, corresponding to a total AV through the Bar of about 7. If the face-on extinction through the Orion Bar is indeed this low, then the attenuation of the 104 field is not sufficient to allow O2 to reach its peak abundance and the total O2 column density will be less than predicted by Hollenbach et al. (2009), whose total column densities are based upon cloud depths corresponding to AV10. This is illustrated in Fig. 7, which shows both the profile of O2 abundance versus AV and the cumulative O2 column density to a given AV, computed using the model described in Hollenbach et al. (2009) for the conditions appropriate to the Bar interclump medium. At a depth corresponding to an AV of 7, the predicted face-on O2 column density remains 31014 cm-2, well below the limits set here.
The clumps known to exist within the Bar do possess higher H2 densities (i.e., 106 – 107 cm-3) and column densities (i.e., 1023 cm-2; Lis & Schilke, 2003) and would provide the necessary FUV shielding to allow O2 to reach its full predicted abundance. Such conditions help to reconcile observation and theory in two ways. First, as shown in Fig. 6, the predicted total O2 column densities decrease with higher H2 densities. Thus, the total O2 column density is predicted to be lower if the O2 emission arises primarily from within the dense clumps rather than the surrounding lower density interclump medium. Second, interferometric observations indicate that the dense clumps within the Bar typically subtend angles of between 4′′ and 8′′ (see, for example, Lis & Schilke, 2003), and thus provide a natural explanation for why the beam filling factor of O2 emission could be less than unity. However, whether the correct explanation for what we observe is that O2 emission originates preferentially within the dense clumps, and is suppressed within the AV 7 interclump medium, and with both gas components governed by the processes described in Hollenbach et al. (2009), will depend on how well this model reproduces the wealth of new lines being detected toward the Orion Bar by Herschel.
6 SUMMARY
1. We have conducted a search for O2 toward the Orion Bar, carrying out deep integrations around the frequencies of the 3– 12 and 5– 34 transitions at 487 GHz and 774 GHz, respectively. Neither line was detected, but sufficiently sensitive limits on their integrated intensities were obtained to test current models of molecular gas exposed to high fluxes of FUV radiation – i.e., 104. In particular, we infer a total face-on O2 column density of 41015 cm-2, assuming a Bar geometry in which the line-of-sight depth is more than 4 times greater than its face-on dimension. This column density is at least 2 times less than that predicted by the model of Hollenbach et al. (2009) for the densities, temperatures, and appropriate to the Orion Bar.
2. The discrepancy between the model predictions and our observations would be reduced, if not eliminated, if the adsorption energy of atomic oxygen to wate-ice were greater than 800 K, and possibly as high as 1600 K. A lower value for the photodesorption yield for H2O would help, but is not supported by fits to other astronomical data or recent theoretical calculations and laboratory measurements. A lower grain cross-sectional area per H, such as might occur through grain coagulation, radiation pressure, or the preferential destruction of small grains, would lower the O2 column density, but it is unclear whether these grain properties apply within the Orion Bar.
3. If the total face-on depth of the interclump medium within the Orion Bar corresponds to an AV 7, then photodissociation will reduce the O2 column density to values below our detection limit. Clumps embedded within the Bar would offer sufficient shielding to enable the buildup of higher O2 abundances and column densities in accord with model predictions, while the small filling factor of these clumps would reduce the O2 line flux to levels consistent with our upper limits.
4. If the total face-on depth of the interclump medium within the Orion Bar corresponds to an AV8, it remains possible that most of the O2 emission may have been missed. In particular, since the gas density affects the angular separation between the ionization front and the face-on depth into the Bar at which the O2 abundance is predicted to peak, interclump H2 densities much different than the assumed value of 105 cm-3 could result in the position of peak O2 abundance and column density occurring to either the northwest or southeast of the position we selected.
Only further modeling, including predictions for other species, can establish which, if any, of the above possibilities is most likely to resolve the present puzzle.
HIFI has been designed and built by a consortium of institutes and university departments from across Europe, Canada and the United States under the leadership of SRON Netherlands Institute for Space Research, Groningen, The Netherlands, and with major contributions from Germany, France and the US. Consortium members are: Canada: CSA, U. Waterloo; France: CESR, LAB, LERMA, IRAM; Germany: KOSMA, MPIfR, MPS; Ireland, NUI Maynooth; Italy: ASI, IFSI-INAF, Osservatorio Astrofisico di Arcetri-INAF; Netherlands: SRON, TUD; Poland: CAMK, CBK; Spain: Observatorio Astronómico Nacional (IGN), Centro de Astrobiologá (CSIC-INTA). Sweden: Chalmers University of Technology - MC2, RSS & GARD; Onsala Space Observatory; Swedish National Space Board, Stockholm University - Stockholm Observatory; Switzerland: ETH Zurich, FHNW; USA: Caltech, JPL, NHSC. We also acknowledge the effort that went into making critical spectroscopic data available through the Jet Propulsion Laboratory Molecular Spectroscopy Data Base (http://spec.jpl.nasa.gov/), the Cologne Database for Molecular Spectroscopy (http://www.astro.uni-koeln.de/cdms/ and Müller et al. 2005) and the Leiden Atomic and Molecular Database (http://www.strw.leidenuniv.nl/moldata/ and Schöier et al. 2005). Finally, it is a pleasure to acknowledge useful discussions with Dr. Edwin Bergin.
Support for this work was provided by NASA through an award issued by JPL/Caltech.
References
- Allers et al. [2005] Allers, K.N., Jaffe, D.T, Lacy, J.H., Draine, B.T., Richter, M.J. 2005, Ap. J., 630, 368
- Andersson & van Dishoeck [2008] Andersson, S., & van Dishoeck, E.F. 2008, A&A, 491, 907
- Arasa et al. [2011] Arasa, C., Andersson, S., Cuppen, H.M., van Dishoeck, E.F., & Kroes, G.J. 2011, J. Chem. Phys., 134, 164503
- Batrla & Wilson [2003] Batrla, W., & Wilson, T. L. 2003, A&A, 408, 231
- Cesarsky et al. [2000] Cesarsky, D., Jones, A. P., Lequeux, J., & Verstraete, L. 2000, A&A, 358, 708
- de Graauw et al. [2010] de Graauw, T., et al. 2010, A&A, 518, L6
- Drouin et al. [2010] Drouin, B. J., Yu, S., Miller, C. E. et al. 2010, JQSRT, 111, 1167
- Goicoechea et al. [2011] Goicoechea, J.R., Joblin, C., Contursi, A., Berné, O., Cernicharo, J., Gerin, M., Le Bourlot, J., Bergin, E.A., Bell, T.A., Röllig, M. 2011, A&A, 530, L16
- Goldsmith, Bergin, & Lis [1997] Goldsmith, P. F., Bergin, E. A., & Lis, D. C. 1997, Ap. J., 491, 615
- Goldsmith & Langer [1978] Goldsmith, P. F., & Langer, W.D. 1978, Ap. J., 222, 881
- Goldsmith et al. [2011] Goldsmith, P. F., Liseau, R., Bell, T. A., et al. 2011, Ap. J., 737, 96
- Gorti & Hollenbach [2002] Gorti, U., & Hollenbach, D.J. 2002, Ap. J., 573, 215
- Habing [1968] Habing, H. J. 1968, Bull. Astron. Inst. Netherlands, 19, 421
- Hasegawa & Herbst [1993] Hasegawa, T. I., & Herbst, E. 1993, M.N.R.A.S., 261, 83
- Herrmann et al. [1997] Herrmann, F., Madden, S. D., Nikola, T., Poglitsch, A., Timmermann, R., Geis, N., Townes, C. H., & Stacey, G. J. 1997, Ap. J., 481, 343
- Hirota et al. [2007] Hirota, T., et al. 2007, Publ. Astron. Soc. Japan, 59, 897
- Hogerheijde, Jansen, & Van Dishoeck [1995] Hogerheijde, M. R., Jansen, D. J., & Van Dishoeck, E. F. 1995, A&A, 294, 792
- Hollenbach et al. [2009] Hollenbach, D.J., Kaufman, M. J., Bergin, E.A., & Melnick, G.J. 2009, Ap. J., 690, 1497
- Jansen et al. [1995] Jansen, D.J., Spaans, M., Hogerheijde, M.R., Van Dishoeck, E.F. 1995, A&A, 303, 541
- Kim et al. [2008] Kim, M. K., et al. 2008, Publ. Astron. Soc. Japan, 60, 991
- Lique [2010] Lique, F. 2010, J. Chem. Phys., 132, 044311
- Lis & Schilke [2003] Lis, D. C., & Schilke, P. 2003, Ap. J., 597, L145
- Lis et al. [2010] Lis, D. C., Pearson, J. C., Neufeld, D. A., et al. 2010, A&A, 521, L9
- Liseau et al. [2012] Liseau, R., Goldsmith, P. F., Larsson, B., et al. 2012, submitted
- Mathis et al. [1977] Mathis, J. S., Rumpl, W., & Nordsieck, K. H. 1977, Ap. J., 217, 425
- Marconi et al. [1998] Marconi, A., Testi, L., Natta, A., & Walmsley, C. M. 1998, A&A, 330, 696
- Menten et al. [2007] Menten, K. M., Reid, M. J., Forbrich, J., & Brunthaler, A. 2007, A&A, 474, 515
- Müller et al. [2005] Müller, H. S. P., Schöder, F., Stutzki, J., & Winnewisser, G. 2005, J. Mol. Struct., 742, 215
- Neufeld, Lepp, & Melnick [1995] Neufeld, D. A., Lepp, S., & Melnick, G. J. 1995, Ap. J. Suppl., 100, 132
- Neufeld et al. [2006] Neufeld, D. A., Schilke, P., Menten, K. M., Wolfire, M. G., Black, J. H., Schuller, F., Müller, H. S. P., Thorwirth, S., Güsten, R., & Philipp, S. 2006, A&A, 454, L37
- Neufeld et al. [2011] Neufeld, D. A., Roueff, E., Snell, R. L. et al. 2011, submitted to Ap. J.
- Öberg et al. [2009] Öberg, K. I., Linnartz, H., Visser, R., & van Dishoeck, E. F. 2009, Ap. J., 693, 1209
- O’Dell & Wong [1996] O’Dell, C. R., & Wong, S. K. 1996, A. J., 111, 846
- Ott [2010] Ott, S. 2010, ASP Conf. Ser. 434, Astronomical Data Analysis Software and Systems XIX, ed. Y. Mizuno, K. I. Morita, & M. Ohishi (San Francisco, CA: ASP), 139
- Pellegrini et al. [2009] Pellegrini, E. W., Baldwin, J. A., Ferland, G. J., Shaw, G., & Heathcote, S. 2009, Ap. J., 693, 285
- Pickett et al. [1998] Pickett, H. M., Poynter, R. L., Cohen, E. A., Delitsky, M. L., Pearson, J. C., & Müller, H. S. P. 1998, ”Submillimeter, Millimeter, and Microwave Spectral Line Catalog,” J. Quant. Spectrosc. & Rad. Transfer, 60, 883
- Roelfsema et al. [2012] Roelfsema, P. R., Helmich, F. P., Teyssier, D., et al. 2012, A&A, 537, A17
- Schöier et al. [2005] Schöier, F. L., van der Tak, F. F. S., van Dishoeck, E. F., & Black, J. H. 2005, A&A, 432, 369
- Shaw et al. [2009] Shaw, G., Ferland, G. J., Henney, W. J., Stancil, P. C., Abel, N. P., Pellegrini, E. W., Baldwin, J. A., & van Hoof, P. A. M. 2009, Ap. J., 701, 677
- Sternberg & Dalgarno [1995] Sternberg, A. & Dalgarno, A. 1995, Ap. J. Suppl., 99, 565
- Simon et al. [1997] Simon, R., Stutzki, J., Sternberg, A., & Winnewisser, G. 1997, A&A, 327, L9
- Walmsley et al. [2000] Walmsley, C. M., Natta, A., Oliva, E., & Testi, L. 2000, A&A, 364, 301
- Westley et al. [1995a] Westley, M. S., Baragiola, R. A., Johnson, R. E., & Baratta, G. A. 1995a, Nature, 373, 405
- Westley et al. [1995b] Westley, M. S., Baragiola, R. A., Johnson, R. E., & Baratta, G. A. 1995b, Planet. Space Sci., 43, 1311
- Wyrowski et al. [1997] Wyrowski, F., Schilke, P., Hofner, P., & Walmsley, C. M. 1997, Ap. J., 487, L171
- Young Owl et al. [2000] Young Owl, R. C., Meixner, M. M., Wolfire, M., Tielens, A. G. G. M., & Tauber, J. 2000, Ap. J., 540, 886
TABLE 1. Summary of Observations
| Gaussian Fit Parameters | ||||||||
| Rest | Observing | Integration | T | LSR Line | Integrated | |||
| Species | Transition | Frequency1 | Mode 2 | Time | Amplitude | Center | FWHM | Intensity |
| (GHz) | (hrs) | (K) | (km s-1) | (km s-1) | (K-km s-1) | |||
| H2Cl+ | 111 – 000 | |||||||
| F3/2 – 3/2 | 485.413 | sc | 1.16 | 0.055 | 10.56 | 2.47 | 0.15 | |
| F5/2 – 3/2 | 485.418 | sc | 1.16 | 0.076 | 10.56 | 2.47 | 0.20 | |
| F1/2 – 3/2 | 485.421 | sc | 1.16 | 0.030 | 10.57 | 2.47 | 0.08 | |
| SO+ | 21/2 – 19/2 | 486.837 | sc | 1.85 | 0.029 | 10.77 | 2.28 | 0.07 |
| 1/2, e | ||||||||
| SO+ | 21/2 – 19/2 | 487.212 | sc | 1.85 | 0.027 | 10.99 | 1.86 | 0.05 |
| 1/2, f | ||||||||
| O2 | 33 – 12 | 487.249 | sc | 1.85 | 0.008 3 | – | – | – |
| CS | 10 – 9 | 489.751 | sc | 0.46 | 0.46 | 10.58 | 1.78 | 0.87 |
| 13CO | 7 – 6 | 771.184 | sp | 1.15 | 27.04 | 10.67 | 2.24 | 64.48 |
| O2 | 54 – 34 | 773.840 | sc, sp | 10.91 | 0.007 3 | – | – | – |
| C2H | N9 – 8 | 785.802 | sc, sp | 10.91 | 0.34 | 10.76 | 2.35 | 0.84 |
| 19/2 – 17/2 | ||||||||
| F9 – 8 | ||||||||
| C2H | N9 – 8 | 785.865 | sc, sp | 10.91 | 0.30 | 10.77 | 2.35 | 0.75 |
| 17/2 – 15/2 | ||||||||
| F9 – 8 | ||||||||
| C17O | 7 – 6 | 786.281 | sc, sp | 10.91 | 1.19 | 10.62 | 1.76 | 2.23 |
1 NRAO-recommended rest frequency. 2 sc: spectral scan observation; sp: single point observation.
3 3 upper limit.