A Multiwavelength Study of Evolved Massive Stars in the Galactic Center
Abstract
The central region of the Milky Way Galaxy provides a unique laboratory for a systematic, spatially-resolved population study of evolved massive stars of various types in a relatively high metallicity environment. We have conducted a multi-wavelength data analysis of 180 such stars or candidates, most of which were drawn from a recent large-scale HST/NICMOS narrow-band Paschen- survey, plus additional 14 Wolf-Rayet stars identified in earlier ground-based spectroscopic observations of the same field. The multi-wavelength data include broad-band infrared (IR) photometry measurements from HST/NIC2, SIRIUS, 2MASS, Spitzer/IRAC, and X-ray observations from Chandra. We correct for extinctions toward individual stars, improve the Paschen- line equivalent width measurements, quantify the substantial mid-IR dust emission associated with WC stars, and find X-ray counterparts. In the process, we identify 10 foreground sources, some of which may be nearby cataclysmic variables. The WN stars in the Arches and Central clusters show correlations between the Paschen- equivalent width and the adjacent continuum emission. However, the WN stars in the latter cluster are systematically dimmer than those in the Arches cluster, presumably due to the different ages of the two clusters. In the equivalent width-magnitude plot, WNL stars, WC stars and OB supergiants roughly fall into three distinct regions. We estimate that the dust mass associated with individual WC stars in the Quintuplet cluster can reach , or more than one order of magnitude larger than previous estimates. Thus WC stars could be a significant source of dust in the galaxies of the early universe. Nearly half of the evolved massive stars in the Galactic center are located outside the three known massive stellar clusters. The ionization of several compact HII regions can be accounted for by their enclosed individual evolved massive stars, which thus likely formed in isolation or in small groups.
1 Introduction
Massive stars play an important role in galaxy formation and evolution. They are a primary source of ionizing photons, radiation pressure, mechanical energy, and chemical enrichment of the interstellar medium (ISM). When a massive star reaches its evolved stage (off the main sequence; MS hereafter), such feedback has its greatest impact, profoundly shaping the local and possibly even galactic environment.
Stellar evolution theories, though with significant uncertainties, suggest that there are several phases through which a very massive star with an initial mass should evolve between leaving the MS and exploding as a supernova. Depending on initial stellar mass and metallicity, the sequence of evolutionary stages might be: O (MS) OB supergiant LBV (luminous blue variable) or Ofpe/WN9 (also known as WN10-11; Smith et al., 1994; Bohannan & Crowther, 1999) WN WC SNIb/SNIc (Langer et al., 1994; Crowther et al., 1995; Crowther, 2007). WN and WC represent two main classes of Wolf Rayet (WR) stars: the spectrum of a WN star is characterized by strong emission lines of nitrogen (N) relative to He, whereas a WC star exhibits strong carbon lines (C). These two classes are further divided into early (WN2-5: WNE and WC4-6: WCE) and late (WN7-9: WNL and WC7-9: WCL) types. In particular, the WCL and WNL types seem to be favored in a high metallicity environment (Hadfield et al., 2005). The emission lines are believed to arise from optically-thin stellar winds, which can also produce a flat free-free continuum strong enough to flatten the stellar spectral shape in the mid-IR (Wright & Barlow, 1975; Mauerhan et al., 2010a). In addition, significant dust emission is often found around WCL stars (Crowther, 2003) and makes them very red in the mid-IR (e.g., Tuthill et al. 2006). The spectra of Ofpe/WN9 stars are similar to those of OB supergiants, but show strong He emission lines. Stars in the LBV phase experience sporadic, giant eruptive activities and are much rarer than WR stars. Thus the LBV phase should be very short. Much is yet to be learned to quantify the strong feedback from these classes of evolved massive stars (EMSs) as well as their evolution and relative populations.
Existing studies of EMSs are very much limited by small sample sizes. Because of their short lifetimes, EMSs are found abundant only in starburst regions. However, even in nearby nuclear starburst galaxies such as M83 (Hadfield et al., 2005), such regions cannot be adequately resolved to identify individual EMSs, especially if they are in compact massive stellar clusters. Local Group galaxies are mostly in relatively quiescent states; large samples of EMSs have to be collected from diverse regions having different star formation histories and environments. Such samples are not suitable for a statistical study of EMSs (e.g., to determine their evolutionary dependence on initial stellar mass and metallicity). For example, in the solar/super-solar metallicity range, beyond the Milky Way, only M31 has been studied and just 48 WRs have been found in the whole galaxy (Massey, 2003).
The Galactic center (GC) of the Milky Way (8.0 , Ghez et al., 2008) provides an excellent laboratory for a systematic study of EMSs with a apparent super-solar metallicity ( solar; Martins et al., 2007; Martins et al., 2008). Within the central 200 pc radius, the GC accounts for about 10% of the ionizing photons (Figer et al., 2004) and 25% of the entire WR population in the Galaxy (Mauerhan et al., 2010c). About half of the ionizing radiation from the GC is attributable to the Arches, Quintuplet and Central clusters (Lang et al., 2001). These three massive star clusters have well-determined ages (Arches: 2.5 Myr, Figer et al. 2002; Najarro et al. 2004; Martins et al. 2008, Quintuplet: 3.5 Myr, Figer et al. 1999a; Liermann et al. 2012, and Central: 6 Myr, Genzel et al. 2003; Paumard et al. 2006). Each has a total stellar mass of . They contain numerous identified EMSs, including 55 WRs, at least two LBVs, and many OB supergiants. We can thus use these clusters to study the dependence of the evolution of the EMSs on initial stellar mass and the impact that such stars have on their environment (Lang et al., 1997, 2001). In addition, dozens of emission-line stars have been identified outside these clusters (Cotera et al., 1999; Homeier et al., 2003; Muno et al., 2006; Mikles et al., 2006; Mauerhan et al., 2007, 2009, 2010a). While some of these stars were probably ejected from the clusters, others might form separately in small groups or even in isolation (Mauerhan et al., 2010a). We have recently carried out the first large-scale, high-resolution, narrow-band, Paschen- survey, using the NICMOS camera on the Hubble Space Telescope (HST) (Wang et al., 2010). In addition to the confirmation of the bulk of the known EMSs, the survey has led to the new detection of 80 stars with significant excess emission in the 1.87 band, which contains the H Paschen- and several He lines (Dong et al., 2011). These emission line stars should mostly be EMSs with strong stellar winds; MS stars and evolved low mass stars typically show absorption lines in their spectra. Indeed, follow-up spectroscopic observations have already confirmed 20 of the stars as EMSs such as WRs, LBVs and OB supergiants (Mauerhan et al., 2010b, c); most of the other emission-line stars are fainter and are yet to be observed spectroscopically. By now, nearly 100 WR stars have been spectroscopically identified in the central 200 pc (Mauerhan et al., 2010c). This sample is dominated by the late type WN/WC stars. In contrast, Westerlund 1 ( 4.5 Myr, Crowther et al., 2006), another massive star formation region in the Galactic Disk, contains only 24 WR stars and half of the 16 WN stars are early-types (WN5-6). This difference is consistent with the higher metallicity of the GC than the Wd 1. Therefore, the detections and identifications of the massive stars in the GC now provide us with an excellent sample of EMSs or their candidates to study their individual and statistical properties and to infer relationships among the various types in a high metallicity environment. Furthermore, EMSs are prominent signposts for recent massive star formation. From the study of the EMS populations in the GC, one can learn about the star formation mode, dynamics, and history in an extreme Galactic nuclear environment, which is characterized by high gas temperature/density, strong magnetic field and tidal force (Morris & Serabyn, 1996).
Here we report a multiwavelength analysis of EMSs in the GC. We describe the multiwavelength data and the sample selection in § 2, including the new extinction correction and Paschen- emission equivalent width (EW) calculation of the sample stars. In § 3, we present the near-IR, mid-IR and X-ray as well as emission line properties of the stars. In § 4, we discuss the nature of the stars and their implications for the population, formation mode and history of massive stars. We summarize our results in § 5. Table 1 lists all the acronyms and abbreviations used in this paper.
2 Sample Selection and Multiwavelength Data
2.1 Sample Selection
Table 2 lists 180 sources included in the present study; 152 of them are from a primary list of the so-called Paschen--emitting sources (PESs) uniformly identified in the HST/NICMOS survey (Dong et al., 2011). The identifications are based on the large m to m flux ratios of these sources (, and are the intensities at 1.87 and 1.90 m, F187N, Paschen-, on the Paschen- line, F190N, on the adjacent continuum). This ratio describes the Paschen- excess for each individual star. For evolved, low-mass stars, which dominate the GC in a near-IR survey, this ratio is insensitive to the exact stellar type (with % variation) and should instead trace foreground extinction (Dong et al., 2011). The local ratios () towards different lines-of-sight are defined as the median average flux ratios of the closest 101 stars. All of the identified PESs (except for some of the foreground stars, see section 3.2) have ‘significant Paschen- excess’, , where includes both statistical and systematic photometric uncertainties of the ratio measurements. is the signal-to-noise of the flux ratio of each source above the local ratio. Unfortunately, within the three clusters, this survey can be problematic in isolating individual stars, because of the limited spatial resolution of the NIC3 camera used for the survey. Its pixel size is 0.2″, which undersamples the PSF (FWHM = 0.17″ at 1.90 m). The large local background in the cluster cores further increases the photometric uncertainty () and hence decreases the detection sensitivity, which may partly explain why more than ten previously known WR stars in the Central cluster were not detected in our survey (Dong et al., 2011). Therefore, in Dong et al. (2011), we also gave a secondary PES catalog, which includes the sources with 3.54.5. Compared to the primary catalog, this secondary catalog should include more spurious identifications. This catalog is only useful in the star clusters, in which we already know that there are many evolved massive stars, since some of the massive stars would not be included in the primary catalog because of the unusually high mentioned above (Dong et al., 2011).
Instead of using the secondary catalog to select the PESs in the three massive star clusters, we further refine the PES detection in the core regions of the Arches and Central clusters, utilizing archival HST/NIC2 F187N and F190N observations (Programs # 7250 and 7364). By using the NIC2 data with its smaller pixel scale (0.074″), we can improve the photometric accuracy of the massive stars in these crowded regions. The basic parameters of these two sets of NIC2 observations are listed in Table 3. We reduce the data in the same way as was done in our survey (Dong et al., 2011). In particular, we use the IDL program ‘Starfinder’ (Diolaiti et al., 2000) to detect the sources and to obtain their photometry with the PSF empirically extracted from bright stars within the same observation. We use Eqn. (1) of Dong et al. (2011) to estimate the photometric uncertainty of the detected sources, including the Poisson fluctuations and the local background noise, as well as the uncertainty of the photometric calibration of individual filters. The undersampling uncertainty for NIC2 data is neglected, because it is expected to be far less severe than for NIC3 data. With the improvements in the detection limit, in addition to updating the photometries of the detected PESs (including the separation of one source, ID 122, in Table 3 of Dong et al. 2011 into two separate stars, E48 and E51, as listed in Paumard et al. 2006), we find three and ten new PESs in the Arches and Central clusters, respectively (Table 2), which are not reported by Dong et al. (2011, their Table 3).
We also include 14 WC stars within our survey region that were identified by other spectroscopic observations, but are still not detected in our survey as significant PESs (MP1-MP14 in Table 2; ; references for these stars are listed there).
The completeness of our survey has been discussed in our previous paper (Dong et al., 2011). Briefly, the typical 50% detection limit is shown to be about 17 mag, although it can be as high as 15.5 mag in the Central cluster region. With the NIC2 data used in the present work, the detection limit is further improved to 18.5 mag in the cluster regions. Because most of the 180 sources are significantly brighter than their local detection limits, we conclude that our EMS sample is nearly complete over the bulk of the survey field, except in regions with exceptionally high extinctions.
2.2 Broad-band Near-Infrared Data
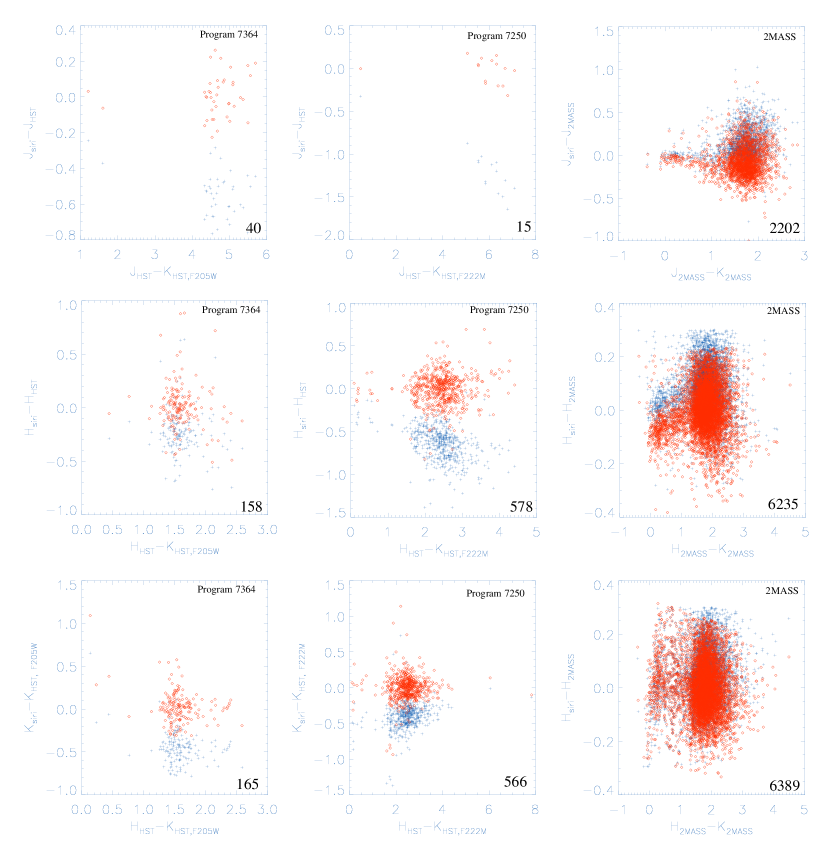
Three broad-band near-IR data sets are used: 1) HST snapshot observations of the Arches, Quintuplet and Central clusters (Programs 7250, 7364, 7222 and 9457), 2) SIRIUS (Nagayama et al., 2003), and 3) 2MASS (Skrutskie et al., 2006). The HST observations were targeted on the three clusters and their local background fields. Program 7364 utilized NIC2 to map the Arches and Quintuplet clusters with three broad-band filters (F110W, F160W and F205W): the covered fields are 1.4 (a total of 14 pointings) and 2.0 (20 pointings), respectively. The Central cluster was mapped with one NIC2 (Program 7222) and four NIC3 pointings (Program7250) using F160W and F222M (covering a field of 2.8 ). The medium filter (F222M) was used to avoid the saturation problem. There were also several HST/NIC2 observations with F110W pointed toward a few diverse fields within the Central cluster from Programs 7222 and 9457. All of our PESs in the three clusters have counterparts in these broad-band observations. But they cover only about 1.5% of our HST/NICMOS Paschen- GC survey field.
We thus use the SIRIUS and 2MASS catalogues for those PESs not covered by the HST broad-band observations 111Simultaneous 3-color InfraRed Imager for Unbiased Surveys (SIRIUS) was taken by the Infrared Survey Facility (IRSF) in South Africa, with a pixel scale of 0.45″ (Nagayama et al., 2003). The survey includes the region 2 degree and 1 degree, with an angular resolution 1.2″ in the J band, better than that of 2MASS, 2″. . SIRIUS covers our entire sample field in J (centered at 1.25 m), H (1.63 m) and Ks (2.14 m). For a few bright PESs, which are saturated in SIRIUS, we adopt the corresponding broad-band magnitudes (J: centered at 1.24 m, H: 1.66 m and Ks: 2.16 m) provided by 2MASS (Skrutskie et al., 2006). We identify the closest broad-band source as the counterpart of each PES with a matching radius of 0.1″. We also examine the individual matches by eye to make sure that the counterparts between the three catalogs are real matches.
We convert the photometries of these catalogues into a common standard to facilitate a systematic analysis. Fig. 1 shows the transmission curves of the different systems in various filters. The filter response curves of the HST are much wider than those of the ground-based systems. We obtain approximate magnitude conversions using counterparts, or the closest sources in two different catalogs with offsets less than 0.2″. For HST and SIRIUS, considering their much different filter systems, we first use a very crude match selection criterion: each source pair has a K-band magnitude difference less than 2 magnitudes. The H and Ks filters of SIRIUS and 2MASS are very similar; we thus use a tighter criterion, requiring the Ks magnitude difference to be less than 0.3. We then utilize least-squares fits to obtain the first-order color-dependent conversions to the SIRIUS magnitude system, and a clipping to remove the outliers. This clipping effectively removes the SIRIUS sources with multi HST counterparts within the search radius, even in crowded regions such as the Central cluster. Finally, we use least-squares fits again on the remaining source pairs to derive the following conversions:
| (1) | |||
| (2) | |||
| (3) | |||
| (4) | |||
| (5) | |||
| (6) | |||
| (7) | |||
| (8) | |||
| (9) |
Fig. 2 compares the HST/NICMOS, 2MASS and SIRIUS magnitudes before and after these conversions. The numbers of sources used to derive the equations above are also marked in each panel of Fig. 2. Table 2 includes the J, H and Ks magnitudes of the PESs, all in the SIRIUS photometric system.
2.3 Extinction Corrections
Using the broad-band near-IR magnitude measurements, we improve our extinction correction for the PESs. In contrast to the use of the statistically constructed extinction map detailed in Dong et al. (2011), here we directly estimate the extinction along the sightlines toward individual PESs, based on the J-H and/or H-Ks colors, if available.
Table 4 lists the intrinsic colors, (J-H)0 and (H-Ks)0, adopted for the PESs. The large dispersion in the (H-Ks)0 distribution of WR stars is mainly because their Ks-band intensities can be substantially contaminated by the free-free emission from their strong stellar winds and/or the surrounding dust thermal emission. For those PESs with no available spectroscopic identifications, we simply adopt the mean values obtained for O [(J-H)-0.11 and (H-Ks)-0.1] and WR stars [(J-H)0=0.02 and (H-Ks)0.19] (see Table. 4): (J-H)-0.045 and (H-Ks) 0.045, the uncertainties of which include the color differences of O and WR stars.
Following Nishiyama et al. (2006), we adopt the relative extinction coefficients for the broad-band filters (J, H and Ks) of SIRIUS toward the GC as ::=1:0.573:0.331. Assuming a single power law for the extinction curve between H and Ks, we then obtain the slope, =2.02, =1.271, =1.306 and
| (10) | |||
| (11) | |||
| (12) |
The definition of was given in § 2.1.
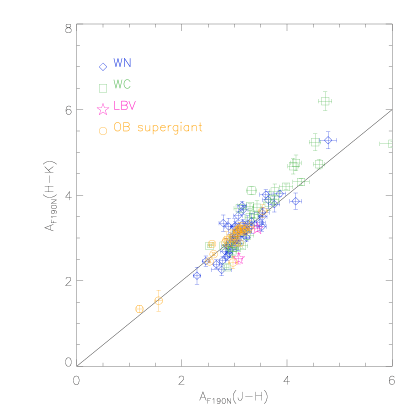
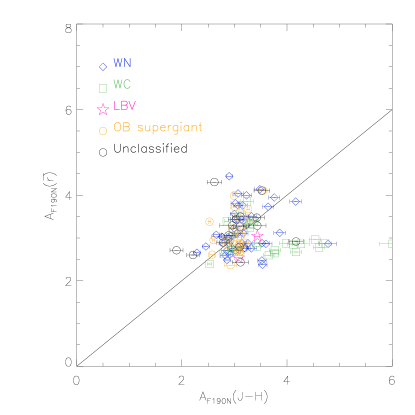
Fig. 3a compares the values obtained from Eqns. 10 and 11 for the PESs with available J, H and Ks measurements and known stellar types. The mean difference between (J-H) and (H-Ks) is 0.010.03 for OB supergiants, 0.020.04 for WN stars, and 0.160.09 for WC stars. For WC stars, (H-Ks) is overestimated because of the contamination by hot dust emission (§ 3.4) in Ks. Therefore, we use only (J-H) to represent the foreground extinction of WC stars. For other PESs, we generally adopt the mean of (J-H) and (H-Ks). But for PESs with no J measurement, we adopt (H-Ks), if available; otherwise, we just use the extinction from Eq. 12, which represents the local average extinction (Dong et al., 2011). In Fig. 3b, we compare the values derived from Eq. 10 and Eq. 12 for the PESs with available J and H magnitudes, excluding the ten potential foreground stars identified in § 3.2. The similar extinctions derived from these two equations (-(J-H)=-0.10.07) suggest that most of these PESs are indeed within the GC. The extinctions so obtained are listed in Table 2.
2.4 Paschen- Equivalent Widths
We recalculate the Paschen- equivalent widths (EWs)
for those stars with improved
magnitude and extinction measurements. The calculations follow
the formula:
| (13) |
where and are the extinction-corrected fluxes of the PESs in the F187N and F190N bands, 0.191 is the effective FWHM of the F187N filter, and 1.015 represents a typical F187N to F190N continuum flux ratio, which is obtained for a K0III star and is insensitive to the exact stellar type, as long as there is no absorption lines in F187N (Dong et al., 2011). The EWs for the PESs are listed in Table 2.
2.5 Mid-Infrared Data
To further examine the dust emission from the PESs, particularly WC stars, we include the mid-IR measurements from the Spitzer/IRAC GALCEN survey (Stolovy et al., 2006). We use a search radius of 1″ to find the IRAC counterpart of each PES. Because of the limited spatial resolution of the IRAC camera, most of the EMSs within the cores of the Arches and Central clusters do not have mid-IR measurements. The mid-IR magnitudes of the PESs in the 3.6, 4.5, 5.4 and 8.0 m bands are included in Table 2. The photometric uncertainties in the GALCEN source catalog are systematically underestimated by a factor of about 5 in the 3.6 and 4.5 µm bands222see http://www.astro.wisc.edu/sirtf/glm2_galcen_comparison.pdf. Therefore, we correct for the uncertainties from the GALCEN catalog by this factor.
2.6 Spectral Energy Distribution Analysis
We conduct a simple spectral energy distribution (SED) fit to characterize the dust emission typically associated with WC stars. In our sample, 16 WC stars have available photometries in the six bands: , , , , [3.6] and [4.5]. We adopt the extinction laws provided by Nishiyama et al. (2006) and Indebetouw et al. (2005), to correct for the extinction in each of the six bands, scaled to (: : : : =2.38:1.36:0.79:0.43:0.34). Zero points of 835.6, 280.9, 179.9 Jy are used to convert the magnitude into flux for F190N, [3.6] and [4.5].333http://www.stsci.edu/hst/nicmos/performance/photometry and Spitzer/IRAC instrument handbook, Table 4.1 As suggested by Mauerhan et al. (2010a), because the photometry of SIRIUS and 2MASS are similar (Nishiyama et al., 2008), the zero points for the J, H and Ks magnitudes of the 2MASS system are used for sources in the SIRIUS catalog (for which we find no zero point information). Five of these WC stars (P28, P34, P60, P94, P101) have relatively blue colors (Ks-[3.6]2) and do not show evidence for surrounding dust (those without ’d’ in their type definition; Table 2). We first normalize the flux measurements of each of these WC stars to and then median-average them to construct a “dust-free” SED template, which should include any potential free-free emission from the stellar winds as well as the emission emerging from the stellar atmospheres of these sources. The uncertainties of the median-average SED in the six bands are less than 20%. We fit the SED of the other 11 WC stars with this template, plus a diluted blackbody to characterize hot dust emission with an emissivity proportional to , =, in units of Jy, where is the normalization factor and (Goudfrooij & de Jong, 1995) (see Fig. 4).
2.7 X-ray Measurements
We utilize the measurements made by the deep Chandra ACIS survey (Muno et al., 2009) to search for X-ray counterparts of the PESs. The matching radius used is the smaller of 3 (where is the X-ray source positional uncertainty) and 2 (which is used to reduce the source confusion). To estimate the probability for chance positional coincidences, we repeat the same matching procedure after each of eight systematic shifts of the X-ray source positions (i.e., the matches were actually done on a grid of [-5″, 0″, 5″], [-5″, 0″, 5″]). The mean number of chance positional coincidences in the eight shifts is found to be 7.5, which mostly occur in the core regions of the three clusters. Outside the clusters, the number of chance positional coincidences is only 1.8.
Table 5 lists 35 PESs with X-ray source counterparts. In addition to the source IDs listed in Muno et al. (2009), the table also includes X-ray source positional uncertainty (), 0.5-8 keV fluxes and hardness ratios (see the note to the table). P122a and P122b, members of the IRS 13 compact stellar complex (Maillard et al., 2004), are just 0.3″ apart (compared to the Chandra on-axis FWHM 0.5″) and are listed to have the same X-ray source counterpart.
Most of these PES/X-ray source matches should represent genuine counterparts. Table 5 includes the percent probability (P) for each PES/X-ray source match to be genuine. The probability was calculated by Mauerhan et al. (2009) using a match radius that is the quadrature sum of the positional uncertainties of the Chandra and SIRIUS measurements. Those matches studied previously (Muno et al., 2006; Mikles et al., 2006; Mauerhan et al., 2010a) all have high probabilities ( 20 %), except for P147 (partly because of its large positional uncertainty: 0.9″). Because of saturation in the SIRIUS observation, the source P38, which was identified in our HST survey (Dong et al., 2011), was not listed in Table 3 of Mauerhan et al. (2009), and therefore does not have an existing ‘P’ value. Mauerhan et al. (2009) also did not match any X-ray sources to the four PESs in the Central cluster (P123, P125, P158 and P161 in Table 5), because the SIRIUS catalog suffers from confusion in this crowded region. However, these sources are known WR stars (Paumard et al., 2006). Four other PES/X-ray sources (P105, P108, P133 and P139) have low ‘P’ (15%) and have not yet been spectroscopically classified. Therefore, whether they are real matches remains uncertain (see also § 4).
3 Results
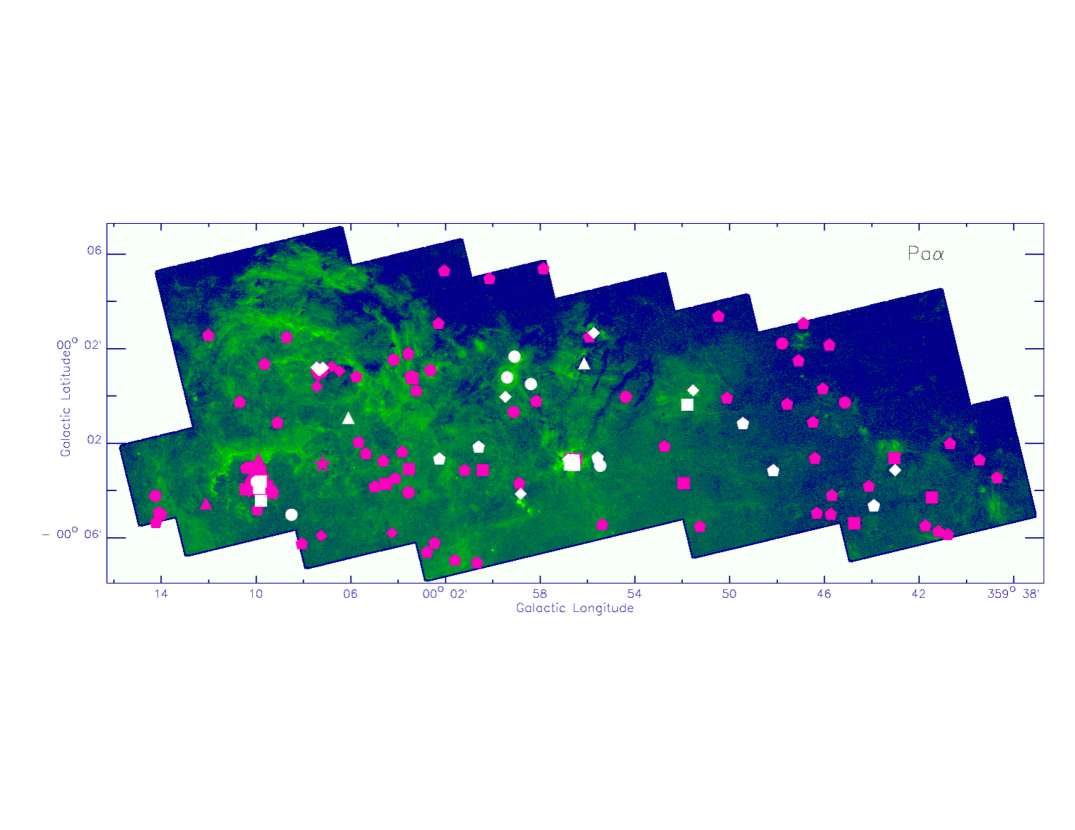
The locations of our 180 sample PESs are marked on the Paschen- mosaic image of the GC in Fig. 5. A total of 30, 17 and 33 of the sources are located within 2 of the Quintuplet, Arches and Central clusters, respectively; the cluster radius, , of each cluster is from Table 5 of Figer et al. (1999a) (Quintuplet: 1pc, Arches: 0.19 pc, Central: 0.23 pc) 444The core radii of the Arches and Central clusters are consistent with recent work: Arches: 0.140.05 pc (Espinoza et al., 2009) and Central: 0.220.04 pc (Schödel et al., 2007). The tidal radius (1 pc) of the Arches cluster derived from dynamical simulations (Kim et al., 1999; Portegies Zwart et al., 2002) is larger. Using this latter radius, two additional PESs (P17 and P79) would be classified to be within the Arches cluster, which, however, would not qualitatively affect our results and conclusions.. We refer to these sources as ‘cluster’ PESs and to the remaining 100 PESs as ‘field’ ones.
3.1 Foreground Extinction Properties
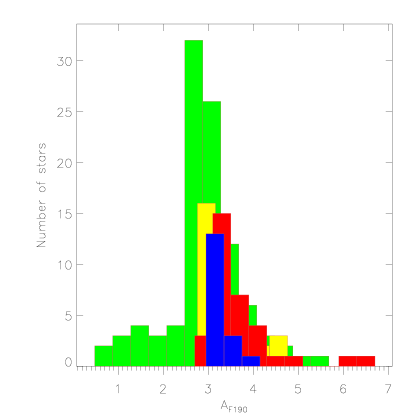
The extinction distributions of the PESs in different regions are depicted in Fig. 6. The means (standard deviations) of are 3.32(0.56), 3.20(0.24), 3.71(0.80) and 2.98(0.89) for the Quintuplet, Arches, Central and ‘field’ PESs, respectively. The relatively large dispersion for the Central cluster PESs is largely due to the exceptionally large extinctions of MP7 (E31, WC9) and MP10 (E58, WC5/6, with no available J-band measurement; Table 2), most likely due to the extra extinction of their circumstellar dust. Excluding these two sources reduces the mean and standard deviation to 3.55 and 0.5. In general, the PESs within the individual clusters have very similar extinctions. The corresponding (standard deviation) for the Quintuplet, Arches and Central clusters are 2.61(0.44), 2.52(0.19) and 2.79(0.39), which are consistent with existing measurements: 3.1 (0.5, Liermann et al., 2010), 2.13-4.14 (Espinoza et al., 2009) and 2.54 (0.12, Schödel et al., 2010), respectively.
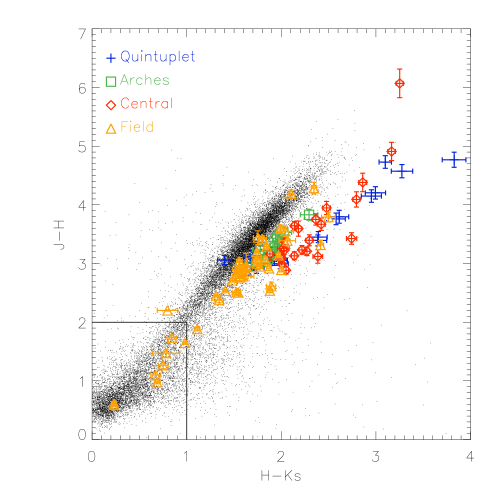
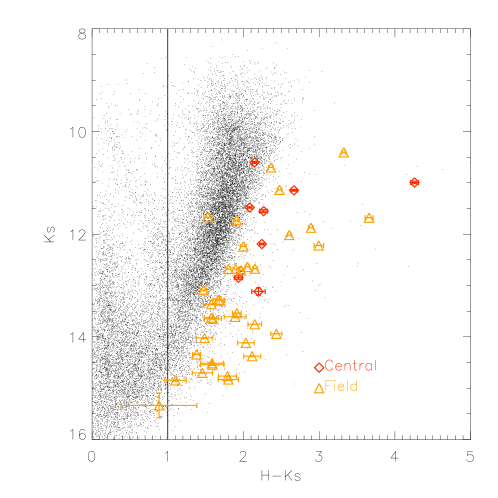
Fig. 7 shows the J-H vs. H-Ks and Ks vs. H-Ks diagrams. The color-color plot contains 119 PESs with both J-H and H-Ks measurements, while the color-magnitude diagram is used for the 45 PESs with only H-Ks colors. Most of the PESs are located in the ranges of H-Ks and J-H. In Fig. 7, we also plot all of the stars in the SIRIUS catalog, which are mainly low mass giants, plus foreground MS stars. They should typically have similar intrinsic near-IR colors (on the Rayleigh-Jeans side of the SED). Therefore, the observed colors of such stars should trace the expected reddening path. In contrast, the PESs show colors that can be significantly redder than the path (e.g., up to 1-2 mag in H-Ks), apparently a result of enhanced emission at long wavelengths, due to free-free and/or hot dust emission. The remaining 16 PESs do not have H or Ks measurements.
3.2 Identification of Foreground Stars
The above extinction properties of the PESs can help us identify/confirm stars that are in the foreground of the GC. We find that nine stars have H-Ks 1 and J-H (if available), including the two foreground OB supergiants suggested by Mauerhan et al. (2010c). Table 6 includes the extinction-corrected F190N magnitudes and updated values (see § 2.1) of these foreground PESs. Four of them (P27, P102, P140 and P149) still have significant F187N excesses, with . Although the values of the remaining five PESs are now , they may still be foreground emission-line stars. For example, P38, with the second smallest revised , spectroscopically exhibits several emission lines around 2.112-2.115 m and is identified by Mauerhan et al. (2010c) as an O4-6I star at a distance of 3.6 kpc.
The nine foreground PESs can be divided into two groups according to their extinction-corrected F190N magnitudes. The first consists of P38, P140 and P145, which have comparable foreground extinctions and intrinsic brightnesses. As both P38 and P140 are EMSs, we suggest that P145 is likely to be as well. The other six PESs form the second group. They are a factor of at least fainter and have comparable or smaller (but within a factor of ) extinctions, compared to those in the first class, indicating that they are typically closer and substantially dimmer by more than mag than P38, for example. According to Figer (1995) and Crowther et al. (2006), even the dimmest WR (-2.63) is no more than a factor of 10 fainter than the first group sources. Therefore, we suspect that the PESs in this second class are not EMSs (such as WR and OB supergiants) and are probably cataclysmic variables (CVs), which often show hydrogen emission lines (Dhillon & Marsh, 1995). CVs usually contain low-mass MS secondaries () with MKs in the 2-9 mag range (Fig. 9 of Hoard et al., 2002). Therefore, with the extinction taken into account, only relatively nearby CVs (up to a distance of kpc) can be detected in our survey.
When X-ray counterparts are available, their spectral properties can also be used to check the consistency of the identifications and even to provide clues to the nature of the sources. Table 5 summarizes the 35 matches between the PESs and known X-ray sources. Most of these matches have been examined with previous ground-based near-IR observations, and have been suggested to be massive colliding-wind binaries within the GC (except for P38; Mauerhan et al. 2010c). The X-ray hardness ratio HR0 is often used to distinguish foreground sources from those at the GC (e.g., Mauerhan et al. 2010a, c). Muno et al. (2009) suggested that a source with HR0 -0.175 probably has a distance less than 4 kpc. There are four such EMSs, including P38, consistent with its foreground star identification. P145 also has a soft spectrum, consistent with being a foreground massive star, according to its near-IR color above. The statistical uncertainties in the HR0 values for P109 and P138 are too large to provide useful constraints. For example, the red near-IR color of P109 () indicates that it could be within the GC, instead of a foreground source.
The nine stars with blue near-IR colors in Table 6, plus one soft X-ray star (P138), are excluded from the discussion to follow, which focuses on the EMSs within the GC.
3.3 Continuum and Paschen- Emission Properties of GC EMSs
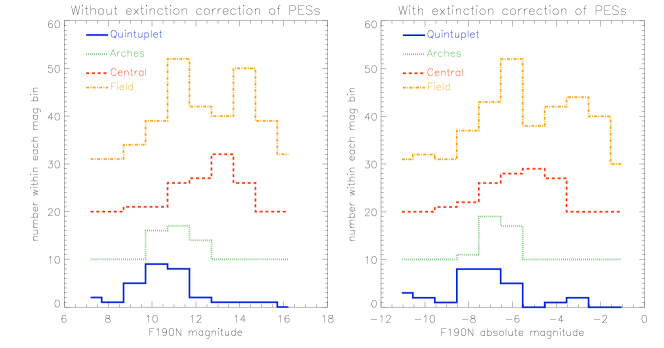
We present the F190N magnitude distributions of our 170 GC EMSs in Fig. 8. The distribution becomes increasingly broad from the Arches (2.5 Myr old), Quintuplet (4 Myr old), to Central (6 Myr old) clusters. There are also systematic magnitude differences among the distributions, which may be characterized by their mean F190N magnitude (standard deviation): -6.21(0.58), -6.93(2.09) and -5.26(1.33) for the Arches, Quintuplet and Central clusters, respectively. The unusually large displacement of the Quintuplet cluster from the other distributions may be due to the presence of several very bright stars () due to substantial contamination by circumstellar dust emission: mainly one LBV and the five Quintuplet proper members (QPMs, dusty WCs), which have unusually red colors (Figer et al., 1999a; Liermann et al., 2009). Excluding these six stars, the mean would decrease to -6.18(1.55). The standard deviation further decreases to 0.85, after the three dim stars with are removed. On the other hand, the stars in the Central cluster are fainter by 1-2 magnitudes. This offset is consistent with the results derived from the observations (Figer et al., 2002; Paumard et al., 2006) and is at least partly due to the larger age of the Central cluster. Therefore, the magnitude distribution shift in general seems to be linked to the age of a cluster.
The magnitude distribution of ‘field’ sources spans a wide range and is possibly double-peaked. About 50% (46) of the ‘field’ sources have absolute 1.90 m magnitudes similar to those in the three young clusters, while the other half are considerably fainter. Compared to those in the bright peak, the mean extinction of the PESs in the dimmer peak is smaller by 0.4 magnitude, which cannot explain the large magnitude difference between these two peaks ( 2 mag).
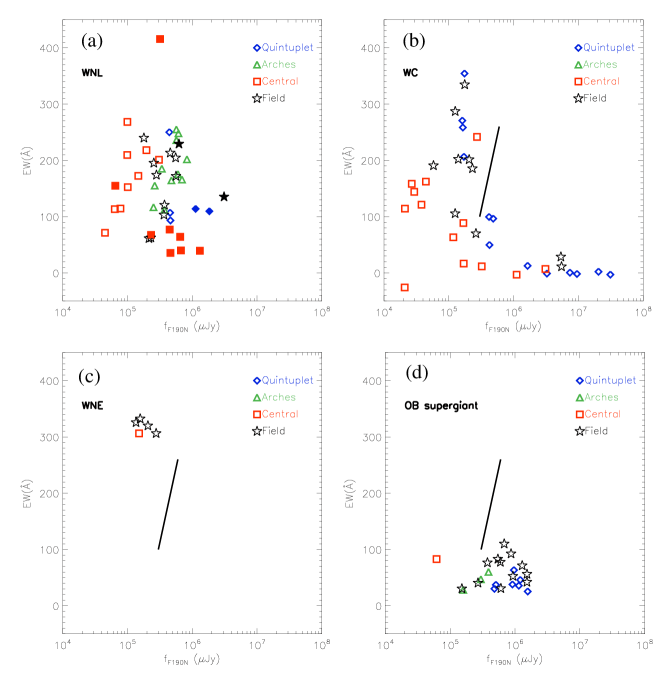
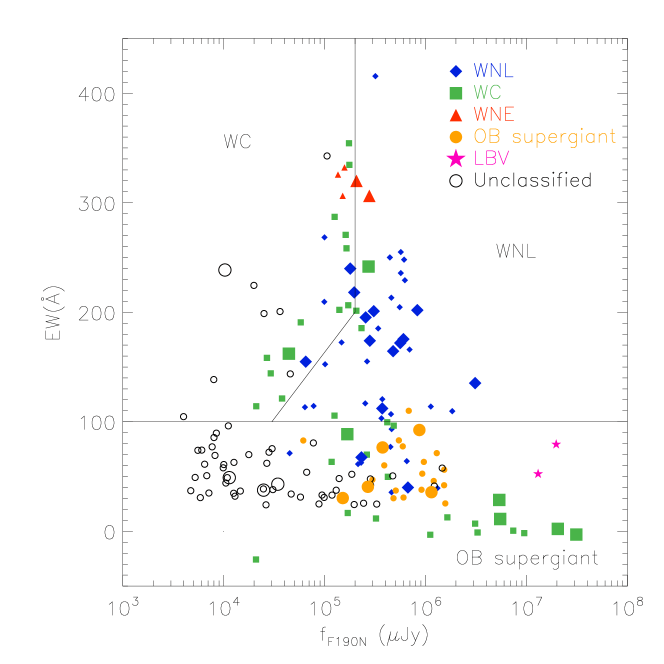
Fig. 9 presents an EW vs. plot for the PESs with identified stellar types in different regions. The stellar types are identified from previous ground-based spectroscopic observations (Table 2). WNL stars in the Arches cluster (triangles) show an apparent linear relation between the EW and the stellar luminosity, as already demonstrated by Figer et al. (2002). They pointed out that this relation is expected from radiation-driven stellar winds. A similar linear relationship seems to hold for WNL stars in the Central cluster, excluding the Ofpe/WN9 stars (filled squares). But these WNL stars are systematically dimmer by a factor of 5 than those in the Arches cluster (see § 3.3 and Fig. 8), implying that the EW is determined by not only the luminosity, but also the stellar age. The three WNL stars in the Quintuplet cluster are more similar to those in the Arches cluster, than to the Central cluster. In Fig. 9, most of ‘field’ WNL stars (‘star’ symbol) are located between the Arches and Central clusters. However, ‘Ofpe/WN9’ stars seem to be distributed differently and have substantially smaller EWs () than WNL stars of similar . Both the Quintuplet and Central clusters are rich in WC stars, with a broad EW range. The three WC stars in the Quintuplet with EW 250 (P12, P13, P60, which are all WC8) have strong HeI (2.059 m) and HeII (2.19 m) in their near-IR Ks-band spectra (Figer et al., 1999a; Liermann et al., 2009). But many WC stars have very weak line emission, which explains why 14 WC stars are not identified in our PES survey (see § 2). Five of them are the QPMs, indicating that their stellar photospheres are completely blanketed by dust. Most of the OB supergiants also have very small EWs, indicative of their weaker stellar winds.
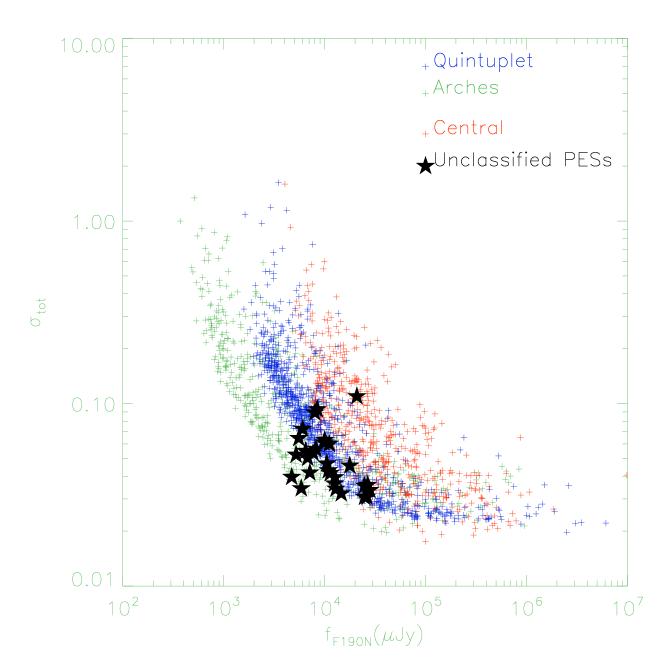
In the three clusters, no EMS is detected to have and EW at the same time. This is likely due to the relatively high flux detection limit in the cluster fields due to crowding. Fig. 10 shows the photometric uncertainty (see § 2.1) vs. distribution of the detected sources within the three clusters, compared with the unclassified ‘field’ EMSs, which have low and EWs (we use instead of to avoid the effects of the differential foreground extinction). Because of the high local stellar background, the photometric uncertainty in the Central cluster is much higher than those in the Arches and Quintuplet clusters. The photometric uncertainty for the Quintuplet cluster (which only has the low resolution of NICMOS/NIC3 F187N/F190N data) is also larger than that in the Arches cluster (for which NIC2 data are used; § 2.1). Therefore, the non-detection of the analogue of the field EMSs, which have relatively low brightness and EWs, in the Quintuplet and Central clusters could be due to their large . In the case of the young Arches cluster, however, massive stars are still mostly on the MS, except for a few very massive ones () that may have just turned into bright WNL stars or OB supergiants.
3.4 Dust Emission in the Mid-IR
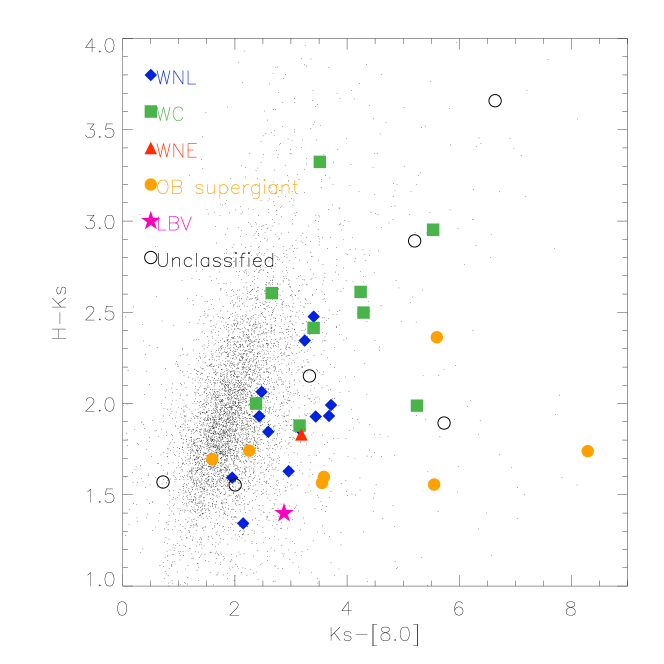
We present a color-color diagram for the 36 EMSs with available H, Ks and [8.0] magnitude measurements in Fig. 11. Limited by the angular resolution of Spitzer/IRAC (2″), these PESs are all in the ‘field’, although a few of them are located at the peripheries of the Quintuplet and Arches clusters. Most of the WN stars and OB supergiants are only slightly redder in Ks-[8.0] than average field stars. The three OB supergiants (P35, P100, P112) that have unusually red color () are all associated with local, strong, extended Paschen- features, so their [8.0] flux density is presumably dominated by Polycyclic Aromatic Hydrocarbon (PAH) emission. While all WN stars are constrained to [2,4], a significant number of WC stars have very red Ks-[8.0] color. Six of the nine WC stars with red Ks-[8] (3) in Fig. 11 have been suggested to be associated with hot dust (Mauerhan et al., 2010a, c; Liermann et al., 2009; Figer et al., 1999a).
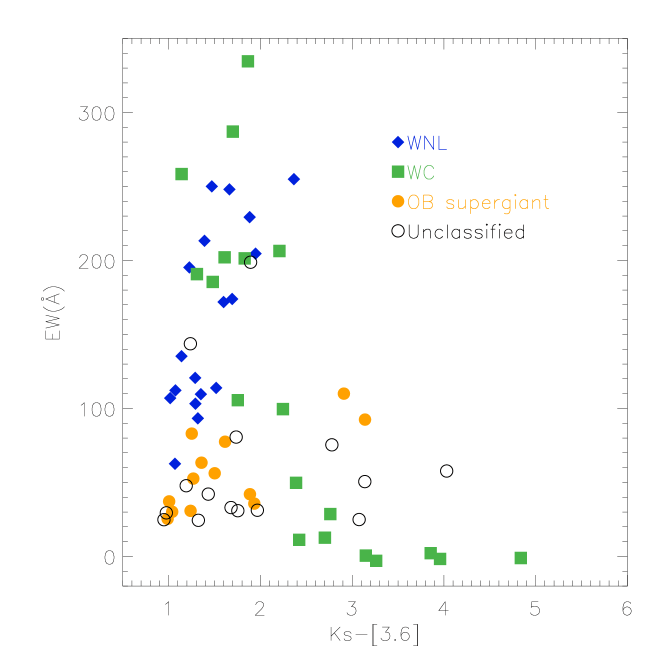
Fig. 12 shows an EW vs. Ks-[3.6] plot for 68 EMSs. We can see that WNL stars/OB supergiants and WC stars seem to follow different trends. For WNL stars, the EW increases with Ks-[3.6]. But, the trend is opposite for WC stars, at least for those with low EWs. The EWs of the OB supergiants show a very weak, possibly positive dependence on Ks-[3.6]. These different trends probably indicate different relative contributions from various sources of emission. The free-free emission from the strong winds of the WNL stars/OB supergiants should dominate in the mid-infrared (Wright & Barlow, 1975), resulting in the positive EW vs. Ks-[3.6] correlation. In contrast, the strong dust emission from WC stars may dilute the Paschen- line emission and dominate the mid-infrared. For example, QPMs have very red infrared spectra and appear nearly featureless. Indeed, dusty spirals have been resolved spatially around two of these WC stars based on high-resolution adaptive optics observations (Tuthill et al., 2006). The enhancement of the hot dust emission at the longer wavelengths suppresses the line contrasts. As a result, a significant fraction of WC stars may thus not be detected as PESs.
The results from the SED fits to the 11 WC stars (§ 2.6) with enhanced mid-IR emission are presented in Table 7 and Fig. 4. The combination of the “dust-free” template and the diluted dust blackbody fits the bulk of the WC stars well. For MP1, we notice that the Spitzer/IRAC source catalog includes an additional source that is only 1″ away and is detected only at 4.5 m, but not at 3.6 m. This source may thus represent a spurious detection and may have caused an underestimate of the intensity of MP1 at 4.5 m in the Spitzer/IRAC catalog. Therefore, we have excluded the 4.5 m data point from the SED fitting of MP1 in Table 7 and Fig. 4. Both the table and figure show that the dust contribution at 1.90 m varies significantly from one source to another and reaches more than 30% for the QPMs. After removing the dust contribution from the F187N and F190N flux densities, we recalculate the EWs, the results of which are also listed in Table 7. For the WC stars not detected in our survey (MP*), their EWs are increased, though still very small (30). Since dusty WC stars are presumably formed within colliding-wind binary systems (Crowther 2007, see also Tuthill et al. 2006), the presence of massive (OB MS) companions with flat spectra and even Paschen- absorption lines could also account for the low EWs. The fitted dust temperatures are in the range 550-1000 K. We derive the dust mass in these WC stars (see Table. 7) using Eqn. 2 of Goudfrooij & de Jong (1995): =, where (in units of mJy) and D (Mpc) are the specific blackbody flux at frequency and the distance to the source, respectively. In order to exclude the contamination from the stellar atmosphere at short wavelengths, we use at 4.5 , except for MP1 (at 3.6 ). The dust mass in each of the five QPMs (MP1, MP2, MP3, MP5 and MP6) is usually large, , while the other six WC stars have dust masses of order , similar to the WC stars studied in the solar neighbourhood (Veen et al., 1998; Marchenko et al., 1999).
4 Discussion
In this paper, we construct a catalog of 180 EMSs in the Galactic center region, including many identified WN, WC, LBV and OB supergiants. Based on the brightness and EW distributions of such stars, as discussed in Mauerhan et al. (2010c), this catalog should include nearly all of the WN stars in our survey area, while a significant fraction of faint WC stars may still be missing. Even in the core regions of the Arches and Central clusters, while the Paschen- survey itself may be quite incomplete because of the crowding and nebulosity, the dedicated NIC2 observations of higher spatial resolution and ground-based spectroscopic observations should have identified the bulk (if not all) of the WN stars.
Based on the above results, we can gain some insight into the nature of those still unclassified PESs, especially those outside the clusters. Fig. 13 compares the PESs with and without spectroscopic classifications in the EW vs. plot. For ease of the discussion, we empirically divide the plot into three parts, each of which is populated mainly by one single stellar type: the WNL-dominated region contains 67% of the WNL stars, the OB supergiant-dominated region contains 96% of the OB supergiants, and the WC-dominated region contains 42% of the WC stars. 53% of the WC stars with very small EWs fall into the ‘OB supergiant’ region. In Fig. 12, we find that the WC stars with red color (larger Ks-[3.6]) tend to have smaller EWs. Therefore, we propose that the SEDs of WC stars falling into the ‘OB supergiant’ region could be substantially contaminated by the thermal emission of hot circumstellar dust, which may affect the flux even at 1.90 m.
The unclassified PESs have either low EWs and/or low intrinsic brightnesses. 54 out of 67 such PESs are within the ‘OB supergiant’ region (Fig. 13). One in the Central cluster with EW= falls within a tight cluster of WNE stars in Fig. 13, and is detected in the HST/NIC2 observations, but not in the HST/NIC3 Paschen- Survey (Dong et al., 2011), because of the confusion limit in the very crowded region. The other 12 unclassified PESs are all in the ‘WC’ region.
The unclassified PESs are scattered around in the plots of Fig. 11 and Fig. 12. Their MIR properties suggest that they include sources from various subgroups, such as dusty WC stars and OB supergiants. For example, P44, P115 and P141 are very red ( and ) and are unrelated to any local diffuse emission in the Paschen- map. Therefore, they are most likely dusty WC stars. Several other unclassified PESs fall into the ‘OB supergiant’ region. Spectroscopic identification is needed to determine their exact stellar types.
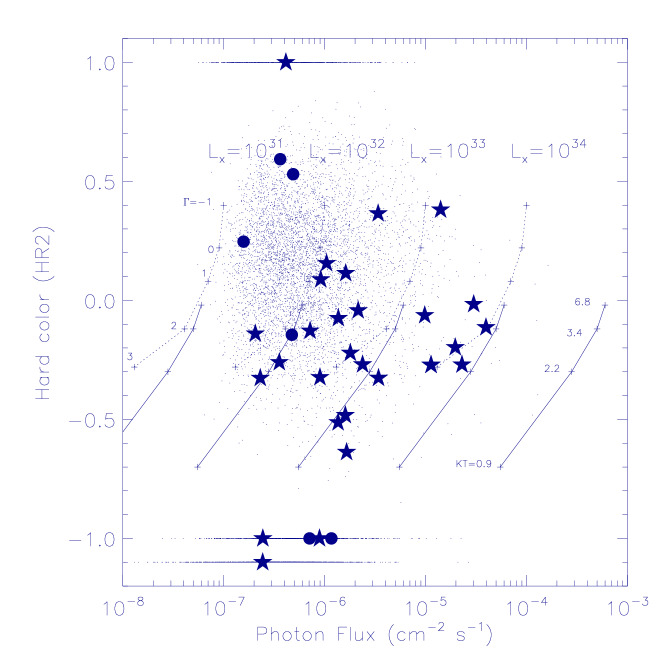
The six previously unclassified PES/X-ray source matches (Table 5) are all located outside the three clusters. They have 0.5-8 keV fluxes of 4 photons cm-2 s-1, dimmer than most of the other X-ray sources in Table 5. Because of the low signal-to-noise ratios of the sources, we only use their X-ray colors for spectral characterization. In § 3.2, HR0 values are used to check the consistency of classifying P138 and P145 as foreground stars. Fig. 14 further presents the relationship between the HR2 and the photon fluxes of these X-ray counterparts. Unlike HR0, HR2 is a measure of the spectral characteristics at relatively high energies, and is less affected by foreground extinction. As stated in Mauerhan et al. (2010a), the X-ray counterparts of the EMSs are mostly softer and brighter than the majority of the X-ray point sources toward the GC, which are typically CVs and have relatively hard spectra, with thermal temperature 2 keV. Among the six new detections, P105 and P133 have HR2 ( 0.4) similar to the other known EMSs with X-ray counterparts, suggesting that they may have a similar origin. On the other hand, P108 and P139, with relatively hard HR2 ( 0.5), fall into the CV region in Fig. 14. However, as we mentioned in § 3.2, after correcting for the distance modulus and the extinction (=2.22, Dong et al., 2011), the CVs in the GC should be dimmer than 18.7 magnitude, which is well below the source detection limit of our survey (see Fig. 14. of Dong et al., 2011). Therefore, P108 and P139 are probably unrelated to the X-ray point sources, consistent with their poor matching probability (Table 5).
The number of ‘field’ EMSs is comparable to that within the three clusters (Mauerhan, 2008; Dong et al., 2011). Fig. 8 shows that the absolute magnitude distribution of these ‘field’ EMSs is much wider than those of individual clusters and shows two peaks, perhaps suggesting two distinct episodes of star formation. The absolute magnitudes of more than half of the EMSs fall between the peaks of the Arches and Central clusters. Some of these EMSs are WNLs and are mostly located between the loci defined by WNLs within the Arches and Central clusters in the EW vs. F190N plot of Fig. 9. These facts suggest that these EMSs have ages between those of the Arches and Central clusters. The remaining fainter unclassified ‘field’ PESs are presumably older. Some of them have magnitudes comparable to those PESs in the Central cluster that are WC stars (). Therefore, some of these unclassified ‘field’ PESs could also be WCs and trace the stellar population with ages comparable to that of the Central cluster.
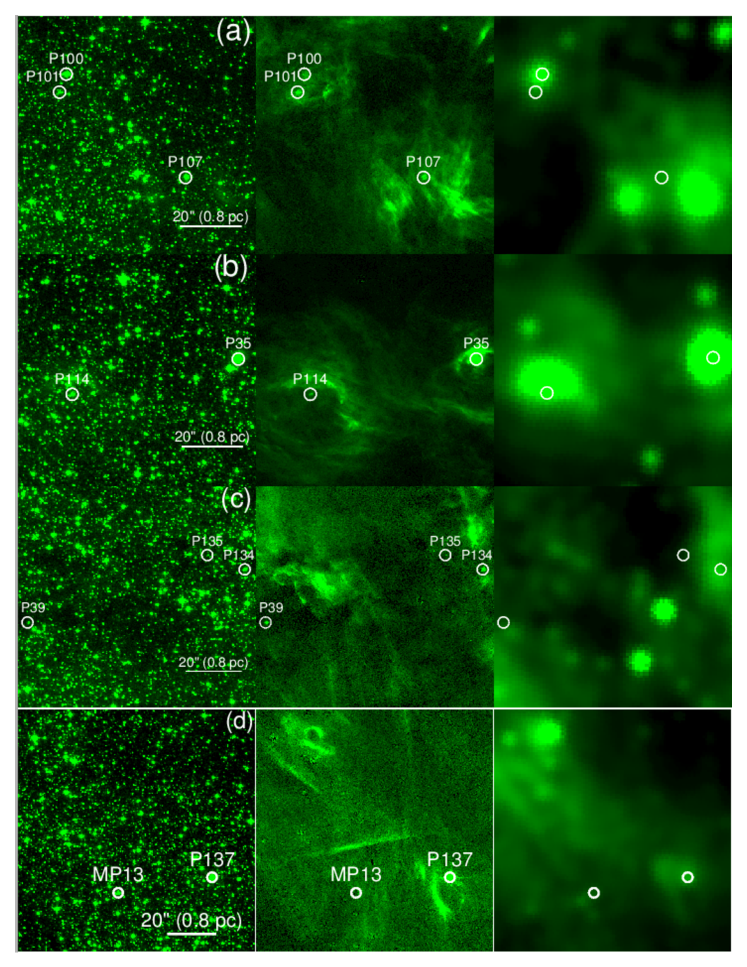
Although some fraction of the field EMSs may represent the EMSs that have been ejected from the three clusters via dynamical processes, at least some, especially those young ones, likely formed in small groups or even in isolation. Probably the most convincing evidence for this scenario is the apparent associations of a few of EMSs with local HII regions, such as H1, H2 (Zhao et al., 1993), and several others in the Galactic West of Sgr A* (Fig. 5; Fig. 15). In addition, the unusual red colors (Ks-[8.0]) of the three OB supergiants also indicate their associations with nearby molecular clouds (§ 3.4). Such associations should be mostly real; the possibility for chance coincidence of the EMSs with dense clouds is small, because the clouds have a small volume filling factor () in the GC (Oka et al., 2005). The relatively small size (25″, i.e. 1 pc, see Fig. 15) and faintness of the associated HII regions further indicate that they are ionized by small groups of massive stars or probably by the EMSs alone. The EMSs in H1, H2 and H5 are spectroscopically identified as OB supergiants. The total extinction-corrected Paschen- luminosity of the H1 and H2 regions (see Fig. 15b) is 6.1, corresponding to a total ionizing photon rate of (Scoville et al., 2001). This rate can be accounted for by the two enclosed OB supergiants (P35 and P114; each), consistent with the formation scenario that some of the field PESs formed in small groups or in isolation.
5 Summary
In this paper, we have investigated the properties of 180 PESs by using multi-wavelength observations from near-IR to X-ray. These sources have been selected using their significant intensity enhancements in the F187N narrow band, based on our HST/NICMOS survey of the GC and previous HST snapshot observations of the Arches and Central clusters. The multi-wavelength data analysis has enabled us to probe the overall spectral characteristics of individual sources, including a direct estimation (hence correction) of line-of-sight extinctions/absorptions. Our main results are as follows:
-
•
10 sources are identified to be foreground stars. While a few of them are apparently EMSs, the others with intrinsically low luminosities could be CVs.
-
•
For WNL stars, the Paschen- line EW is well correlated with the intrinsic magnitude and color Ks-[3.6], which traces the free-free emission, suggesting that the winds of the WNL are radiation-driven. However, the EW dependence on the magnitude appears to be sensitive to the stellar age.
-
•
The above correlation seems to hold for WC stars in which the Paschen- line EW is greater than about 100 Å. But those WC stars having lower EWs show anti-correlations with the magnitude and the Ks-[3.6] color, which can be explained by an increased continuum level due to the strong hot dust emission from the stellar winds.
-
•
The presence of dusty stellar winds is clearly shown in the IR SEDs of a subset of the WC sample, showing intensity upturns or peaks in the mid-IR. From the modeling of the SEDs, we estimate that the dust has a characteristic temperature of K and that each star has a dust mass in the range from to a few (see § 3.4). The upper end of this range is much higher than had previously been known for WC stars (Veen et al., 1998; Marchenko et al., 1999), which may have important implications for understanding the production of dust, especially in very young starburst galaxies at high redshifts (Dwek & Cherchneff, 2011).
-
•
We show that PESs may be roughly typed according to their positions in the EW vs. magnitude diagram. This typing works ‘best’ for WN stars. Both EW and magnitude ranges of WC stars are broad. Some WC stars have very low EWs, apparently due to enhanced continuum emission from hot circumstellar dust. They cannot be distinguished from OB supergiants based only on the EWs and magnitudes. We have tentatively assigned those unclassified PESs as dusty WC/OB supergiants. Our detection of WR stars with relatively strong Pa line emission should be quite complete. But it is possible that many Pa-faint WRs, especially WCs associated with substantial amounts of dust, remain to be detected.
-
•
Nearly half of the PESs are located outside the three clusters. The magnitude distribution of these ‘field’ sources shows two distinct peaks. One of the two peaks, containing roughly half of the sources, has a mean magnitude similar to those of the EMSs in the three clusters, while the other is substantially dimmer. The unclassified PESs in this latter peak have F190N magnitudes similar to or fainter than those of the WCs in the Central cluster. This suggests that the dimmer peak traces a stellar population with an average age similar to, or older than, that of the Central cluster.
-
•
Considering that the volume filling factor of dense clouds in the GC is very small, we suggest that a few of the field PESs are physically associated with compact HII regions (with sizes 25″ or 1 pc) and formed in situ, indicating the operation of a mode of massive star formation in small groups or even in isolation.
Acknowledgments
We are grateful to the referee, Andrea Stolte, for many valuable comments, which helped greatly in the revision of the paper. We also acknowledge the NASA support via the grant NNX11AI01G and the grant HST-GO-11120 provided by the Space Telescope Science Institute, which is operated by the Association of Universities for Research in Astronomy, Inc., under NASA contract NAS 5-26555.
References
- Blum et al. (2001) Blum, R. D., Schaerer, D., Pasquali, A., Heydari-Malayeri, M., Conti, P. S., Schmutz, W., 2001, AJ, 122, 1875B
- Bohannan & Crowther (1999) Bohannan, B., & Crowther, P. A. 1999, ApJ, 511, 374
- Cotera et al. (1999) Cotera, A. S., Simpson, J. P., Erickson, E. F., Colgan, S. W. J., Burton, M. G., Allen, D.
- Crowther et al. (1995) Crowther, P. A., Smith, L. J., Hillier, D. J., & Schmutz, W. 1995, A&A, 293, 427
- Crowther (2003) Crowther, P. A. 2003, Ap&SS, 285, 677
- Crowther et al. (2006) Crowther, P. A., Lennon, D. J., & Walborn, N. R. 2006, A&A, 446, 279
- Crowther (2007) Crowther, P. A. 2007, ARA&A, 45, 177
- Dhillon & Marsh (1995) Dhillon, V. S., & Marsh, T. R. 1995, MNRAS, 275, 89
- Diolaiti et al. (2000) Diolaiti, E., Bendinelli, O., Bonaccini, D., et al. 2000, A&AS, 147, 335
- Dong et al. (2011) Dong, H., Wang, Q. D., Cotera, A., Stolovy, S., Morris, M., Lang, C. C., Muno, M. P., Schneider, G., Calzetti, D., 2011, arXiv1105.1703
- Dwek & Cherchneff (2011) Dwek, E., & Cherchneff, I. 2011, ApJ, 727, 63
- Espinoza et al. (2009) Espinoza, P., Selman, F. J., & Melnick, J. 2009, A&A, 501, 563
- Figer (1995) Figer, D. F. 1995, Ph.D. Thesis
- Figer et al. (1998) Figer, D. F., Najarro, F., Morris, M., McLean, I. S., Geballe, T. R., Ghez, A. M., & Langer, N. 1998, ApJ, 506, 384
- Figer et al. (1999a) Figer, D. F., McLean, I. S., Morris, M. 1999, ApJ, 514, 202F
- Figer et al. (2002) Figer, D. F., Najarro, F., Gilmore, D., Morris, M., Kim, S. S., Serabyn, E., McLean, I. S., Gilbert, A., M., Graham, J. R., Larkin, J. E., 2002, ApJ, 581, 258F
- Figer et al. (2004) Figer, D. F., Rich, R. M., Kim, S. S., Morris, M., & Serabyn, E. 2004, ApJ, 601, 319
- Genzel et al. (2003) Genzel, R., et al. 2003, ApJ, 594, 812
- Ghez et al. (2008) Ghez, A. M., et al. 2008, ApJ, 689, 1044
- Goudfrooij & de Jong (1995) Goudfrooij, P., & de Jong, T. 1995, A&A, 298, 784
- Hadfield et al. (2005) Hadfield, L. J., Crowther, P. A., Schild, H., & Schmutz, W. 2005, A&A, 439, 265
- Hoard et al. (2002) Hoard, D. W., Wachter, S., Clark, L. L., & Bowers, T. P. 2002, ApJ, 565, 511
- Homeier et al. (2003) Homeier, N. L., Blum, R. D., Pasquali, A., Conti, P. S., Damineli, A., 2003, A&A, 408, 153H
- Indebetouw et al. (2005) Indebetouw, R., et al. 2005, ApJ, 619, 931
- Kim et al. (1999) Kim, S. S., Morris, M., & Lee, H. M. 1999, ApJ, 525, 228
- Koornneef (1983) Koornneef, J. 1983, A&A, 128, 84
- Lang et al. (1997) Lang, C. C., Goss, W. M., & Wood, D. O. S. 1997, ApJ, 474, 275
- Lang et al. (2001) Lang, C. C., Goss, W. M., & Morris, M. 2001, AJ, 121, 2681
- Langer et al. (1994) Langer, N., Hamann, W.-R., Lennon, M., et al. 1994, A&A, 290, 819
- Liermann et al. (2009) Liermann, A., Hamann, W.-R., Oskinova, L.M., 2009, A&A, 494, 1137L
- Liermann et al. (2010) Liermann, A., Hamann, W.-R., Oskinova, L. M., Todt, H., & Butler, K. 2010, A&A, 524, A82
- Liermann et al. (2012) Liermann, A., Hamann, W.-R., & Oskinova, L. M. 2012, arXiv:1203.2435
- Maillard et al. (2004) Maillard, J. P., Paumard, T., Stolovy, S. R., & Rigaut, F. 2004, A&A, 423, 155
- Marchenko et al. (1999) Marchenko, S. V., Moffat, A. F. J., & Grosdidier, Y. 1999, ApJ, 522, 433
- Martins & Plez (2006) Martins, F., & Plez, B. 2006, A&A, 457, 637
- Martins et al. (2007) Martins, F., Genzel, R., Hillier, D. J., Eisenhauer, F., Paumard, T., Gillessen, S., Ott, T., & Trippe, S. 2007, A&A, 468, 233
- Martins et al. (2008) Martins, F., Hillier, D. J., Paumard, T., Eisenhauer, F., Ott, T., Genzel, R., 2008, A&A, 478, 219M
- Massey (2003) Massey, P. 2003, ARA&A, 41, 15
- Mauerhan et al. (2007) Mauerhan, J. C., Muno, M. P., Morris, M., 2007, ApJ, 662, 574M
- Mauerhan (2008) Mauerhan, J. C. 2008, Ph.D. Thesis
- Mauerhan et al. (2009) Mauerhan, J. C., Muno, M. P., Morris, M. R., Bauer, F. E., Nishiyama, S., & Nagata, T. 2009, ApJ, 703, 30
- Mauerhan et al. (2010a) Mauerhan, J. C., Muno, M. P., Morris, M. R., Stolovy, S. R., & Cotera, A. 2010a, ApJ, 710, 706
- Mauerhan et al. (2010b) Mauerhan, J. C., Morris, M. R., Cotera, A., Dong, H., Wang, Q. D., Stolovy, S. R., Lang, C., & Glass, I. S. 2010b, ApJ, 713, L33
- Mauerhan et al. (2010c) Mauerhan, J. C., Cotera, A., Dong, H., Morris, M. R., Wang, Q. D., Stolovy, S. R., & Lang, C. 2010c, ApJ, 725, 188
- Mikles et al. (2006) Mikles, V. J., Eikenberry, S. S., Muno, M. P., Bandyopadhyay, R. M., Patel, S., 2006, ApJ, 651, 408M
- Morris & Serabyn (1996) Morris, M., & Serabyn, E. 1996, ARA&A, 34, 645
- Muno et al. (2006) Muno, M. P., Bower, G. C., Burgasser, A. J., Baganoff, F. K., Morris, M. R., Brandt, W. N., 2006, ApJ, 638, 183M
- Muno et al. (2009) Muno, M. P., Bauer, F. E., Baganoff, F. K., Bandyopadhyay, R. M., Bower, G. C., Brandt, W. N., Broos, P. S., Cotera, A., Eikenberry, S. S., Garmire, G. P., 2009, ApJS, 181, 110M
- Nagayama et al. (2003) Nagayama, T., Nagashima, C., Nakajima, Y., Nagata, T., Sato, S., Nakaya, H., Yamamuro, T., Sugitani, K., Tamura, M., 2003, SPIE, 4841, 459N
- Najarro et al. (2004) Najarro, F., Figer, D. F., Hillier, D. J., & Kudritzki, R. P. 2004, ApJ, 611, L105
- Nishiyama et al. (2006) Nishiyama, S., et al. 2006, ApJ, 638, 839
- Nishiyama et al. (2008) Nishiyama, S., Nagata, T., Tamura, M., et al. 2008, ApJ, 680, 1174
- Oka et al. (2005) Oka, T., Geballe, T. R., Goto, M., Usuda, T., & McCall, B. J. 2005, ApJ, 632, 882
- Paumard et al. (2006) Paumard, T., Genzel, R., Martins, F., Nayakshin, S., Beloborodov, A. M., Levin, Y., Trippe, S., Eisenhauer, F., Ott, T., Gillessen, S., 2006, ApJ, 643, 1011P
- Portegies Zwart et al. (2002) Portegies Zwart, S. F., Makino, J., McMillan, S. L. W., & Hut, P. 2002, ApJ, 565, 265
- Schödel et al. (2007) Schödel, R., Eckart, A., Alexander, T., et al. 2007, A&A, 469, 125
- Schödel et al. (2010) Schödel, R., Najarro, F., Muzic, K., & Eckart, A. 2010, A&A, 511, A18
- Scoville et al. (2001) Scoville, N. Z., Polletta, M., Ewald, S., Stolovy, S. R., Thompson, R., & Rieke, M. 2001, AJ, 122, 3017
- Skrutskie et al. (2006) Skrutskie, M. F., Cutri, R. M., Stiening, R., Weinberg, M. D., Schneider, S., Carpenter, J. M., Beichman, C., Capps, R., Chester, T., Elias, J. et al., 2006, AJ, 131, 1163S
- Smith et al. (1994) Smith, L. J., Crowther, P. A., & Prinja, R. K. 1994, A&A, 281, 833
- Stolovy et al. (2006) Stolovy, S., Ramirez, S., Arendt, R. G., Cotera, A., Yusef-Zadeh, F., Law, C., Gezari, D., Sellgren, K., Karr, J., Moseley, H., Smith, H. A., 2006, JPhCS, 54,176
- Stolte et al. (2002) Stolte, A., Grebel, E. K., Brandner, W., Figer, D. F., 2002, A&A, 394, 459S
- Tuthill et al. (2006) Tuthill, P., Monnier, J., Tanner, A., Figer, D., Ghez, A., & Danchi, W. 2006, Science, 313, 935
- Veen et al. (1998) Veen, P. M., van Genderen, A. M., van der Hucht, K. A., et al. 1998, A&A, 329, 199
- Wang et al. (2010) Wang, Q. D., Dong, H., Cotera, A., Stolovy, S., Morris, M., Lang, C. C., Muno, M. P., Schneider, G., Calzetti, D., 2010, MNRAS, 402, 895W
- Wright & Barlow (1975) Wright, A. E., & Barlow, M. J. 1975, MNRAS, 170, 41
- Zhao et al. (1993) Zhao, J.-H., Desai, K., Goss, W. M., & Yusef-Zadeh, F. 1993, ApJ, 418, 235


| CV | Cataclysmic variable |
| EMS | Evolved massive star |
| EW | Equivalent width |
| FWHM | Full width at half maximum |
| GC | Galactic center |
| HST | Hubble Space Telescope |
| IRAC | Infrared array camera |
| ISM | Interstellar medium |
| LBV | Luminous blue variable |
| MS | Main sequence |
| NICMOS | Near infrared camera and multi-object spectrometer |
| PAH | Polycyclic aromatic hydrocarbon |
| PES | Paschen- emitting source |
| QPM | Quintuplet-proper member |
| SED | Spectral energy distribution |
| SN | Supernova |
| WR | Wolf-Rayet |
| WN | Nitrogen sequence Wolf-Rayet |
| WNE | Early type Nitrogen sequence Wolf-Rayet |
| WNL | Late type Nitrogen sequence Wolf-Rayet |
| WC | Carbon sequence Wolf-Rayet |
| WCE | Early type Carbon sequence Wolf-Rayet |
| WCL | Late type Carbon sequence Wolf-Rayet |
| Name | R.A. | Dec. | Magnitude | EW | Counterpart | Type | Location | ||||||||||
|---|---|---|---|---|---|---|---|---|---|---|---|---|---|---|---|---|---|
| (J2000) | (J2000) | J | H | K | [1.87] | [1.9] | [3.6] | [4.5] | [5.4] | [8.0] | |||||||
| P1 | 266.62478 | -28.78001 | 13.4(0.02) | 12.8(0.01) | 12.6(0.02) | 12.5(0.02) | 12.6(0.02) | 0.5 | 17.0(5.0) | 5.6 | F | ||||||
| P2 | 266.59921 | -28.80299 | 16.3(0.05) | 13.3(0.01) | 11.4(0.02) | 11.1(0.02) | 12.1(0.02) | 9.9(0.06) | 9.1(0.04) | 8.9(0.03) | 8.2(0.05) | 2.8 | 332.2(12.4) | 26.7 | Mau10c_17 | WN5b | F |
| P3 | 266.51501 | -28.78606 | 17.5(0.11) | 14.1(0.04) | 12.3(0.03) | 12.9(0.02) | 13.0(0.02) | 10.5(0.07) | 10.5(0.07) | 10.1(0.05) | 3.2 | 30.9(5.4) | 4.9 | F | |||
| P4 | 266.55606 | -28.81641 | 14.6(0.02) | 11.5(0.01) | 9.8(0.02) | 10.2(0.02) | 10.5(0.02) | 8.4(0.04) | 8.0(0.04) | 7.9(0.02) | 3.2 | 63.3(6.0) | 10.3 | FQ_381 | OBI | Q | |
| P5 | 266.55408 | -28.82014 | 17.5(0.07)h | 14.4(0.06)h | 12.5(0.06)h | 13.6(0.02) | 13.8(0.02) | 3.2 | 34.0(5.7) | 5.9 | Q | ||||||
| P6 | 266.56301 | -28.82693 | 13.5(0.06)h | 10.4(0.05)h | 8.6(0.06)h | 9.1(0.02) | 9.6(0.02) | 7.3(0.09) | 6.8(0.11) | 7.0(0.06) | 2.9 | 109.7(7.1) | 15.1 | Lie_71,FQ_241 | WN9/Ofpe | Q | |
| P7 | 266.56643 | -28.82714 | 14.2(0.06)h | 11.0(0.05)h | 9.2(0.06)h | 9.7(0.02) | 10.2(0.02) | 7.7(0.10) | 7.3(0.11) | 6.9(0.04) | 3.0 | 113.9(7.2) | 15.4 | Lie_67,FQ_240 | WN9/Ofpe | Q | |
| P8 | 266.56293 | -28.82480 | 14.1(0.06)h | 11.1(0.05)h | 9.4(0.06)h | 10.0(0.02) | 10.2(0.02) | 3.1 | 45.9(5.6) | 8.1 | Lie_110,FQ_270S | O6-8 I f (Of/WN?) | Q | ||||
| P9 | 266.56312 | -28.82568 | 14.3(0.06)h | 11.2(0.05)h | 9.5(0.06)h | 10.2(0.02) | 10.3(0.02) | 7.5(0.10) | 3.2 | 35.7(5.4) | 6.2 | Lie_96,Mau10a_19 | O6-8 I f e | Q | |||
| P10 | 266.56304 | -28.82631 | 14.5(0.06)h | 11.4(0.05)h | 9.7(0.06)h | 10.4(0.02) | 10.6(0.02) | 3.2 | 37.9(5.4) | 6.7 | Lie_77,FQ_278 | O6-8 I f eq | Q | ||||
| P11 | 266.56896 | -28.82547 | 14.6(0.06)h | 11.7(0.05)h | 10.1(0.06)h | 10.5(0.02) | 10.9(0.02) | 9.1(0.22) | 8.7(0.23) | 2.8 | 107.0(7.1) | 14.9 | Lie_99,FQ_256 | WN9 | Q | ||
| P12 | 266.56323 | -28.82821 | 16.2(0.06)h | 13.1(0.06)h | 11.2(0.06)h | 11.0(0.02) | 12.2(0.02) | 3.0 | 354.4(13.2) | 26.8 | Lie_34 | WC8 | Q | ||||
| P13 | 266.56316 | -28.82761 | 16.2(0.06)h | 13.2(0.06)h | 11.2(0.06)h | 11.3(0.02) | 12.2(0.02) | 3.0 | 270.7(11.3) | 23.8 | Lie_47 | WC8 | Q | ||||
| P14 | 266.58167 | -28.83606 | 14.9(0.04) | 15.2(0.04) | 2.9b | 60.9(12.7) | 4.8 | F | |||||||||
| P15 | 266.51338 | -28.81622 | 13.2(0.05) | 11.7(0.03) | 12.3(0.02) | 12.4(0.02) | 2.6 | 33.1(5.4) | 6.4 | F | |||||||
| P16 | 266.47853 | -28.78699 | 14.6(0.03) | 13.1(0.02) | 13.4(0.02) | 13.6(0.02) | 2.5 | 38.0(5.7) | 6.8 | F | |||||||
| P17 | 266.46028 | -28.82543 | 15.8(0.07)h | 12.4(0.06)h | 10.4(0.07)h | 10.7(0.01) | 11.5(0.01) | 9.0(0.05) | 8.4(0.05) | 8.2(0.03) | 7.9(0.06) | 3.4 | 213.3(4.7) | 28.3 | FA_5,Blu01_22 | WN8-9h | F |
| P18 | 266.45712 | -28.82372 | 16.9(0.07)h | 13.0(0.06)h | 10.7(0.07)h | 11.3(0.01) | 11.9(0.01) | 7.9(0.02) | 3.8 | 164.5(4.2) | 30.6 | FA_2,Mau10a_11 | WN8-9h | A | |||
| P19 | 266.45255 | -28.82840 | 13.6(0.03) | 11.1(0.01) | 11.3(0.02) | 12.1(0.02) | 9.2(0.04) | 8.2(0.14) | 8.1(0.02) | 7.7(0.05) | 4.1 | 204.6(9.4) | 21.4 | Mau10c_11 | WN8-9h | F | |
| P20 | 266.45865 | -28.82393 | 16.4(0.07)h | 12.9(0.06)h | 10.9(0.06)h | 11.7(0.01) | 11.9(0.01) | 3.6 | 60.2(3.0) | 8.5 | FA_10,Blu01_30 | O4-6If | A | ||||
| P21 | 266.45895 | -28.82411 | 17.2(0.07)h | 13.6(0.06)h | 11.6(0.06)h | 12.4(0.01) | 12.6(0.01) | 3.5 | 52.0(2.9) | 7.7 | FA_17,Blu01_29 | A | |||||
| P22 | 266.47249 | -28.82693 | 15.4(0.02) | 12.5(0.02) | 11.0(0.01) | 11.3(0.02) | 11.6(0.02) | 2.6 | 61.4(6.0) | 10.5 | Mau10c_12 | WN8-9h | F | ||||
| P23 | 266.54169 | -28.92566 | 15.0(0.02) | 12.3(0.02) | 10.8(0.02) | 11.1(0.02) | 11.4(0.02) | 9.7(0.05) | 9.4(0.07) | 9.2(0.03) | 2.5 | 62.6(6.0) | 10.8 | Mau10c_15 | WN8-9h | F | |
| P24 | 266.50251 | -28.90761 | 15.2(0.10) | 13.6(0.06) | 14.7(0.03) | 14.9(0.03) | 2.7 | 49.0(8.6) | 5.7 | F | |||||||
| P25 | 266.49295 | -28.87223 | 13.4(0.06)t | 14.1(0.02) | 14.4(0.02) | 10.3(0.07) | 9.7(0.11) | 8.9(0.03) | 8.5(0.11) | 3.2b | 62.1(7.3) | 8.5 | F | ||||
| P26 | 266.49541 | -28.89392 | 15.5(0.07) | 13.6(0.13) | 15.3(0.04) | 15.7(0.06) | 3.2 | 89.6(19.0) | 4.6 | F | |||||||
| P27 | 266.48141 | -28.90196 | 16.2(0.10) | 15.3(0.49) | 14.9(0.03) | 15.3(0.04) | 1.5 | 81.8(11.7) | 7.5 | F | |||||||
| P28 | 266.49067 | -28.91267 | 16.3(0.03) | 13.4(0.01) | 11.4(0.02) | 11.5(0.02) | 12.2(0.02) | 9.8(0.07) | 9.1(0.06) | 8.9(0.03) | 9.0(0.11) | 2.8 | 202.1(9.3) | 21.5 | Ho2 | WC8-9 | F |
| P29 | 266.53998 | -28.95375 | 16.5(0.07) | 14.4(0.09) | 14.8(0.02) | 14.9(0.02) | 3.6 | 38.7(7.3) | 4.9 | F | |||||||
| P30 | 266.53377 | -28.97338 | 16.8(0.07) | 12.6(0.01) | 10.5(0.01) | 10.8(0.02) | 11.0(0.02) | 3.9 | 41.3(5.5) | 6.6 | F | ||||||
| P31 | 266.52612 | -28.98747 | 13.6(0.02) | 11.7(0.02) | 12.2(0.02) | 12.3(0.02) | 10.4(0.09) | 3.2 | 24.4(5.1) | 4.8 | F | ||||||
| P32 | 266.37803 | -28.87674 | 16.6(0.05) | 17.1(0.07) | 4.5b | 138.5(27.5) | 5.0 | F | |||||||||
| P33 | 266.33953 | -28.86082 | 14.0(0.02) | 14.2(0.02) | 4.0b | 53.9(6.4) | 8.1 | F | |||||||||
| P34 | 266.46061 | -28.95726 | 15.8(0.03) | 12.9(0.03) | 11.3(0.01) | 11.0(0.02) | 12.0(0.02) | 9.5(0.05) | 9.0(0.05) | 8.6(0.03) | 2.9 | 334.6(12.5) | 26.9 | Mau10c_19 | WC9 | F | |
| P35 | 266.36926 | -28.93473 | 14.5(0.02) | 11.5(0.02) | 9.7(0.03) | 10.2(0.03) | 10.6(0.02) | 6.6(0.05) | 5.2(0.03) | 3.7(0.00) | 1.4(0.00) | 3.1 | 92.5(8.6) | 10.8 | Cot_4,Mau10a_7 | Of | F |
| P36 | 266.38126 | -28.95466 | 15.1(0.02) | 12.7(0.01) | 11.4(0.02) | 11.7(0.02) | 11.8(0.02) | 2.5 | 30.3(5.3) | 6.4 | Mau10c_6 | O4-6I | F | ||||
| P37 | 266.44762 | -29.04884 | 14.5(0.08)t | 14.9(0.03) | 15.1(0.03) | 2.9b | 44.0(9.4) | 4.6 | F | ||||||||
| P38 | 266.40831 | -29.02624 | 11.1(0.05)t | 9.7(0.05)t | 8.9(0.13)t | 9.0(0.02) | 9.1(0.02) | 8.2(0.05) | 8.1(0.06) | 1.5 | 14.7(4.9) | 5.2 | Mau10c_7 | O4-6I | F | ||
| P39 | 266.34458 | -28.97893 | 15.2(0.06) | 12.2(0.03) | 12.5(0.02) | 13.4(0.02) | 4.7 | 306.3(12.0) | 24.8 | Mau10a_6 | WN5-6b | F | |||||
| P40 | 266.35029 | -29.01633 | 13.2(0.03)t | 10.4(0.04)t | 8.8(0.11)t | 9.6(0.02) | 9.7(0.02) | 6.9(0.04) | 6.2(0.03) | 5.6(0.01) | 5.2(0.01) | 2.9 | 42.0(5.5) | 7.5 | Mau10c_5 | B0I-B2I | F |
| P41 | 266.40788 | -29.10817 | 16.0(0.03) | 13.1(0.02) | 11.5(0.01) | 12.0(0.02) | 12.1(0.02) | 10.5(0.06) | 10.1(0.07) | 9.8(0.03) | 9.5(0.10) | 2.8 | 29.4(5.2) | 5.9 | F | ||
| P42 | 266.38541 | -29.08277 | 14.6(0.02) | 12.0(0.01) | 12.3(0.02) | 13.0(0.02) | 10.5(0.07) | 9.7(0.07) | 9.5(0.03) | 9.4(0.10) | 4.1 | 185.5(9.0) | 20.1 | Mau10c_8 | WC9 | F | |
| P43 | 266.30814 | -29.07728 | 15.2(0.06) | 13.6(0.06) | 15.3(0.03) | 15.6(0.04) | 2.7 | 73.9(13.0) | 5.7 | F | |||||||
| P44 | 266.25555 | -29.04208 | 14.8(0.03) | 11.9(0.02) | 12.9(0.02) | 13.1(0.02) | 8.7(0.04) | 7.6(0.03) | 7.0(0.01) | 6.7(0.01) | 4.9 | 50.6(5.8) | 6.6 | F | |||
| P45 | 266.25250 | -29.10650 | 16.6(0.11) | 14.8(0.08) | 15.5(0.03) | 15.8(0.03) | 3.0 | 50.8(10.2) | 5.2 | F | |||||||
| P46 | 266.28706 | -29.11563 | 14.9(0.05) | 13.3(0.05) | 13.6(0.02) | 13.9(0.02) | 10.5(0.10) | 10.4(0.14) | 2.8 | 75.4(6.9) | 11.1 | F | |||||
| P47 | 266.31271 | -29.15230 | 14.7(0.02) | 14.9(0.03) | 2.8b | 34.7(7.3) | 4.7 | F | |||||||||
| P48 | 266.34449 | -29.18235 | 15.4(0.03) | 15.7(0.03) | 3.1b | 69.3(11.4) | 6.0 | F | |||||||||
| P49 | 266.34120 | -29.19988 | 14.7(0.03) | 12.7(0.03) | 12.6(0.02) | 13.4(0.02) | 11.4(0.10) | 10.7(0.08) | 10.6(0.07) | 3.0 | 190.8(9.3) | 20.5 | Mau10c_3 | WC9 | F | ||
| P50 | 266.26206 | -29.14994 | 13.9(0.05)t | 11.4(0.02)t | 9.9(0.01)t | 10.4(0.02) | 10.6(0.02) | 8.6(0.04) | 8.3(0.05) | 8.3(0.02) | 2.7 | 30.8(5.2) | 5.8 | Mau10a_1 | O9I-B0I | F | |
| P51 | 266.26160 | -29.13144 | 16.1(0.10) | 14.5(0.12) | 14.4(0.02) | 14.6(0.02) | 2.7 | 36.7(6.4) | 5.7 | F | |||||||
| P52 | 266.22865 | -29.11919 | 16.6(0.10) | 14.8(0.06) | 14.9(0.02) | 15.1(0.02) | 3.0 | 32.0(6.8) | 5.0 | F | |||||||
| P53 | 266.27944 | -29.20018 | 16.8(0.07) | 13.5(0.02) | 11.1(0.03) | 11.7(0.02) | 12.1(0.02) | 8.0(0.04) | 7.7(0.02) | 7.7(0.04) | 3.3 | 70.0(6.2) | 11.1 | Mau10c_2 | WC9?d | F | |
| P54 | 266.24580 | -29.22798 | 15.9(0.08) | 13.8(0.05) | 14.2(0.02) | 15.0(0.02) | 11.9(0.18) | 3.7 | 198.8(11.4) | 17.2 | F | ||||||
| P55 | 266.24935 | -29.26869 | 14.9(0.01)t | 12.7(0.00)t | 11.9(0.11)t | 14.5(0.02) | 14.6(0.02) | 1.8 | 30.7(6.7) | 5.1 | F | ||||||
| P56 | 266.61499 | -28.76995 | 14.4(0.02) | 11.3(0.01) | 9.5(0.04) | 9.9(0.02) | 10.2(0.02) | 7.6(0.04) | 7.4(0.02) | 3.2 | 71.4(6.2) | 11.3 | Mau10c_18 | OI | F | ||
| P57 | 266.62457 | -28.77776 | 14.7(0.02) | 12.6(0.02) | 13.2(0.02) | 13.6(0.02) | 10.9(0.08) | 10.4(0.10) | 9.2(0.04) | 3.5 | 80.7(6.7) | 11.6 | F | ||||
| P58 | 266.63270 | -28.77975 | 14.3(0.02) | 12.6(0.01) | 11.6(0.01) | 11.6(0.04) | 11.9(0.03) | 1.6 | 45.7(11.2) | 5.8 | F | ||||||
| P59 | 266.57304 | -28.82467 | 15.1(0.06)h | 12.2(0.05)h | 10.4(0.06)h | 10.6(0.03) | 11.0(0.02) | 9.1(0.20) | 8.7(0.21) | 8.3(0.09) | 2.8 | 93.3(9.5) | 9.6 | FQ_274 | WN9 | Q | |
| P60 | 266.57294 | -28.82181 | 16.2(0.06)h | 13.2(0.06)h | 11.2(0.06)h | 11.3(0.02) | 12.2(0.02) | 10.1(0.39) | 9.3(0.33) | 3.0 | 258.4(10.7) | 24.1 | FQ_309 | WC8 | Q | ||
| P61 | 266.48245 | -28.74278 | 15.0(0.03) | 13.3(0.06) | 13.7(0.02) | 14.0(0.02) | 2.9 | 72.2(6.7) | 10.5 | F | |||||||
| P62 | 266.55855 | -28.82124 | 15.4(0.07)h | 12.3(0.06)h | 10.4(0.06)h | 10.4(0.02) | 11.3(0.02) | 8.9(0.18) | 8.3(0.17) | 7.7(0.06) | 7.0(0.06) | 3.1 | 250.1(10.4) | 24.0 | Lie_158,FQ_320 | WN9 | Q |
| P63 | 266.55437 | -28.82364 | 16.2(0.07)h | 12.9(0.06)h | 10.5(0.07)h | 11.1(0.02) | 11.5(0.02) | 8.2(0.04) | 7.4(0.04) | 6.8(0.01) | 3.3 | 99.5(6.9) | 14.4 | Ho3 | WC8-9 | Q | |
| P64 | 266.54641 | -28.81830 | 16.3(0.03) | 13.4(0.02) | 11.6(0.02) | 11.3(0.02) | 12.3(0.02) | 8.7(0.03) | 2.8 | 325.7(12.3) | 26.5 | FQ_353E | WN6 | F | |||
| P65 | 266.55773 | -28.81403 | 15.8(0.03) | 12.7(0.01) | 10.9(0.01) | 11.5(0.02) | 11.7(0.02) | 9.5(0.05) | 9.2(0.06) | 8.3(0.02) | 3.0 | 42.1(5.5) | 7.6 | FQ_406 | Q | ||
| P66 | 266.56483 | -28.83833 | 16.2(0.06)h | 13.2(0.06)h | 11.2(0.06)h | 11.4(0.03) | 12.2(0.02) | 9.0(0.19) | 7.8(0.12) | 6.5(0.02) | 5.9(0.03) | 3.0 | 206.4(13.4) | 15.3 | FQ_76 | WC9 | Q |
| P67 | 266.56301 | -28.83910 | 19.5(0.08)h | 16.4(0.06)h | 14.5(0.06)h | 15.3(0.05) | 15.6(0.05) | 3.1 | 85.6(18.1) | 4.6 | Q | ||||||
| P68 | 266.56352 | -28.83428 | 12.0(0.06)h | 9.0(0.05)h | 7.6(0.05)h | 7.1(0.02) | 7.3(0.02) | 5.6(0.03) | 5.2(0.03) | 4.8(0.01) | 4.7(0.01) | 2.8 | 52.4(6.6) | 7.6 | FQ_134 | LBV | Q |
| P69 | 266.56452 | -28.82226 | 13.7(0.06)h | 10.7(0.05)h | 9.0(0.06)h | 9.8(0.02) | 9.9(0.02) | 8.0(0.11) | 7.6(0.11) | 7.4(0.04) | 7.4(0.08) | 3.1 | 25.4(5.1) | 4.5 | Lie_146,FQ_307 | O6-8 I f? | Q |
| P70 | 266.56973 | -28.83090 | 14.6(0.06)h | 11.7(0.05)h | 10.1(0.06)h | 10.9(0.02) | 11.0(0.02) | 9.1(0.27) | 3.0 | 37.2(5.4) | 6.4 | Lie_1 | O3-8 I fe | Q | |||
| P71 | 266.55895 | -28.82645 | 16.3(0.07)h | 12.8(0.06)h | 10.4(0.07)h | 11.1(0.02) | 11.5(0.02) | 3.4 | 96.5(6.8) | 13.3 | Lie_76 | WC9d | Q | ||||
| P72 | 266.56676 | -28.82268 | 15.3(0.06)h | 12.2(0.05)h | 10.4(0.06)h | 11.2(0.02) | 11.3(0.02) | 9.4(0.25) | 9.0(0.28) | 3.2 | 30.2(5.2) | 5.1 | Lie_143,FQ_301 | O7-B0 I | Q | ||
| P73 | 266.56173 | -28.83344 | 16.8(0.07)h | 13.0(0.07)h | 10.5(0.07)h | 11.7(0.03) | 11.9(0.02) | 8.1(0.11) | 7.4(0.11) | 6.8(0.04) | 3.7 | 49.7(8.1) | 5.3 | FQ_151 | WC8 | Q | |
| P74 | 266.55722 | -28.82803 | 19.3(0.08)h | 16.2(0.05)h | 14.5(0.06)h | 14.8(0.03) | 15.2(0.04) | 3.0 | 96.2(12.1) | 7.7 | Q | ||||||
| P75 | 266.57118 | -28.85862 | 15.0(0.03) | 12.1(0.12) | 10.5(0.02) | 11.0(0.02) | 11.3(0.02) | 3.0 | 76.6(6.3) | 11.2 | M07_2,Mau10a_22 | O6If+ | F | ||||
| P76 | 266.58645 | -28.87528 | 15.6(0.03) | 13.7(0.02) | 12.6(0.02) | 13.0(0.02) | 13.1(0.02) | 1.9 | 24.1(6.0) | 4.6 | F | ||||||
| P77 | 266.57310 | -28.88431 | 15.0(0.02) | 12.1(0.01) | 10.5(0.02) | 10.7(0.02) | 11.1(0.02) | 9.2(0.05) | 8.7(0.05) | 8.5(0.02) | 8.5(0.05) | 2.7 | 103.2(7.0) | 14.6 | Mau10c_16 | WN8-9h | F |
| P78 | 266.45091 | -28.79055 | 14.6(0.03) | 12.7(0.02) | 13.5(0.02) | 13.6(0.02) | 10.7(0.09) | 3.2 | 31.2(5.5) | 5.6 | F | ||||||
| P79 | 266.46449 | -28.82372 | 16.6(0.07)h | 13.0(0.06)h | 11.0(0.06)h | 11.3(0.03) | 11.8(0.02) | 9.7(0.07) | 9.0(0.06) | 9.0(0.04) | 3.4 | 120.7(10.5) | 11.8 | Blu01_1 | WN7 | F | |
| P80 | 266.46014 | -28.82276 | 15.0(0.06)h | 11.7(0.06)h | 9.8(0.06)h | 9.9(0.01) | 10.7(0.01) | 6.1(0.02) | 3.2 | 201.9(4.6) | 21.6 | FA_6,Mau10a_13 | WN8-9h | A | |||
| P81 | 266.46075 | -28.82145 | 14.9(0.06)h | 11.8(0.06)h | 9.9(0.06)h | 10.0(0.01) | 10.9(0.01) | 7.6(0.04) | 6.8(0.03) | 3.0 | 255.0(5.2) | 33.6 | FA_4,Blu01_17 | WN7-8h | A | ||
| P82 | 266.46182 | -28.82389 | 15.2(0.06)h | 11.9(0.06)h | 10.0(0.06)h | 10.2(0.01) | 11.0(0.01) | 8.3(0.04) | 7.7(0.04) | 7.5(0.02) | 7.5(0.05) | 3.2 | 248.0(5.1) | 30.6 | FA_3,Blu01_3 | WN8-9h | A |
| P83 | 266.46035 | -28.82199 | 14.9(0.07)h | 11.8(0.06)h | 9.9(0.06)h | 10.2(0.01) | 10.9(0.01) | 6.7(0.04) | 6.5(0.01) | 3.0 | 175.5(4.4) | 20.7 | FA_7,Mau10a_14 | WN8-9h | A | ||
| P84 | 266.46001 | -28.82246 | 15.4(0.06)h | 12.1(0.06)h | 10.2(0.06)h | 10.3(0.01) | 11.1(0.01) | 3.2 | 235.8(5.1) | 24.7 | FA_8,Blu01_24 | WN8-9h | A | ||||
| P85 | 266.45925 | -28.82274 | 15.4(0.07)h | 12.1(0.06)h | 10.1(0.06)h | 10.4(0.01) | 11.0(0.01) | 3.3 | 165.9(4.2) | 18.6 | FA_1,Blu01_28 | WN8-9h | A | ||||
| P86 | 266.45948 | -28.81983 | 15.2(0.06)h | 12.0(0.05)h | 10.3(0.06)h | 10.9(0.01) | 11.3(0.01) | 9.2(0.06) | 8.8(0.07) | 8.8(0.04) | 3.0 | 112.2(3.6) | 18.9 | FA_9,Mau10a_12 | WN8-9h | A | |
| P87 | 266.45954 | -28.82136 | 15.7(0.07)h | 12.5(0.06)h | 10.6(0.06)h | 10.9(0.01) | 11.6(0.01) | 3.1 | 185.2(4.5) | 26.1 | FA_12,Blu01_25 | WN7-8h | A | ||||
| P88 | 266.46121 | -28.82284 | 15.5(0.06)h | 12.5(0.05)h | 10.7(0.06)h | 11.1(0.01) | 11.7(0.01) | 2.9 | 155.1(4.1) | 16.7 | FA_14,Blu01_12 | WN8-9h | A | ||||
| P89 | 266.46151 | -28.82118 | 15.3(0.06)h | 12.3(0.05)h | 10.7(0.06)h | 11.4(0.01) | 11.6(0.01) | 3.0 | 47.1(2.8) | 8.1 | FA_15,Blu01_8 | O4-6If | A | ||||
| P90 | 266.46057 | -28.82231 | 15.7(0.06)h | 12.6(0.05)h | 10.8(0.06)h | 11.3(0.01) | 11.8(0.01) | 3.0 | 116.8(3.7) | 13.8 | FA_16,Blu01_19 | WN8-9h | A | ||||
| P91 | 266.48072 | -28.85726 | 15.4(0.19) | 12.5(0.04) | 11.0(0.07) | 10.5(0.03) | 11.5(0.02) | 9.4(0.05) | 8.7(0.05) | 8.5(0.03) | 2.5 | 319.9(17.1) | 18.8 | M07_1,Mau10a_16 | WN5-6b | F | |
| P92 | 266.52345 | -28.85881 | 12.7(0.04)t | 9.3(0.03)t | 7.5(0.03)t | 7.1(0.02) | 7.4(0.02) | 5.8(0.03) | 3.3 | 79.4(6.4) | 11.9 | Mau10b | LBV | F | |||
| P93 | 266.51671 | -28.89814 | 15.1(0.08)t | 15.3(0.03) | 15.6(0.04) | 2.8b | 61.2(11.1) | 5.5 | F | ||||||||
| P94 | 266.51080 | -28.90388 | 16.4(0.04) | 13.5(0.02) | 11.6(0.02) | 11.5(0.02) | 12.5(0.02) | 9.9(0.07) | 9.3(0.07) | 9.1(0.03) | 2.9 | 287.1(13.2) | 21.8 | Mau10c_14 | WC9 | F | |
| P95 | 266.49765 | -28.88075 | 14.9(0.02) | 12.1(0.01) | 10.5(0.02) | 11.1(0.02) | 11.2(0.02) | 9.6(0.06) | 9.2(0.07) | 9.8(0.22) | 2.7 | 24.8(5.1) | 4.8 | F | |||
| P96 | 266.45238 | -28.83491 | 17.6(0.10) | 13.3(0.02) | 11.0(0.02) | 11.0(0.02) | 11.8(0.02) | 9.1(0.04) | 8.5(0.04) | 8.1(0.02) | 7.7(0.06) | 4.0 | 229.2(10.0) | 22.8 | Cot_1 | Ofpe/WN9 | F |
| P97 | 266.44891 | -28.84692 | 15.3(0.19)t | 12.3(0.09)t | 10.7(0.06)t | 11.3(0.02) | 11.5(0.02) | 9.5(0.06) | 9.1(0.06) | 8.9(0.03) | 2.9 | 47.8(6.6) | 7.6 | F | |||
| P98 | 266.42197 | -28.86325 | 14.8(0.02) | 11.6(0.01) | 9.9(0.01) | 10.4(0.03) | 10.6(0.02) | 8.6(0.04) | 8.0(0.04) | 7.8(0.02) | 7.6(0.05) | 3.2 | 52.6(8.2) | 6.6 | Mau10c_9 | O4-6If+ | F |
| P99 | 266.41118 | -28.86958 | 16.4(0.06) | 13.9(0.04) | 14.3(0.02) | 15.1(0.02) | 4.2 | 200.7(11.4) | 17.4 | F | |||||||
| P100 | 266.42634 | -28.87976 | 14.7(0.02) | 11.7(0.01) | 10.1(0.03) | 10.5(0.03) | 10.9(0.02) | 8.5(0.04) | 7.7(0.07) | 6.5(0.01) | 4.6(0.01) | 3.0 | 77.5(9.0) | 8.2 | Mau10c_10 | O4-6If+ | F |
| P101 | 266.42704 | -28.88140 | 16.3(0.04) | 13.2(0.01) | 11.2(0.02) | 11.3(0.02) | 12.1(0.02) | 9.4(0.05) | 8.7(0.05) | 3.0 | 201.4(9.3) | 21.0 | Ho1 | WC8-9 | F | ||
| P102 | 266.43349 | -28.88800 | 15.0(0.02) | 13.3(0.03) | 12.4(0.04) | 12.5(0.02) | 12.8(0.02) | 1.6 | 40.9(5.6) | 8.8 | F | ||||||
| P103 | 266.50689 | -28.92091 | 13.4(0.01) | 10.7(0.01) | 9.1(0.05) | 9.4(0.02) | 9.7(0.02) | 7.6(0.03) | 7.1(0.04) | 6.7(0.01) | 5.6(0.01) | 2.9 | 56.2(5.8) | 9.7 | Mau10c_13 | OI | F |
| P104 | 266.53042 | -28.95485 | 15.9(0.05) | 16.3(0.07) | 3.0b | 104.7(23.2) | 4.5 | F | |||||||||
| P105 | 266.47070 | -28.92692 | 14.9(0.04) | 13.4(0.10) | 13.8(0.02) | 14.0(0.02) | 2.7 | 37.6(6.1) | 6.2 | F | |||||||
| P106 | 266.46776 | -28.94615 | 16.1(0.08) | 14.5(0.13) | 14.4(0.02) | 14.7(0.02) | 2.7 | 62.9(7.9) | 8.1 | F | |||||||
| P107 | 266.41391 | -28.88919 | 14.7(0.02) | 11.8(0.01) | 10.2(0.01) | 10.5(0.02) | 10.9(0.02) | 8.9(0.05) | 8.5(0.07) | 8.1(0.03) | 2.9 | 83.0(7.5) | 11.4 | Cot_5 | B[e] | F | |
| P108 | 266.44602 | -28.94612 | 15.5(0.07) | 14.0(0.09) | 14.4(0.03) | 14.7(0.03) | 2.5 | 49.0(8.3) | 6.4 | F | |||||||
| P109 | 266.46088 | -28.98877 | 15.4(0.02) | 12.5(0.01) | 10.9(0.01) | 10.8(0.02) | 11.6(0.02) | 9.6(0.05) | 9.0(0.05) | 8.6(0.02) | 7.9(0.04) | 2.8 | 195.3(10.6) | 19.2 | Cot_2,Mau10a_15 | WN7 | F |
| P110 | 266.45393 | -28.98382 | 15.7(0.04) | 14.3(0.03) | 14.8(0.03) | 15.0(0.03) | 2.3 | 34.9(8.3) | 4.7 | F | |||||||
| P111 | 266.40061 | -28.94403 | 15.6(0.03) | 12.3(0.01) | 10.4(0.02) | 10.4(0.02) | 11.1(0.02) | 8.8(0.04) | 8.3(0.04) | 8.0(0.02) | 7.8(0.06) | 3.1 | 171.9(8.6) | 20.0 | Mik06_01,Mau10a_9 | WN8-9h | F |
| P112 | 266.40753 | -28.95450 | 13.1(0.02) | 10.7(0.02) | 11.6(0.02) | 12.0(0.02) | 7.8(0.04) | 6.9(0.03) | 6.1(0.01) | 5.1(0.01) | 4.3 | 110.0(7.4) | 13.8 | Cot_6 | B[e] | F | |
| P113 | 266.39038 | -28.96381 | 14.2(0.03) | 12.2(0.02) | 12.8(0.02) | 12.9(0.02) | 3.4 | 37.5(5.5) | 6.9 | F | |||||||
| P114 | 266.38658 | -28.93794 | 14.7(0.02) | 12.1(0.01) | 10.7(0.01) | 11.2(0.02) | 11.3(0.02) | 2.6 | 40.6(5.5) | 7.1 | Mau10a_8 | O4-6I | F | ||||
| P115 | 266.32590 | -28.89079 | 16.4(0.06) | 13.8(0.04) | 11.9(0.02) | 12.7(0.02) | 12.9(0.02) | 8.9(0.04) | 8.1(0.04) | 7.1(0.01) | 6.2(0.01) | 2.9 | 24.9(6.0) | 5.1 | F | ||
| P116 | 266.29639 | -28.91955 | 13.7(0.02) | 13.0(0.01) | 12.8(0.01) | 12.7(0.02) | 12.8(0.02) | 0.5 | 13.4(4.9) | 6.0 | F | ||||||
| P117 | 266.41477 | -29.00973 | 12.8(0.03)h | 10.6(0.02)h | 10.8(0.01) | 12.1(0.00) | 3.5 | 415.6(3.8) | 58.5 | E79 | Ofpe/WN9 | C | |||||
| P118 | 266.41443 | -29.00881 | 13.6(0.02)h | 11.5(0.01)h | 12.1(0.01) | 12.8(0.01) | 3.4 | 172.5(2.8) | 23.9 | E74 | WN8 | C | |||||
| P119 | 266.41377 | -29.00853 | 14.4(0.03)h | 12.2(0.02)h | 12.6(0.01) | 13.5(0.01) | 3.7 | 268.4(4.1) | 39.7 | E81 | WN7 | C | |||||
| P120 | 266.41410 | -29.00929 | 14.8(0.04)h | 12.8(0.03)h | 13.3(0.01) | 13.9(0.01) | 2.7 | 158.4(4.1) | 22.9 | E82 | WC8/9 | C | |||||
| P121 | 266.41777 | -29.00756 | 14.0(0.06)h | 10.9(0.02)h | 8.9(0.01)h | 10.0(0.01) | 10.1(0.00) | 3.1 | 39.4(1.5) | 7.6 | E39 | Ofpe/WN9 | C | ||||
| P122a | 266.41584 | -29.00829 | 16.0(0.07)h | 12.8(0.03)h | 10.5(0.02)h | 11.3(0.02) | 12.0(0.01) | 5.6(0.04) | 3.4 | 201.0(6.2) | 25.2 | E51 | WN8 | C | |||
| P122b | 266.41583 | -29.00821 | 13.8(0.04)h | 11.1(0.02)h | 12.1(0.04) | 12.9(0.02) | 4.2 | 241.7(15.3) | 15.1 | E48 | WC9 | C | |||||
| P123 | 266.41728 | -29.00458 | 16.7(0.06)h | 13.6(0.03)h | 11.4(0.01)h | 11.6(0.02) | 12.4(0.03) | 3.3 | 218.1(13.2) | 16.5 | E88 | WN8/9 | C | ||||
| P124 | 266.41635 | -29.00504 | 16.8(0.06)h | 13.8(0.02)h | 11.8(0.01)h | 12.3(0.01) | 12.9(0.01) | 3.1 | 152.5(2.7) | 16.8 | E83 | WN8/WC9 | C | ||||
| P125 | 266.41555 | -29.00739 | 19.6(0.15)h | 14.7(0.04)h | 11.5(0.02)h | 13.7(0.02) | 13.9(0.01) | 5.0 | 67.5(5.2) | 9.6 | E56 | Ofpe/WN9 | C | ||||
| P126 | 266.41560 | -29.00646 | 17.5(0.06)h | 14.2(0.02)h | 12.2(0.01)h | 12.8(0.01) | 13.3(0.01) | 3.2 | 114.4(2.3) | 13.6 | E66 | WN8 | C | ||||
| P127 | 266.41714 | -29.00621 | 17.6(0.08)h | 14.2(0.05)h | 11.4(0.02)h | 12.7(0.04) | 13.0(0.04) | 3.3 | 63.3(13.3) | 4.7 | E71 | WC8/9 ? | C | ||||
| P128 | 266.41608 | -29.00616 | 18.9(0.09)h | 15.5(0.04)h | 13.2(0.02)h | 13.9(0.02) | 14.5(0.02) | 3.4 | 144.1(8.1) | 12.5 | E68 | WC9 | C | ||||
| P129 | 266.41717 | -29.00767 | 15.1(0.06)h | 11.7(0.02)h | 9.7(0.01)h | 10.8(0.01) | 11.1(0.00) | 3.3 | 64.0(1.8) | 13.6 | E20 | Ofpe/WN9 | C | ||||
| P130 | 266.41777 | -29.00814 | 18.1(0.11)h | 14.2(0.04)h | 11.7(0.02)h | 12.3(0.01) | 13.3(0.02) | 3.9 | 306.2(9.3) | 28.1 | E40 | WN5/6 | C | ||||
| P131 | 266.41984 | -29.00772 | 17.9(0.11)h | 14.7(0.03)h | 12.8(0.01)h | 13.2(0.01) | 13.8(0.01) | 3.1 | 162.2(4.7) | 23.9 | E78 | WC9 | C | ||||
| P132 | 266.41774 | -29.00936 | 17.5(0.07)h | 14.3(0.03)h | 12.0(0.02)h | 12.5(0.02) | 13.2(0.01) | 3.4 | 209.5(6.5) | 14.3 | E65 | WN8 | C | ||||
| P133 | 266.40359 | -29.02154 | 13.9(0.08)t | 15.1(0.05) | 16.0(0.10) | 7.3(0.03) | 5.8(0.03) | 3.7b | 238.6(43.6) | 5.5 | F | ||||||
| P134 | 266.31975 | -28.97363 | 16.7(0.06) | 13.1(0.03) | 11.1(0.02) | 11.4(0.03) | 12.1(0.02) | 9.4(0.05) | 8.8(0.05) | 8.7(0.03) | 7.4(0.03) | 3.4 | 174.0(12.3) | 13.8 | Mau10a_4 | WN7-8h | F |
| P135 | 266.32402 | -28.97220 | 16.1(0.10) | 14.1(0.06) | 14.8(0.03) | 15.1(0.03) | 3.5 | 70.0(9.3) | 7.3 | F | |||||||
| P136 | 266.36759 | -29.05754 | 14.8(0.03) | 12.7(0.02) | 13.2(0.02) | 13.3(0.02) | 11.0(0.11) | 11.0(0.14) | 9.3(0.15) | 3.7 | 33.0(5.5) | 5.8 | F | ||||
| P137 | 266.31749 | -29.05437 | 11.6(0.03)t | 9.2(0.03)t | 7.9(0.03)t | 7.7(0.04) | 8.3(0.03) | 6.8(0.03) | 6.3(0.03) | 6.1(0.01) | 5.8(0.02) | 2.2 | 135.3(15.4) | 8.7 | Muno06_01,Mau10a_3 | Ofpe/WN9 | F |
| P138 | 266.33870 | -29.13177 | 14.3(0.02) | 14.5(0.02) | 2.8b | 41.4(6.5) | 6.4 | F | |||||||||
| P139 | 266.31898 | -29.09621 | 15.4(0.05) | 13.5(0.03) | 14.0(0.02) | 14.2(0.02) | 3.2 | 43.0(6.2) | 6.6 | F | |||||||
| P140 | 266.24782 | -29.09057 | 8.8(0.03)t | 7.7(0.04)t | 7.0(0.03)t | 6.9(0.02) | 7.2(0.02) | 6.5(0.02) | 6.1(0.02) | 5.9(0.01) | 6.0(0.01) | 1.3 | 58.3(5.9) | 11.3 | Mau10c_1 | B0I-B2I | F |
| P141 | 266.28870 | -29.13783 | 15.3(0.05) | 11.7(0.02) | 13.0(0.02) | 13.2(0.02) | 7.6(0.04) | 6.4(0.03) | 5.5(0.01) | 5.0(0.01) | 6.3 | 57.7(6.0) | 6.7 | F | |||
| P142 | 266.33105 | -29.17609 | 15.9(0.06) | 14.8(0.13) | 14.8(0.03) | 15.0(0.03) | 1.8 | 37.0(7.8) | 5.6 | F | |||||||
| P143 | 266.34964 | -29.17353 | 15.8(0.04) | 16.2(0.04) | 3.3b | 74.1(14.8) | 5.0 | F | |||||||||
| P144 | 266.30924 | -29.19493 | 15.3(0.03) | 15.6(0.03) | 3.0b | 77.1(10.9) | 7.1 | F | |||||||||
| P145 | 266.32051 | -29.20505 | 10.0(0.04)t | 8.7(0.05)t | 7.9(0.03)t | 8.1(0.02) | 8.2(0.02) | 7.4(0.03) | 7.3(0.03) | 7.3(0.01) | 7.1(0.02) | 1.3 | 16.3(4.9) | 4.7 | F | ||
| P146 | 266.22471 | -29.09574 | 13.8(0.03) | 14.6(0.04) | 3.0b | 224.5(20.0) | 11.2 | F | |||||||||
| P147 | 266.28741 | -29.20498 | 15.1(0.03) | 12.6(0.02) | 11.1(0.04) | 10.8(0.02) | 11.6(0.02) | 2.5 | 239.8(10.2) | 23.4 | Mau10a_2 | WN7 | F | ||||
| P148 | 266.30920 | -29.26002 | 16.2(0.10) | 14.7(0.09) | 15.2(0.03) | 15.5(0.03) | 2.5 | 49.2(10.4) | 4.7 | F | |||||||
| P149 | 266.31115 | -29.25314 | 14.1(0.01) | 13.1(0.02) | 12.4(0.02) | 12.4(0.02) | 12.8(0.02) | 1.1 | 94.1(6.8) | 15.0 | F | ||||||
| P150 | 266.31271 | -29.24339 | 14.5(0.02) | 12.7(0.03) | 13.1(0.02) | 13.7(0.02) | 11.4(0.12) | 10.8(0.11) | 10.0(0.05) | 3.1 | 143.7(8.5) | 16.5 | F | ||||
| P151 | 266.29083 | -29.23696 | 15.6(0.03) | 13.0(0.01) | 11.1(0.02) | 11.6(0.03) | 12.1(0.02) | 9.4(0.05) | 8.7(0.05) | 8.4(0.03) | 8.0(0.04) | 2.5 | 105.6(10.0) | 10.6 | Mau10c_4 | WC9?d | F |
| P152 | 266.24459 | -29.25164 | 14.9(0.04) | 15.1(0.03) | 2.8b | 57.9(12.3) | 4.7 | F | |||||||||
| P153 | 266.45859 | -28.82313 | 16.7(0.07)h | 13.2(0.06)h | 11.3(0.06)h | 12.1(0.01) | 12.2(0.01) | 3.4 | 25.6(2.6) | 4.6 | FA_13,Blu01_31 | A | |||||
| P154 | 266.46092 | -28.82199 | 16.3(0.07)h | 13.2(0.05)h | 11.5(0.06)h | 12.2(0.01) | 12.5(0.01) | 3.0 | 48.1(3.1) | 5.7 | FA_27,Blu01_16 | A | |||||
| P155 | 266.45930 | -28.82120 | 16.6(0.06)h | 13.4(0.05)h | 11.6(0.06)h | 12.5(0.01) | 12.6(0.01) | 3.3 | 28.3(2.8) | 5.2 | FA_22,Blu01_27 | O4-6I | A | ||||
| P156 | 266.41716 | -29.00808 | 14.9(0.06)h | 12.0(0.02)h | 10.0(0.01)h | 10.9(0.01) | 11.3(0.01) | 3.1 | 77.1(2.2) | 16.0 | E23 | Ofpe/WN9 | C | ||||
| P157 | 266.41684 | -29.00747 | 15.0(0.06)h | 12.2(0.02)h | 10.1(0.01)h | 11.1(0.01) | 11.2(0.00) | 3.1 | 35.5(1.5) | 10.5 | E19 | Ofpe/WN9 | C | ||||
| P158 | 266.41704 | -29.00868 | 15.8(0.07)h | 12.1(0.02)h | 10.0(0.01)h | 11.1(0.01) | 11.3(0.00) | 3.5 | 40.0(1.8) | 6.6 | E41 | Ofpe/WN9 | C | ||||
| P159 | 266.41545 | -29.00827 | 18.0(0.12)h | 14.4(0.03)h | 12.2(0.02)h | 13.4(0.04) | 13.9(0.02) | 3.6 | 113.3(11.9) | 9.1 | E60 | WN7? | C | ||||
| P160 | 266.41757 | -29.00789 | 14.7(0.04)h | 12.7(0.02)h | 13.6(0.03) | 13.9(0.03) | 3.6 | 82.9(11.0) | 7.1 | E27 | O9.5-B0.5 I | C | |||||
| P161 | 266.41823 | -29.00643 | 18.8(0.09)h | 15.0(0.03)h | 12.7(0.02)h | 13.4(0.03) | 14.0(0.01) | 3.8 | 154.8(10.4) | 12.9 | E70 | Ofpe/WN9 | C | ||||
| P162 | 266.41644 | -29.00608 | 13.3(0.04) | 14.3(0.05) | 4.6b | 342.7(28.4) | 11.5 | C | |||||||||
| P163 | 266.41820 | -29.01005 | 15.3(0.05)h | 13.1(0.07)h | 13.7(0.04) | 14.2(0.02) | 3.4 | 121.2(11.2) | 6.9 | E76 | WC9 | C | |||||
| P164 | 266.41566 | -29.00701 | 19.1(0.10)h | 15.5(0.04)h | 13.1(0.02)h | 14.2(0.02) | 14.5(0.02) | 3.8 | 71.3(6.6) | 9.3 | E61 | WN7 | C | ||||
| P165 | 266.41777 | -29.00685 | 18.6(0.10)h | 15.5(0.05)h | 13.1(0.02)h | 14.1(0.03) | 14.6(0.03) | 3.1 | 114.2(11.0) | 9.5 | E59 | WC9 | C | ||||
| MP1 | 266.56614 | -28.82928 | 15.2(0.10)t | 10.5(0.05)t | 7.4(0.04)t | 8.7(0.02) | 8.6(0.02) | 4.6 | 2.2(4.6) | -1.5 | Lie_19,FQ_211,Mau1 | WC8/9d +OB | Q | ||||
| MP2 | 266.56131 | -28.82795 | 13.6(0.08)h | 9.4(0.07)h | 6.4(0.08)h | 7.8(0.02) | 7.7(0.02) | 4.2 | -3.0(4.4) | -2.2 | Lie_42,FQ_231,Mau1 | WC9d + OB | Q | ||||
| MP3 | 266.55892 | -28.82683 | 15.7(0.08)h | 11.1(0.08)h | 7.9(0.08)h | 9.5(0.02) | 9.4(0.02) | 4.5 | -1.7(4.5) | -2.3 | Lie_75,FQ_243 | WC9?d | Q | ||||
| MP4 | 266.56418 | -28.82624 | 15.9(0.09)h | 12.1(0.07)h | 9.5(0.07)h | 10.5(0.02) | 10.5(0.02) | 3.8 | 12.7(4.8) | 1.8 | Lie_79,FQ_250 | WC9d | Q | ||||
| MP5 | 266.56167 | -28.82616 | 14.9(0.08)h | 10.8(0.07)h | 7.8(0.08)h | 9.3(0.02) | 9.2(0.02) | 4.1 | 0.5(4.5) | -1.5 | Lie_84,FQ_251 | WC9d | Q | ||||
| MP6 | 266.55970 | -28.82537 | 17.9(0.10)h | 13.2(0.08)h | 9.4(0.09)h | 10.8(0.02) | 10.7(0.02) | 4.7 | -1.1(4.5) | -2.1 | Lie_102,FQ_258 | WC9?d | Q | ||||
| MP7 | 266.41633 | -29.00742 | 19.3(0.24)h | 13.2(0.03)h | 9.9(0.02)h | 12.2(0.01) | 12.1(0.01) | 6.0 | 7.0(1.7) | 0.4 | E31 | WC9 | C | ||||
| MP8 | 266.41742 | -29.00814 | 17.7(0.13)h | 13.6(0.03)h | 10.8(0.02)h | 12.5(0.02) | 12.5(0.01) | 4.0 | 11.7(3.3) | 2.6 | E32 | WC8/9 | C | ||||
| MP9 | 266.41654 | -29.00724 | 19.0(0.15)h | 14.6(0.04)h | 11.7(0.02)h | 13.5(0.02) | 13.5(0.01) | 4.3 | 16.7(3.8) | 3.4 | E35 | WC8/9 | C | ||||
| MP10 | 266.41609 | -29.00676 | 15.3(0.05)h | 11.0(0.02)h | 13.7(0.01) | 13.6(0.01) | 6.4 | -3.1(2.2) | -1.2 | E58 | WC5/6 | C | |||||
| MP11 | 266.41898 | -29.00796 | 18.9(0.11)h | 15.7(0.06)h | 13.6(0.02)h | 14.9(0.14) | 14.7(0.04) | 3.2 | -25.8(21.6) | -1.0 | E72 | WC9? | C | ||||
| MP12 | 266.41862 | -29.01009 | 13.8(0.04)h | 11.6(0.03)h | 12.4(0.09) | 12.7(0.03) | 3.5 | 88.7(25.5) | 3.5 | E80 | WC9 | C | |||||
| MP13 | 266.32978 | -29.05614 | 13.7(0.02) | 10.4(0.01) | 10.7(0.02) | 10.8(0.02) | 5.3 | 28.6(5.2) | 2.9 | Mau10a_5 | WC9d | F | |||||
| MP14 | 266.57427 | -28.83530 | 14.2(0.06)t | 10.4(0.06)t | 7.9(0.04)t | 9.2(0.02) | 9.2(0.02) | 3.8 | 11.2(4.8) | 1.3 | Mau10a_23 | WC9d | F | ||||
Note. — R.A. and Decl. are in degrees. J, H and K band magnitudes are mainly from the SIRIUS catalog (Nishiyama et al., 2006), except for those with the superscript ‘h’ and ‘t’, which are from the HST/NIC2 snapshot observations and 2MASS catalog (§ 2.2). The extinction values at 1.90m are from the near-IR colors, except for those with the superscript ‘b’, which are from the ratio map in Dong et al. (2011) (§ 2.3). EW is in units of Å. The spectroscopically identified counterpart names and types are from Figer et al. (1999a) (FQ_*), Figer et al. (2002)(FA_*), Liermann et al. (2009)(Lie_*), Paumard et al. (2006)(E*), Blum et al. (2001)(Blu01_*), Cotera et al. (1999)(Cot_*), Homeier et al. (2003)(Ho*), Muno et al. (2006)(Muno06_*), Mikles et al. (2006)(Mik06_*), Mauerhan et al. (2007)(Mau07_*), Mauerhan et al. (2010a)(Mau10a_*), Mauerhan et al. (2010b)(Mau10b_*), Mauerhan et al. (2010c)(Mau10c_*). If multiple identifications are available, we adopt the types from the latest reference, except for P6 and P7, which are from Figer et al. (1999a), instead of Liermann et al. (2009). The ‘Location’ column divides the sources into four groups: those inside the three clusters (‘Q’ - Quintuplet, ‘A’- Arches, ‘C’ - Center) and outside (‘F’; § 2). The MP1-14 are not selected out by our method ( 4.5, see § 2.1). Instead, they are WC stars identified by previous ground-based spectroscopic observations. We include these WC stars into our catalog to complete the sample of the evolved massive stars in the GC
| Program ID | Observation Data | Filter | exposure |
|---|---|---|---|
| 7250 | Aug 31st, 1999 | F187N | 1215 sec |
| 7250 | Aug 31st, 1999 | F190N | 1215 sec |
| 7364 | Sep 14th, 1999 | F187N | 1024 sec |
| 7364 | Sep 14th, 1999 | F190N | 1024 sec |
| Type | Description | Error | Error | ||
|---|---|---|---|---|---|
| WN5-6 weak | WN5, WN6 | 0.03 | 0.012 | 0.16 | 0.012 |
| WN4-7 strong | WN4b, WN5b, WN6b | 0.10 | 0.006 | 0.27 | 0.006 |
| WN7-9 weak | WN7(h), WN8(h), WN9(h) | 0.02 | 0.052 | 0.11 | 0.053 |
| WN10-11 | Ofpe/WN9, WN10, WN11 | 0.06 | 0.049 | 0.13 | 0.11 |
| WC5-7 | WC5, WC6, WC7 | 0.04 | 0.029 | 0.58 | 0.012 |
| WC8 | WC8 | 0.05 | 0 | 0.38 | 0 |
| WC9 | WC9 | -0.03 | 0 | 0.26 | 0 |
| LBV | LBV | -0.07 | 0 | -0.05 | 0 |
| OB supergiant | O If+, B[e] | -0.11 | 0 | -0.1 | 0 |
| Name | Reference | X-ray ID | (arcsec) | X-ray flux | HR0 | HR1 | HR2 | P (%) |
|---|---|---|---|---|---|---|---|---|
| P9 | Lie_96,Mau10a_19 | CXOGC174615.1-284932 | 0.51 | 1.4e-06 | 43.5 | |||
| P18 | FA_2,Mau10a_11 | CXOGC174549.7-284925 | 0.41 | 1.6e-06 | 31.8 | |||
| P35 | Cot_4,Mau10a_7 | CXOGC174528.6-285605 | 0.48 | 9.0e-07 | 41.4 | |||
| P36 | Mau10c_6 | CXOGC174531.4-285716 | 0.50 | 2.4e-07 | 44.8 | |||
| P38 | Mau10c_7 | CXOGC174537.9-290134 | 0.33 | 1.4e-06 | N/A | |||
| P39 | Mau10a_6 | CXOGC174522.6-285844 | 0.63 | 2.3e-07 | 21.4 | |||
| P75 | M07_2,Mau10a_22 | CXOGC174617.0-285131 | 0.56 | 2.4e-06 | 31.9 | |||
| P80 | FA_6,Mau10a_13 | CXOGC174550.4-284922 | 0.33 | 4.0e-05 | 84.0 | |||
| P83 | FA_7,Mau10a_14 | CXOGC174550.4-284919 | 0.33 | 2.3e-05 | 73.5 | |||
| P86 | FA_9,Mau10a_12 | CXOGC174550.2-284911 | 0.33 | 3.0e-05 | 70.9 | |||
| P91 | M07_1,Mau10a_16 | CXOGC174555.3-285126 | 0.49 | 1.7e-06 | 41.0 | |||
| P105 | CXOGC174552.9-285537 | 0.59 | 4.7e-07 | 13.0 | ||||
| P108 | CXOGC174546.9-285645 | 0.56 | 3.6e-07 | N/A | ||||
| P109 | Cot_2,Mau10a_15 | CXOGC174550.6-285919 | 0.43 | 2.1e-07 | -1 | |||
| P111 | Mik06_01,Mau10a_9 | CXOGC174536.1-285638 | 0.37 | 2.0e-05 | 70.6 | |||
| P114 | Mau10a_8 | CXOGC174532.7-285617 | 0.50 | 7.2e-07 | 39.8 | |||
| P122a | E51 | CXOGC174539.7-290029 | 0.30 | 1.1e-05 | 54.1 | |||
| P122b | E48 | CXOGC174539.7-290029 | 0.30 | 1.1e-05 | 54.1 | |||
| P123 | E88 | CXOGC174540.1-290016 | 0.40 | 2.4e-07 | N/A | |||
| P125 | E56 | CXOGC174539.7-290026 | 0.30 | 9.8e-06 | N/A | |||
| P131 | E78 | CXOGC174540.7-290027 | 0.35 | 4.1e-07 | 11.4 | |||
| P133 | CXOGC174536.8-290117 | 0.46 | 1.6e-07 | 9.2 | ||||
| P134 | Mau10a_4 | CXOGC174516.7-285824 | 0.65 | 3.6e-07 | 31.4 | |||
| P137 | Muno06_01,Mau10a_3 | CXOGC174516.1-290315 | 0.44 | 3.4e-06 | 79.8 | |||
| P138 | CXOGC174521.3-290754 | 0.75 | 7.1e-07 | 57.6 | ||||
| P139 | CXOGC174516.6-290545 | 3.75 | 4.9e-07 | 0.4 | ||||
| P145 | CXOGC174516.9-291217 | 1.32 | 1.2e-06 | -1 | ||||
| P147 | Mau10a_2 | CXOGC174508.9-291218 | 0.87 | 3.4e-06 | 10.3 | |||
| P158 | E41 | CXOGC174540.0-290030 | 0.30 | 1.4e-05 | N/A | |||
| P161 | E70 | CXOGC174540.4-290024 | 0.38 | 2.1e-06 | N/A | |||
| MP1 | Lie_19,FQ_211,Mau1 | CXOGC174615.8-284945 | 0.49 | 1.8e-06 | 25.9 | |||
| MP2 | Lie_42,FQ_231,Mau1 | CXOGC174614.6-284940 | 0.62 | 8.9e-07 | 26.8 | |||
| MP12 | E80 | CXOGC174540.4-290036 | 0.35 | 9.1e-07 | 27.7 | |||
| MP13 | Mau10a_5 | CXOGC174519.1-290321 | 0.51 | 1.0e-06 | 28.1 | |||
| MP14 | Mau10a_23 | CXOGC174617.7-285007 | 0.50 | 1.6e-06 | 48.1 |
Note. — The X-ray ID, flux (photons , 0.5-8 keV) and X-ray colors (HR) are from Muno et al. (2009). HR=. For HR0, HR1 and HR2, h (s) represents the X-ray photons in the 2.0-3.3 keV (0.5-2.0 keV), 3.3-4.7 keV (2.0-3.3 keV), 4.7-8.0 keV (3.3-4.7 keV). ‘1’ (‘-1’) means that the source is not been detected in the soft (high) band. ’-9’ means that the source is not detected in both h and s bands. is the X-ray source positional uncertainty. The ‘P (%)’ column lists the percent probability for the infrared object as real counterpart of the X-ray corresponding source as listed in Table 3 of Mauerhan et al. (2009). ’N/A’ means that the PES is outside their adopted match radii of the X-ray sources. ‘-1’ means that the PES has a red near-IR color (H-Ks0.9), while the X-ray source is soft (HR0-0.175). We find that P145 actually has a blue near-IR color (H-Ks=0.8), based on 2MASS measurements, although a red color was adopted in Mauerhan et al. (2009), using the SIRIUS catalog, in which the J and H band fluxes are saturated.
| Name | Counterpart | Extinction-free | Revised | |
|---|---|---|---|---|
| First Class | ||||
| P38 | Mau10c_7 | 7.6 | 1.5 | 2.9 |
| P140 | Mau10c_1 | 5.9 | 1.3 | 9.8 |
| P145 | 7.0 | 1.3 | 3.3 | |
| Second Class | ||||
| P1 | 12.2 | 0.5 | 3.4 | |
| P27 | 13.8 | 1.5 | 7.0 | |
| P58 | 10.2 | 1.6 | 4.1 | |
| P102 | 11.2 | 1.6 | 7.2 | |
| P116 | 12.4 | 0.5 | 2.7 | |
| P149 | 11.8 | 1.1 | 13.6 | |
Note. — is the parameter which we use to identify the PESs in § 2.1. In Dong et al. (2011), we only considered the sources with as PESs. We divide the nine sources with blue near-IR colors into two class according to their extinction-corrected free (see § 3.2). The first class should be foreground massive stars, while the second class could be foreground CVs instead.
| Name | Tdust (K) | F190N dust percentage | Unc EW | Corr EW | Dust Mass () |
|---|---|---|---|---|---|
| P63 | 83453 | 15.5 4.7 | 99.56.9 | 120.5 11.4 | 3.5 |
| P66 | 57491 | 2.2 2.2 | 206.413.4 | 211.9 14.8 | 1.2 |
| P73 | 72744 | 8.1 2.9 | 49.78.1 | 56.1 9.5 | 6.6 |
| P151 | 94425 | 18.4 1.8 | 105.610.0 | 134.3 13.5 | 5.1 |
| MP1 | 64428 | 15.3 3.5 | 2.24.6 | 6.4 5.5 | 1.9 |
| MP2 | 586 6 | 6.2 0.5 | -3.04.4 | -1.6 4.7 | 3.8 |
| MP3 | 694 8 | 33.4 2.5 | -1.74.5 | 7.6 7.0 | 8.0 |
| MP4 | 90539 | 23.7 4.8 | 12.74.8 | 20.9 6.7 | 9.3 |
| MP5 | 73915 | 21.5 2.6 | 0.54.5 | 5.8 5.9 | 2.2 |
| MP6 | 599 7 | 32.6 2.6 | -1.14.5 | 9.0 6.8 | 1.4 |
| MP14 | 85825 | 15.0 2.2 | 11.24.8 | 16.1 5.8 | 3.1 |
Note. — Dust properties derived from the SED fitting of 11 WCs in six bands: J, H, F190N, , 3.6m and 4.5 m. The second column presents the single dust temperature, Tdust (K). The percentage of the total F190N flux attributable to dust is listed in the third column. The fourth column shows the uncorrected EW as listed in Table 2, while the fifth column presents the corrected value (after subtracting the dust contribution). The derived dust mass is listed in the sixth column.