Discovery of Three Distant, Cold Brown Dwarfs in the WFC3 Infrared Spectroscopic Parallels Survey
Abstract
We present the discovery of three late type (T4.5) brown dwarfs, including a probable Y dwarf, in the WFC3 Infrared Spectroscopic Parallels (WISP) Survey. We use the G141 grism spectra to determine the spectral types of the dwarfs and derive distance estimates based on a comparison with nearby T dwarfs with known parallaxes. These are the most distant spectroscopically confirmed T/Y dwarfs, with the farthest at an estimated distance of 400 pc. We compare the number of cold dwarfs found in the WISP survey with simulations of the brown dwarf mass function. The number found is generally consistent with an initial stellar mass function with = 0.0–0.5, although the identification of a Y dwarf is somewhat surprising and may be indicative of either a flatter absolute magnitude/spectral type relation than previously reported or an upturn in the number of very late type brown dwarfs in the observed volume.
1 Introduction
Understanding the nature and demographics of low-temperature brown dwarfs, which bridge the gap between dwarf stars and massive planets, is an important goal of modern astrophysics. Since the discovery of the first methane dwarf G1229B in 1995 (Nakajima et al., 1995; Oppenheimer et al., 1995), the number of known ultracool dwarfs of type T and now Y (Cushing et al., 2011) has continued to grow, primarily due to deep near-infrared surveys such as 2MASS (Kirkpatrick et al., 1999; Burgasser et al., 2002), SDSS (Strauss et al., 1999; Chiu et al., 2006), UKIDSS (Lodieu et al., 2007; Chiu et al., 2008; Burningham et al., 2010), CFBDS (Delorme et al., 2008) and WISE (Wright et al., 2010; Kirkpatrick et al., 2011). Additional dwarfs have been identified in proper motion surveys (e.g. Kirkpatrick et al., 2010; Lucas et al., 2010; Scholz et al., 2011; Liu et al., 2011). These surveys have been effective at finding brown dwarfs in the solar neighborhood; however, due to their faintness (a T8 dwarf has in H band), probing the larger-scale galactic distribution of cold dwarfs has not been possible.
Deep surveys in the near-infrared using the Wide Field Camera 3 (WFC3) on the HST enable the discovery of cold dwarfs at much larger distances. WFC3 parallel imaging surveys have identified cold dwarfs based on broad-band colors (e.g. Ryan et al., 2011), but the lack of spectroscopy means that the spectral types are uncertain. WFC3 near-infrared slitless grism spectroscopy, in contrast, permits unambiguous identification and classification of T dwarfs, whose spectra show pronounced atmospheric C and O absorption bands in the near-infrared (Geballe et al., 2002; Burgasser et al., 2002). Moreover, the WFC3 spectra reach depths that are unachievable with ground-based surveys.
Here we present three of the most distant cold brown dwarfs known, discovered in the WFC3 Infrared Spectroscopic Parallels (WISP) Survey. These discoveries illustrate that, by enabling spectroscopic identification of ultracool dwarfs at large distances, HST-WFC3 grism spectroscopy can begin to probe the galactic spatial distribution of the ultracool dwarf population and search for substellar members of the halo population (Burgasser et al., 2003).
2 WISP Survey Overview
The WISP Survey (Atek et al., 2010) has obtained slitless spectra over –m for more than 700 of sky using the two infrared grisms installed on the IR channel of Wide Field Camera 3 (WFC3). While the primary goal of WISP is to measure the star formation rate over , the wide area and variety of galactic latitudes covered by WISP allow for the discovery of late-type dwarfs out to kpc.
WISP is a “pure parallel” program, meaning that the pointings are determined by other observing programs using either the Cosmic Origins Spectrograph (COS) or the Space Telescope Imaging Spectrograph (STIS). The WFC3 observations are taken in a parallel field determined by the offset of the instruments and the roll angle of the telescope. WISP is divided into a deep, narrow survey for parallel targets with more than four orbits of visibility and a shallow, wide survey for parallel targets with one to three orbits of visibility. Parallel observing targets are selected at galactic latitudes with a preference for longer visibility times. Typical integration times for a 4–5 orbit target are 5000 sec in G102 and 2000 sec in G141. The shallower WISP fields are restricted to the G141 grism, with a typical integration time for a 2-orbit target of 4000 sec. Because the wide-shallow survey actually achieves deeper G141 integrations and covers a larger area than our deep-narrow survey, faint dwarfs are more likely to be found in the wide-shallow survey.
3 Ultracool Dwarfs Discovered in the WISP Survey
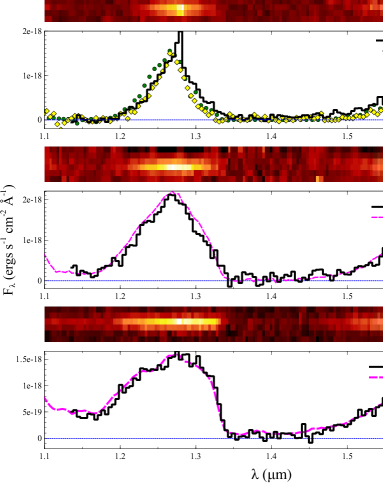
Brown dwarfs of type T2 are easily recognizable in H-band spectroscopy due to the presence of two prominent, broad pseudo-emission features at roughly 1.26 and 1.58 m interspersed with deep absorption bands of water and methane in their atmospheres. The 155 G141 grism exposures (each ) currently obtained by the ongoing WISP survey were systematically scanned by at least two observers to search for these objects, resulting in the identification of the three sources shown in Figure 1. Their properties are summarized in Table 1.
4 Spectral Classification
We determined the spectral types of the objects by comparing the WFC3 spectra to 69 T dwarf spectra from the SpeX Prism Spectral Libraries (Burgasser et al., 2006) and two additional Y dwarf spectra from Cushing et al. (2011), which were also obtained with the HST/WFC3 G141 grism using the same reduction software as the WISP survey spectra presented here. The WISP spectra and brown dwarf template spectra were compared using a statistic. The classifications and associated uncertainties were then found by computing the weighted mean and deviation from the mean with a weighting factor of . A cutoff weight of 0.1 was used so that the results are not skewed by a large number of poor fits to early-type T dwarfs (a sampling problem that arises because the template sample contains disproportionately more early-type T dwarfs).
WISP 1232-0033 and WISP 0307-7243 are found to be type T70.6 and T4.50.4, respectively. WISP 1305-2538 is found to be of type T9.5+, and is probably a Y dwarf. The spectrum of the Y0 dwarf WISE 1405+5534 is shown overlaid in Figure 1, in addition to the T9 dwarf UGPS 0722-0540. While neither template is perfect, the Y0 spectrum is a better fit.
5 Distance Determination
With accurate spectral types derived from the WFC3 spectra, the distances to the dwarfs can be found by comparing their measured broad-band magnitudes with those of nearby T dwarfs with known parallaxes. For this comparison, we converted the WFC3 F140W/F160W photometry for the WISP dwarfs into MKO J or H band with color corrections computed using the best-fitting T dwarf template spectra, applying the same weightings as for the spectral type determination. Given the inferred MKO J/H magnitudes, the distances were found using the absolute magnitude/spectral type relations of Dupuy & Liu (2012).
WISP 1232-0033 (T7) is found to be at 27060 pc and WISP 0307-7243 (T4.5) at 40060 pc. These are the most distant T dwarfs currently known, and have vertical scale heights of approximately 240 and 260 pc, respectively. WISP 1305-2538 is more difficult, as only one Y dwarf has reported a preliminary (and highly uncertain) parallax (WISE J154151.66225025.2, = 035011; Kirkpatrick et al., 2011) and the classification scheme for these objects remains in progress (Cushing et al., 2011). We used the known parallaxes of the T9 UGPS 0722-0540 (024600033; Lucas et al. 2010) and the T9.5 CFBDSIR J145829+101343B (034000026; Liu et al. 2011) to infer a distance of 40–60 pc for this source, albeit with considerable uncertainty because of the classification.
| Name | RA (J2000) | DEC (J2000) | WFC3 magnitude | MKO magnitude | Spectral Type | Distance | Galactic Latitude |
|---|---|---|---|---|---|---|---|
| (h m s) | (∘ ′ ′′) | (AB) | (AB) | (pc) | (deg) | ||
| WISP 1305-2538 | 13 05 25.51 | -25 38 28.8 | 23.010.04bbF140W | 22.330.04ddJ band | T9.5+ | 40-60aaThe interval arises from classification uncertainty and the current lack of quality parallaxes for Y dwarfs. | +37.1 |
| WISP 1232-0033 | 12 32 42.42 | -00 33 06.7 | 23.340.05bbF140W | 22.650.06ddJ band | T70.6 | 27060 | +63.1 |
| WISP 0307-7243 | 03 07 41.12 | -72 43 57.5 | 22.670.02ccF160W | 22.360.02eeH band | T4.5 | -40.9 |
6 Space Density
The dwarfs discovered in the WISP survey provide the first opportunity to examine the mass function and spatial distribution of these late-type dwarfs in a deep field (see Pirzkal et al., 2009 for an equivalent study of late M and L dwarfs). To assess what constraints our small sample makes on these statistics, we computed the expected suface densities of T dwarfs as a function of spectral type in the WISP survey fields as follows.
-
1.
Volume densities for the cold dwarf subtypes are computed using the methods outlined in Burgasser (2004, 2007). We assume a power-law stellar mass function with varying from -1 to 1, normalized to agree with measured field values in the 0.09-0.10 range (0.0055 pc-3; Reid et al., 1999; Chabrier, 2001). We then assumed an age distribution consistent with a constant star formation rate over 10 Gyr, and computed the luminosity distribution for the dwarfs using the evolutionary models of Burrows et al. (1997). Finally, we use empirical bolometric correction/spectral type (Liu et al., 2010) and absolute magnitude/spectral type (Dupuy & Liu, 2012) relations to convert the luminosity function to a spectral type surface density distribution.
-
2.
The expected surface density of dwarfs per WISP pointing is then found by computing the limiting magnitude, and thus the maximum distance, for which each subtype would be spectroscopically detected111We require S/N=10 in this analysis, an approximation based on simple tests with the WFC3 spectra. However, changing the S/N requirement can significantly influence the expected surface density of dwarfs. in a given field. The online WFC3 exposure time calculator is used for this analysis. Corrections to the derived limiting magnitudes are applied to account for Malmquist bias. We assumed as a first order approximation that 10% of each pointing is lost due to overlap, edge effects, etc. as estimated from the galaxy extractions.
-
3.
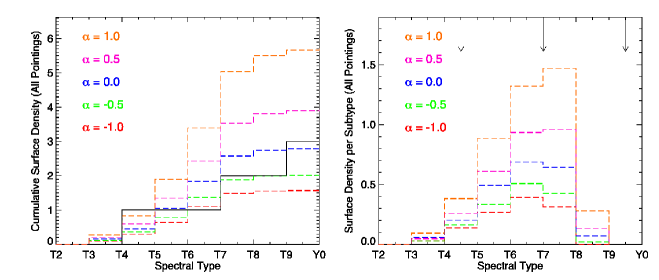
The effective volumes for each field/subtype are found and multiplied by the space densities per subtype. The results for all the WISP fields are added, yielding a surface density for each subtype for the entire survey (Figure 2).
The expected surface density of each spectral type across the entire WISP survey is summarized in Figure 2 for different assumed power-law slopes in the low-mass stellar mass function. The number of dwarfs found is roughly consistent with expectations; in particular, the fact that we find no early type (T4) dwarfs, despite their higher intrinsic luminosities, is consistent with their rarity (Burgasser, 2007). The fact that we identified three T dwarfs is consistent with other field mass function estimates based on wide, shallow surveys of T dwarfs (e.g. Metchev et al., 2008; Burningham et al., 2010). However, finding a T9.5/Y0 dwarf is somewhat surprising due to their faintness. Possible explanations for this include (1) a flatter absolute magnitude/spectral type relation than preliminary estimates indicate (Cushing et al., 2011; Kirkpatrick et al., 2011), (2) a sudden upturn in the space density of very late-type dwarfs, possibly associated with a nearby free-floating planetary population (Sumi et al., 2011) or a larger proportion of old halo brown dwarfs at higher scale heights (for this simulation, a 1:400 halo fraction was assumed based on Digby et al., 2003), (3) a fortuitous discovery, or (4) some combination of the above. We note that WISP 1305-2538 is 42 from the very low-mass triple Kelu 1ABC at 18.70.7 pc (Dahn et al., 2002; Liu & Leggett, 2005; Stumpf et al., 2008). With a 5000 AU projected separation, this matching is unlikely (Dhital et al., 2010), but second-epoch imaging would allow us to affirm or refute the existence of a widely-separated, very low-mass quadruple. Additionally, follow-up proper motion measurements of all three new dwarfs would help establish whether they are galactic halo members.
7 Summary
We have presented three distant T/Y dwarfs spectroscopically confirmed by the WISP Survey. These discoveries show the power of HST-WFC3 slitless grism spectroscopy to simultaneously find these objects at much larger distances than has been possible with ground-based surveys and yield accurate spectral types, making surveys such as WISP powerful new probes of the population of cold brown dwarfs in the galaxy.
References
- Atek et al. [2010] Atek, H., Malkan, M., McCarthy, P., et al. 2010, ApJ, 723, 104
- Burgasser [2004] Burgasser, A. J. 2004, ApJS, 155, 191
- Burgasser [2007] Burgasser, A. J. 2007, ApJ, 659, 655
- Burgasser et al. [2006] Burgasser, A. J., Geballe, T. R., Leggett, S. K., Kirkpatrick, J. D., & Golimowski, D. A. 2006, ApJ, 637, 1067
- Burgasser et al. [2002] Burgasser, A. J., Kirkpatrick, J. D., Brown, M. E., et al. 2002, ApJ, 564, 421
- Burgasser et al. [2010] Burgasser, A. J., Cruz, K. L., Cushing, M., et al. 2010, ApJ, 710, 1142
- Burgasser et al. [2003] Burgasser, A. J., Kirkpatrick, J. D., Burrows, A., et al. 2003, ApJ, 592, 1186
- Burningham et al. [2010] Burningham, B., Pinfield, D. J., Lucas, P. W., et al. 2010, MNRAS, 406, 1885
- Burrows et al. [1997] Burrows, A., Marley, M., Hubbard, W. B., et al. 1997, ApJ, 491, 856
- Chabrier [2001] Chabrier, G. 2001, ApJ, 554, 1274
- Chiu et al. [2006] Chiu, K., Fan, X., Leggett, S. K., et al. 2006, AJ, 131, 2722
- Chiu et al. [2008] Chiu, K., Liu, M. C., Jiang, L., et al. 2008, MNRAS, 385, L53
- Cushing et al. [2011] Cushing, M. C., Kirkpatrick, J. D., Gelino, C. R., et al. 2011, ApJ, 743, 50
- Dahn et al. [2002] Dahn, C. C., Harris, H. C., Vrba, F. J., et al. 2002, AJ, 124, 1170
- Delorme et al. [2008] Delorme, P., Willott, C. J., Forveille, T., et al. 2008, A&A, 484, 469
- Dhital et al. [2010] Dhital, S., West, A. A., Stassun, K. G., Bochanski, J. J. 2010, AJ, 139, 2566
- Digby et al. [2003] Digby, A. P., Hambly, N. C., Cooke, J. A., Reid, I. N., & Cannon, R. D. 2003, MNRAS, 344, 583
- Dupuy & Liu [2012] Dupuy, T. J., & Liu, M. C. 2012, ArXiv e-prints
- Geballe et al. [2002] Geballe, T. R., Knapp, G. R., Leggett, S. K., et al. 2002, ApJ, 564, 466
- Kirkpatrick et al. [1999] Kirkpatrick, J. D., Reid, I. N., Liebert, J., et al. 1999, ApJ, 519, 802
- Kirkpatrick et al. [2010] Kirkpatrick, J. D., Looper, D. L., Burgasser, A. J., et al. 2010, ApJS, 190, 100
- Kirkpatrick et al. [2011] Kirkpatrick, J. D., Cushing, M. C., Gelino, C. R., et al. 2011, ApJS, 197, 19
- Liu & Leggett [2005] Liu, M. C., & Leggett, S. K. 2005, ApJ, 634, 616
- Liu et al. [2010] Liu, M. C., Dupuy, T. J., & Leggett, S. K. 2010, ApJ, 722, 311
- Liu et al. [2011] Liu, M. C., Deacon, N. R., Magnier, E. A., et al. 2011, ApJL, 740, L32
- Lodieu et al. [2007] Lodieu, N., Pinfield, D. J., Leggett, S. K., et al. 2007, MNRAS, 379, 1423
- Lucas et al. [2010] Lucas, P. W., Tinney, C. G., Burningham, B., et al. 2010, MNRAS, 408, L56
- Metchev et al. [2008] Metchev, S. A., Kirkpatrick, J. D., Berriman, G. B., & Looper, D. 2008, ApJ, 676, 1281
- Nakajima et al. [1995] Nakajima, T., Oppenheimer, B. R., Kulkarni, S. R., et al. 1995, Nature, 378, 463
- Oppenheimer et al. [1995] Oppenheimer, B. R., Kulkarni, S. R., Matthews, K., & Nakajima, T. 1995, Science, 270, 1478
- Pirzkal et al. [2009] Pirzkal, N., Burgasser, A. J., Malhotra, S., et al. 2009, ApJ, 695, 1591
- Reid et al. [1999] Reid, I. N., Kirkpatrick, J. D., Liebert, J., et al. 1999, ApJ, 521, 613
- Ryan et al. [2011] Ryan, R. E., Thorman, P. A., Yan, H., et al. 2011, ApJ, 739, 83
- Scholz et al. [2011] Scholz, R.-D., Bihain, G., Schnurr, O. and Storm, J. 2011, A&A, 532, L5
- Strauss et al. [1999] Strauss, M. A., Fan, X., Gunn, J. E., et al. 1999, ApJ, 522, L61
- Stumpf et al. [2008] Stumpf, M. B., Brandner, W., Henning, T., et al. 2008, arXiv e-prints
- Sumi et al. [2011] Sumi, T., Kamiya, K., Bennett, D. P., et al. 2011, Nature, 473, 349
- Wright et al. [2010] Wright, E. L., Eisenhardt, P. R. M., Mainzer, A. K., et al. 2010, AJ, 140, 1868