Nearly itinerant ferromagnetism in CaNi2 and CaNi3
Abstract
Single crystals of CaNi2 and CaNi3 were successfully grown out of excess Ca. Both compounds manifest a metallic ground state with enhanced, temperature dependent magnetic susceptibility. The relatively high Stoner factors of and found for CaNi2 and CaNi3, respectively, reveal their close vicinity to ferromagnetic instabilities. The pronounced field dependence of the magnetic susceptibility of CaNi3 at low temperatures ( K) suggests strong ferromagnetic fluctuations. A corresponding contribution to the specific heat with a temperature dependence of ln was also observed.
I Introduction
Compounds of electropositive elements (e.g. Ca, Ti, La) and transition metals (e.g. Ni, Cu, Cr) have been studied, to a certain extent, to explore their potential for hydrogen storage applications Ishiyama et al. (1995); Chen et al. (2000). Among these, the members of the Ca-Ni family (CaNi2, CaNi3, Ca2Ni7, and CaNi5) were investigated by means of X-ray diffraction Buschow (1974). Cubic CaNi2 and trigonal CaNi3 were found to form CaNi2H3.4 and CaNi3H4.6 under elevated H-vapor pressures without changing the symmetry of the crystal structure Oesterreicher et al. (1980). However, despite these earlier investigations and the simplicity of these binary compounds, no experimental data on physical properties have been reported. The main reason for this lack of information is the challenging synthesis of these compounds caused by the high reactivity of Ca, which is highly air and moisture sensitive and tends to attack several standard crucible materials and manifests elevated vapor pressures of 1 bar at C (close to the melting point of elemental Ni).
In this paper we present a method for the growth of CaNi2 and CaNi3 single crystals from Ca-flux. Measurements of temperature dependent magnetization, electrical resistivity, and specific heat reveal a metallic ground state with an unusual high Stoner-factor, indicating strong ferromagnetic correlations in CaNi2 that are further enhanced in CaNi3.
II Experimental
X-ray powder diffraction (XRD) was performed on ground single crystals using a Rigaku Miniflex diffractometer (wavelength: Cu-). Lattice parameters were refined by the LeBail method using GSASLarson and Von Dreele and EXPGUIToby (2001). Laue-back-reflection patterns were taken with an MWL-110 camera manufactured by Multiwire Laboratories. Magnetization measurements were performed using a Quantum Design MPMS. Electrical resistivity was measured in 4-point geometry using the AC transport option of a Quantum Design PPMS. Silver epoxy was used to make electrical contacts on the samples and then cured at C under air for 20 min. The samples did not visually degrade and XRD measurements revealed no structural changes as a result of this treatment. Absolute values of the electrical resistivity are approximate due to the poorly defined geometry factor of the samples. Specific heat was measured by a heat-pulse relaxation method using a Quantum Design PPMS.
III Crystal growth
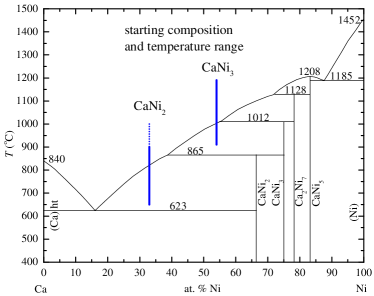
Starting materials were Ni-wire (Alfa Aesar, 99.98% metals basis) and distilled Ca (Ames Laboratory, Metals Developement, 99.98%). Best results were obtained by mixing Ca and pieces of Ni-wire in a molar ratio of 67:33 and 46:54 for CaNi2 and CaNi3, respectively, motivated by the published phase diagrams Notin et al. (1990); Okomoto (1990) (Fig. 1). The mixtures, each with a total mass of roughly 2.5 g, were packed into a 3-cap Ta-crucible Canfield and Fisher (2001) inside an Ar-filled glove box. A combination of laser welding and arc-melting was used to seal the Ta-crucibles under inert atmosphere (0.5 bar Ar).
In accordance with the results of Ref. Oesterreicher et al., 1980 we found no indications for an attack of Ta-crucibles by Ni.
III.1 CaNi2
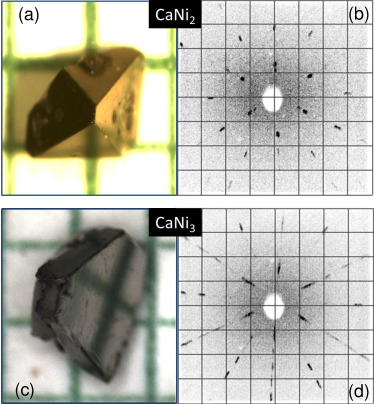
The Ca-Ni mixture was heated from room temperature to C over 5 h, cooled to C within 1 h, slowly cooled to C over 50 h and finally decanted to separate the CaNi2 crystals from the excess liquid. Single crystals of octahedral habit with dimensions up to 3 mm and masses of 25 mg could be obtained (Fig. 2a). The facets show a three fold rotation symmetry corresponding to {111} planes of the cubic lattice as confirmed by Laue back reflection (Fig. 2b.) The triangular hopper morphology seen in the center of some surfaces points to a surface diffusion limited growth that could be further improved best by stirring the melt or rotating the crucible or, to a lesser extent, by decreasing the cooling rate, see e.g. Ref. Elwell and Scheel, 1975.
III.2 CaNi3
The Ca-Ni mixture was heated from room temperature to C over 6 h, held at C for 1/2 h, slowly cooled to C over 32 h and finally decanted to separate the CaNi3 crystals from the excess liquid. Plate-like single crystals with lateral dimensions of up to 3 mm and thickness of 0.5 mm could be obtained (Fig. 2c). The threefold crystallographic -axis is oriented perpendicular to the large surface of the plates as confirmed by Laue back-reflection (Fig. 2d).
IV Structural characterization
After grinding and mounting the sample in an Ar glove box, the powder was covered with capton-foil that was attached to the sample holder using double-faced scotch tape. Once covered in this manner the sample was removed from the Ar glove box. The diffraction pattern taken on covered CaNi2 and CaNi3 samples did not change after removing the capton-foil and exposing the powder to air for one week. Therefore, both compounds are significantly less air sensitive than elemental Ca. However, the development of a field-dependence in the magnetic susceptibility at room-temperature was observed in samples that were stored under air for several weeks indicating the formation of a small ferromagnetic phase presumably due to formation of elemental Ni.
Figure 3a shows the XRD pattern measured on ground CaNi2 single crystals of together with the refined pattern based on the published crystal structure [space group (227)]. The lattice parameter Å is in good agreement with the literature data ( Å Oesterreicher et al. (1980)).

V Results
V.1 Magnetization
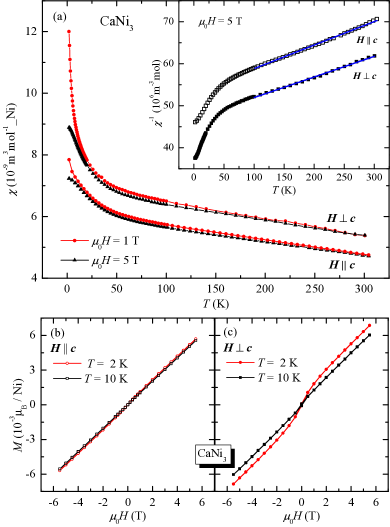
The magnetic susceptibility data per mol Ni are shown in Fig. 4a and Fig. 5a for CaNi2 and CaNi3, respectively. In both compounds is increasing significantly with decreasing which is in contrast to the -independent behavior expected for a simple metal. Between and 300 K is proportional to manifesting what could be interpreted as a Curie-Weiss-like behavior (insets in Fig. 4a and Fig. 5a).
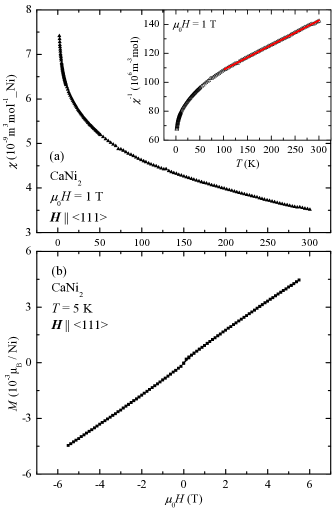
For CaNi2, the effective moment that can be inferred from this analysis is per Ni and the corresponding Weiss-temperature amounts to a large antiferromagnetic (AFM) value of K. Figure 4b shows the magnetization as a function of field in units of per Ni. at K increases in an essentially linear fashion with magnetic field with only a tiny anomaly around .
For CaNi3, the effective moment that can be inferred from this analysis is () and () per Ni. The Weiss-temperatures amount to large AFM values of K and K. As will be discussed below such high Weiss-temperatures are unphysical for intermetallic compounds that remain paramagnetic and indicate that such a local moment treatment of the data is most likely inappropriate. For K CaNi3 shows nearly no field-dependence of . In contrast to the high- behavior, a pronounced field-dependence of is emerging at K - more pronounced for - indicating strong ferromagnetic (FM) correlations.
of CaNi3 shows an almost perfectly linear field-dependence for K (for both and , black squares in Fig. 5b,c). At lower temperatures ( K) a small deviation from the linear behavior in is found for , whereas a clear curvature forms in for (red circles in Fig. 5b,c) in accordance with the field-dependence of at low temperatures.
V.2 Electrical resistivity
Figure 6 shows the electrical resistivity of CaNi2 (a) and CaNi3 (b) measured with current flow along and along the basal plane, respectively. The metallic behavior observed for CaNi2, demonstrated by the linear -dependence for K and an approximately quadratic -dependence at low , is modified for CaNi3 by an additional change of slope over a wide -range between and 200 K. Residual resistivity ratios of RRR = and 29 for CaNi2 and CaNi3, respectively, are consistent with good quality single crystals.
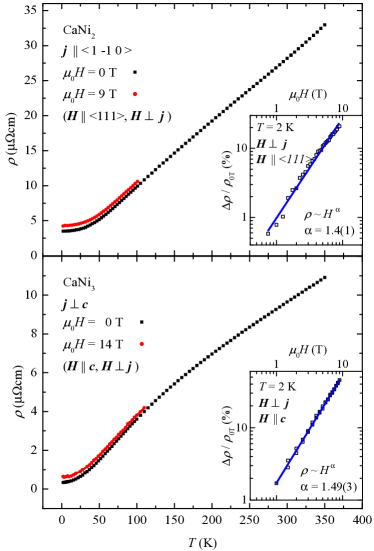
A positive magnetoresistance is observed for both compounds with increasing values towards low (filled, red circles and insets in Fig. 6, ). The field-dependence of at K follows a power-law dependence of with [1.4(1) and 1.49(3) for CaNi2 and CaNi3, respectively], which differs significantly from the expected value of for a simple metal. The values of % and 46% at T for CaNi2 and CaNi3, respectively, can be regarded as rather high taking into account the comparatively low RRR values when compared to simple metals in the picture of a Kohler plot (see e.g. Ref. Pippard, 1989) and are comparable with YAgSb2 Myers et al. (1999) but are significantly smaller than the large values of % found in PtSn4 Mun et al. (2012) (RRR 1000).
V.3 Specific heat
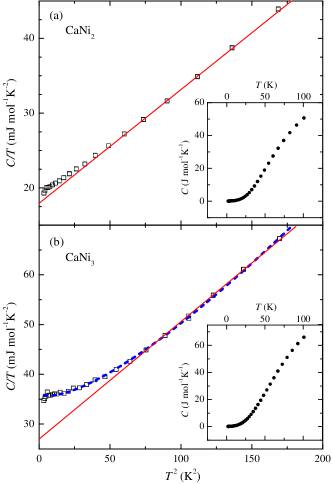
Figure 7 shows the specific heat of CaNi2 (a) and CaNi3 (b) plotted as vs. . Electron and phonon contribution are described by and are indicated by red lines in Fig. 7. A similar Sommerfeld-coefficient of mJ molK-2 was found for both compounds (when expressed of in terms per mole nickel). Additional contributions to the specific heat are observed for K. Whereas the deviations are small for CaNi2, there is a significant enhancement of for CaNi3 towards low most likely associated with FM fluctuations observed in the measurements. These magnetic fluctuations contribute to the specific heat by Tari (2003). The coefficients obtained by fitting the experimental data to the resulting equation are mJ molK-2, ,mJ molK-4, mJ molK-4, and K . The corresponding fit is plotted as dashed blue line in Fig. 7b. Note that the contribution of spin fluctuations to the specific heat is negative for corresponding to a shift of entropy to higher around . This is compensated by assuming a higher electron contribution to at low ( mJ molK-2 compared to mJ molK-2). Since the deviation of the measured specific heat of CaNi2 from the expected lattice and electron contribution are small, a quantitative estimate of and is not reliable. The specific heat data between and 100 K are plotted in the insets of Fig. 7, showing the expected decrease of slope in the upper -range towards approaching the Dulong-Petit limits (75 Jmol-1K-1 and 100 Jmol-1K-1, respectively).
VI Discussion
Our results on CaNi2 are in contrast to the findings of Tsvyashchenko et al., claiming weak ferromagnetism for CaNi2 at room-temperature Tsvyashchenko et al. (2002). However, no measured experimental data are presented in Ref. Tsvyashchenko et al., 2002. Therefore, we are not sure whether the discrepancy is due a modification of the structure caused by the high-pressure synthesis used by Tsvyashchenko et al. or simply the result of FM nickel impurities (or other second phases) which might be present in their polycrystalline samples.
Next we want to discuss the possibility of local magnetic moments indicated by the Curie-Weiss behavior of the magnetic susceptibility . In this scenario a large AFM exchange interaction has to be inferred from the observed Weiss-temperatures of and K, for CaNi2 and CaNi3, respectively. Effective moments of 1 (as obtained for this compounds) coupled by such strong interactions are expected to order antiferromagnetically above 100 K. However, there is no indication for an AFM ordering in the whole -range investigated. Therefore, the experimental results are incompatible with a local moment scenario unless the system is assumed to be extremely frustrated (highly unlikely in both of such different structures). Taking into account that Ni is not known to carry a local moment together with the FM correlations inferred from the low upturn in (Fig. 5a) makes this assumption unlikely.
A more plausible explanation for the increase in towards low is given by an enhancement of the normally only weakly -dependent terms of the paramagnetic susceptibility of a metal. Similar temperature dependence of was observed for elemental Pd Gerhardt et al. (1981) and more recently for YFe2Zn20 and LuFe2Zn20 Jia et al. (2007, 2009) and can be understood in terms of proximity to the Stoner limit. Thereby, the theoretical description is based on the temperature dependence of the Fermi-Dirac distribution function (within the framework of Stoner-theory) and leads to a qualitative agreement with the experimental data (see e.g. Ref. Zellermann et al., 2004).
The Stoner factor , defined by , can be used to quantify the strength of FM correlations (where is the renormalized Pauli susceptibility of a metal, ). can be calculated from the experimental data of and by (assuming density of states and magnetic susceptibility of the free electron gas). We find (CaNi2) and (CaNi3, T, ).
For the archetypical Stoner enhanced metal, elemental Pd, the calculation yields [ mJ mol-1K-2 (Ref. Stewart, 1983) and = 9.29 m3mol-1 (Ref. Gerhardt et al., 1981) of Pd are both similar to the values obtained for CaNi2 and CaNi3]. Therefore, at least CaNi3 is even closer to a FM ordered ground state than Pd and approaches the high values of found in YFe2Zn20 and LuFe2Zn20 Jia et al. (2009). Taking into account the field dependence of of CaNi3 (steeper increase of for T, see Fig. 5c), even higher Stoner factors are obtained, e.g. for T. Using the higher mJ molK-2 for CaNi3, and in doing so assume a larger electron contribution to the specific heat and accordingly a higher density of states at the Fermi-level, still leads to .
A major difference between CaNi2 and CaNi3 and other Stoner-enhanced metals like elemental Pd, YFe2Zn20 and LuFe2Zn20 is the absence of a maximum in at low . As shown by Yamada Yamada (1993) this maximum is correlated with a possible itinerant electron metamagnetic transition within Ginzburg-Landau theory and occurs when the Landau expansion coefficients () of the magnetic part of the free energy, , fulfill the condition . This is not the case for CaNi2 and CaNi3 (in the temperature range investigated) and accordingly no indications for a metamagnetic transition were observed in measurements.
Consistent with FM spin fluctuations inferred from the field-dependence of we observed an upturn in the low temperature specific heat of CaNi3 (Fig. 7b). Similar behavior has been observed in other FM, but close to paramagnetic (Ni0.63Rh0.37 Bucher et al. (1967)), or nearly FM itinerant electron systems (TiBe2 Stewart et al. (1982)). It remains an open question why this upturn is absent or significantly less pronounced in the nearly FM itinerant electron systems like Pd, YFe2Zn20, and LuFe2Zn20.
Since CaNi3 was found to be very close to a FM ordered ground state and the iso-structural compound YNi3 is a FM system with K Gignoux et al. (1980), we tried to tune the system by gradually substituting Y for Ca. However, first attempts to synthesize the alloy Ca1-xYxNi3 failed due to the formation of (Y,Ca)Ni5 and (Y,Ca)2Ni7.
Further efforts to systematically induce a FM transition are underway.
VII Summary
Single crystals of CaNi2 and CaNi3 have been grown and characterized by x-ray diffraction and temperature dependent electrical resistivity, magnetization and specific heat measurements. Both compounds manifest behavior consistent with Stoner enhanced, nearly ferromagnetic Fermi liquids with CaNi2 and CaNi3 having Stoner enhancement factors, Z, of 0.79 and 0.87, respectively. The low temperature specific heat of CaNi3 shows signatures of ferromagnetic fluctuations consistent with this Stoner enhanced state.
VIII Acknowledgments
The authors want to thank H. Hodovanets, S. K. Kim, X. Lin, S. M. Sauerbrei, and S. Ran for technical support. S. L. Bud’ko is acknowledged for technical support as well as for fruitful (Kirsche) discussions. This work was supported by the U.S. Department of Energy, Office of Basic Energy Science, Division of Materials Sciences and Engineering. The research was performed at the Ames Laboratory. Ames Laboratory is operated for the U.S. Department of Energy by Iowa State University under Contract No. DE-AC02-07CH11358.
References
- Ishiyama et al. (1995) S. Ishiyama, H. Ugachi, and M. Eto, J. Alloys Compd. 231, 895 (1995).
- Chen et al. (2000) J. Chen, H. T. Takeshita, H. Tanaka, N. Kuriyama, T. Sakai, I. Uehara, and M. Haruta, J. Alloys Compd. 302, 304 (2000).
- Buschow (1974) K. Buschow, J. Less-Common Met. 38, 95 (1974).
- Oesterreicher et al. (1980) H. Oesterreicher, K. Ensslen, A. Kerlin, and E. Bucher, Mater. Res. Bull. 15, 275 (1980).
- (5) A. C. Larson and R. B. Von Dreele, ”General Structure Analysis System (GSAS)”, Los Alamos National Laboratory Report LAUR 86-748 (2000).
- Toby (2001) B. H. Toby, J. Appl. Crystallogr. 34, 210 (2001).
- Notin et al. (1990) M. Notin, D. Belbacha, M. Rahmane, J. Hertz, G. Saindrenan, and J. Jorda, J. Less-Common Met. 162, 221 (1990).
- Okomoto (1990) H. Okomoto, in Binary Alloy Phase Diagrams, Vol. 1, edited by T. B. Massalski (1990) 2nd ed.
- Canfield and Fisher (2001) P. Canfield and I. Fisher, J. Cryst. Growth 225, 155 (2001).
- Elwell and Scheel (1975) D. Elwell and H. J. Scheel, Crystal Growth from High-Temperature Solutions (Academic Press Inc., London, 1975).
- Pippard (1989) A. B. Pippard, Magnetoresistance of Metals (Cambridge University Press, 1989).
- Myers et al. (1999) K. D. Myers, S. L. Bud’ko, I. R. Fisher, Z. Islam, H. Kleinke, L. A. H, and P. C. Canfield, J. Magn. Magn. Mater. 205, 27 (1999).
- Mun et al. (2012) E. Mun, H. Ko, G. J. Miller, G. D. Samolyuk, S. L. Bud’ko, and P. C. Canfield, Phys. Rev. B 85, 035135 (2012).
- Tari (2003) A. Tari, The specific heat of matter at low temperatures (Imperial College Press, London, 2003).
- Tsvyashchenko et al. (2002) A. V. Tsvyashchenko, L. N. Fomicheva, M. V. Magnitskaya, V. A. Sidorov, E. N. Shirani, A. V. Kuznetsov, D. V. Eremenko, and V. N. Trofimov, Phys. Met. Metall. 93, S59 (2002).
- Gerhardt et al. (1981) W. Gerhardt, F. Razavi, J. S. Schilling, D. Hüser, and J. A. Mydosh, Phys. Rev. B 24, 6744 (1981).
- Jia et al. (2007) S. Jia, S. L. Bud’ko, G. D. Samolyuk, and P. C. Canfield, Nat. Phys. 3, 334 (2007).
- Jia et al. (2009) S. Jia, N. Ni, S. L. Bud’ko, and P. C. Canfield, Phys. Rev. B 80, 104403 (2009).
- Zellermann et al. (2004) B. Zellermann, A. Paintner, and J. Voitländer, J. Phys. Condens. Matter 16, 919 (2004).
- Stewart (1983) G. R. Stewart, Rev. Sci. Instrum. 54, 1 (1983).
- Yamada (1993) H. Yamada, Phys. Rev. B 47, 11211 (1993).
- Bucher et al. (1967) E. Bucher, W. F. Brinkman, J. P. Maita, and H. J. Williams, Phys. Rev. Lett. 18, 1125 (1967).
- Stewart et al. (1982) G. R. Stewart, J. L. Smith, and B. L. Brandt, Phys. Rev. B 26, 3783 (1982).
- Gignoux et al. (1980) D. Gignoux, R. Lemaire, P. Molho, and F. Tasset, J. Magn. Magn. Mater. 15 18, 289 (1980).