Muon-spin rotation and magnetization studies of chemical and hydrostatic pressure effects in EuFe2(As1-xPx)2
Abstract
The magnetic phase diagram of EuFe2(As1-xPx)2 was investigated by means of magnetization and muon-spin rotation (SR) studies as a function of chemical (isovalent substitution of As by P) and hydrostatic pressure. The magnetic phase diagrams of the magnetic ordering of the Eu and Fe spins with respect to P content and hydrostatic pressure are determined and discussed. The present investigations reveal that the magnetic coupling between the Eu and the Fe sublattices strongly depends on chemical and hydrostatic pressure. It is found that chemical and hydrostatic pressure have a similar effect on the Eu and Fe magnetic order.
pacs:
74.20.Mn, 74.25.Ha, 74.70.Xa, 76.75.+iI Introduction
The discovery of superconductivity in the iron-based pnictides Kamihara08 provided a new class of compounds to the high temperature superconductor (HTS) family. Ternary iron arsenide Fe2As2 ( = Sr, Ca, Ba, Eu) Rotter is one of the parent compounds with ThCr2Si2-type structure. In analogy with FeAsO ( = La-Gd),Chen Fe2As2 undergoes a structural phase transition from a tetragonal to an orthorombic phase, accompanied or followed by a spin-density-wave (SDW) transition of the itinerant Fe moments. The superconducting (SC) state can be achieved either under pressure (chemical and hydrostatic) Torikachvili ; Fukazawa ; Terashima or by appropriate charge carrier doping of the parent compounds, RenLu08 ; Matsuishi08 ; Zhao08 both accompanied by a suppression of the SDW state.
Here, we focus on EuFe2As2 which is a particularly interesting member of the ternary
system Fe2As2, since the site is occupied by a rare earth Eu2+ -state (orbital moment = 0) ion with a 47 electronic configuration. Eu2+ has a total
electron spin = 7/2, corresponding to a theoretical
effective magnetic moment of = 7.94 B. In addition to the
SDW ordering of the Fe moments at 190 K, an antiferromagnetic (AFM)
order of the Eu2+ spins
at 19 K was reported by Mössbauer spectroscopy Raffius93 and
later confirmed by neutron diffraction.Xiao09
Various reports on EuFe2-xCoxAs2 ( = 0 and 0.1) suggest a
strong coupling between the magnetism of the Eu2+ ions and the conduction electrons,
which may affect or even destroy superconductivity.SJiang ; Guguchia
For example, in contrast to the
other ’122’ systems, where the substitution of Fe by Co leads to
superconductivity, Sefat ; Jasper the compounds containing Eu2+ exhibit the onset of a superconducting
transition, but seem to be hindered to reach zero resistivity at ambient pressure. He08
Although Ni doping in BaFe2As2 leads to superconductivity up to 21 K,LiLuo08
ferromagnetism rather than superconductivity was found
in EuFe2As2 by Ni doping.ZRen09
On the other hand, in single crystals of P substituted EuFe2(As1-xPx)2
bulk superconductivity with superconducting transition temperature 28 K
was observed by resistivity, magnetization, and specific heat measurements.Jeevan
Isovalent P substitution on the As site in EuFe2As2 without introducing
holes or electrons, simulates a condition generally referred to as ”chemical pressure”.
Superconductivity coexisting with AFM Eu2+ order
was only found in a very narrow range of P content
(0.16 0.22), where the SDW transition is suppressed.
Superconductivity with a zero resistivity state was also observed for
EuFe2As2 under applied pressure.Terashima ; Matsubayashi
Similar to the case of P substitution, superconductivity covers only a
narrow pressure range of 2.5-3.0 GPa.
In this paper we report detailed magnetization and muon spin rotation (SR) measurements in EuFe2As2-xPx as a function of the P content . One P substituted sample EuFe2(As0.88P0.12)2 was also studied under applied pressure . The SR technique is a powerful tool to study the magnetic and superconducting properties of materials microscopically. It provides reliable measurements of , , the magnetic ordering temperature of Eu2+ spins and the ordered moment size as a function of both and . Consequently, the phase diagrams with respect and are determined from these measurements. We compare the present results with previous high pressure studies on the parent compound EuFe2As2 and discuss the combined results in terms of the relation of and . The paper is organized as follows: Experimental details are described in Sec. II. The results of the magnetic susceptibility and the SR experiments at ambient and applied pressure are presented and discussed in Sec. III(A) and III(B), respectively. In Sec. IV the phase diagrams are presented. The conclusions follow in Sec. V.
II EXPERIMENTAL DETAILS
In the present work the system EuFe2(As1-xPx)2 with = 0, 0.12, 0.2, and 1 is investigated. Note that the sample with = 0 is single crystalline, and all the P substituted compounds are pollycrystalline. The concentrations = 0.12, and 0.2 were studied due to their proximity to the SC phase reported in Ref. 19. A single crystal of EuFe2As2 was grown out of Sn flux.Guguchia2011 Polycrystalline samples were synthesized by solid-state reaction between EuAs, Fe2As, and Fe2P. EuAs was presynthesized by heating europium grains and phosphorus powders very slowly to 1173 K followed by a tempering at this temperature for 36 h. Fe2As was prepared by heating Fe and As powders at 973 K for 10 h and at 1173 K for 15 h. Fe2P was presynthesized by reacting iron and phosphorus powders at 973 K for 24 h from stoichiometric amounts of the elements. All the starting materials had a purity better than 99.9 . Powders of EuAs, Fe2As and Fe2P were weighted according to the stoichiometric ratio, thoroughly ground and pressed into pellets in an argon-filled glove box. The pellets were then sealed in an evacuated quartz tube, sintered at 1273 K for 36 h, and then cooled slowly to room temperature.
Powder X-ray diffraction (XRD) studies of the EuFe2(As1-xPx)2 samples were carried out at room temperature with a STOE diffractometer (CuKα1 radiation, = 1.5406 Å) equipped with a mini-phase-sensitive detector and a Ge monochromator. The structural refinements were done using the program FULLPROF.Rodriges The zero-field-cooled and field-cooled (ZFC and FC) magnetization measurements of the EuFe2(As1-xPx)2 samples were performed with a commercial SQUID magnetometer ( MPMS-XL). The samples with = 0.2 and 1 were studied only at ambient pressure. For = 0.12, the investigations were also carried out under applied pressures up to = 5.9 GPa by using a diamond anvil cell (DAC) filled with Daphne oil which served as a pressure-transmitting medium. The pressure at low temperatures was determined by the pressure dependence of the SC transition temperature of Pb.
Zero-field (ZF) SR experiments were performed at the E1 and M3 beamlines of the Paul Scherrer Institute (Villigen, Switzerland). The general purpose instrument (GPS) was used to study the system EuFe2(As1-xPx)2 ( = 0, 0.12, 0.2, and 1) at ambient pressure. The samples were mounted inside of a gas-flow 4He cryostat on a sample holder with a standard veto setup providing a low-background SR signal. In addition, the sample with = 0.12 was studied under pressure using the GPD instrument. Pressures up to 2.0 GPa were generated in a double wall piston-cylinder type of cell made of MP35N Andreica material especially designed to perform SR experiments under pressure. As a pressure transmitting medium Daphne oil was used. The pressure was measured by tracking the SC transition of a very small indium plate by AC susceptibility. The SR time spectra were analyzed using the free software package MUSRFIT.Suter
III RESULTS AND DISCUSSION
III.1 Crystal structure and magnetic properties of EuFe2(As1-xPx)2
III.1.1 X-ray powder diffraction
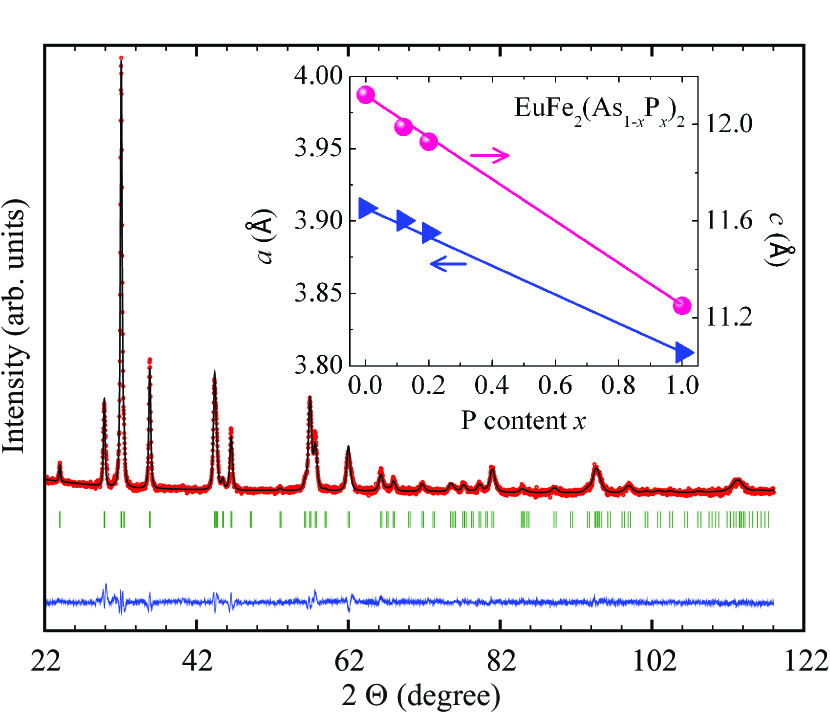
The crystal structure for all EuFe2(As1-xPx)2 samples at room temperature was refined with the tetragonal ThCr2Si2 structure. An example of the refinement profile for EuFe2(As0.88P0.12)2 is shown in Fig. 1. No obvious secondary phase can be detected. The weighted pattern factor and goodness of fit are 11.2 and S 1.6, respectively, indicating a fairly good refinement. In addition, the refined occupancies are close to the nominal values. The lattice constants for the tetragonal unit cell based upon the Rietveld refinements are = 3.9095(2) Å and = 11.979(1) Å for = 0.12, = 3.9006(2) Å and = 11.9312(1) Å for = 0.2, = 3.8152(2) Å and = 11.2401(1) Å for = 1. The values for = 1 are in agreement with the literature values [ = 3.8178(1) Å and = 11.2372(3) Å].GCao The lattice constants and as a function of are plotted in the inset of Fig. 1. A decrease of both and with increasing is observed. The decrease of the lattice constant as a result of P substitution implies an increase of the coupling between the Eu and the FeAs1-xPx)2 layers. This might also be important for the evolution of the magnetic order in the Eu-sublattice, since the Ruderman-Kittel-Kasuya-Yosida (RKKY) coupling strongly depends on the distance between the magnetic ions.ZRen09 ; Guguchia ; GCao
III.1.2 Magnetization measurements
The temperature dependence of the zero-field-cooled (ZFC) and field-cooled (FC) magnetic susceptibility = / for EuFe2(As1-xPx)2 ( = 0.12, 0.2, and 1) in a magnetic field of = 2 mT is shown in Fig. 2. The results for = 0 were already discussed in detail in our previous work,Guguchia2011 and hence, are not shown here. The magnetic susceptibility at high temperatures ( far above the magnetic ordering temperature of the Eu2+ moments ) is well described by the Curie-Weiss law:
| (1) |
Here, C denotes the Curie constant and CW the paramagnetic Curie-Weiss temperature. An analysis of the data in Fig. 2 with Eq. (1) yields: CW = 16.74(8) K, eff 8.1 B for = 0.12, CW = 18.14(7) K, eff 8.2 B for = 0.2, and CW = 29.35(9) K, eff 8.3 B for = 1. The obtained values of eff are close to the theoretical value of a free Eu2+ ion ( = 7.94 B).
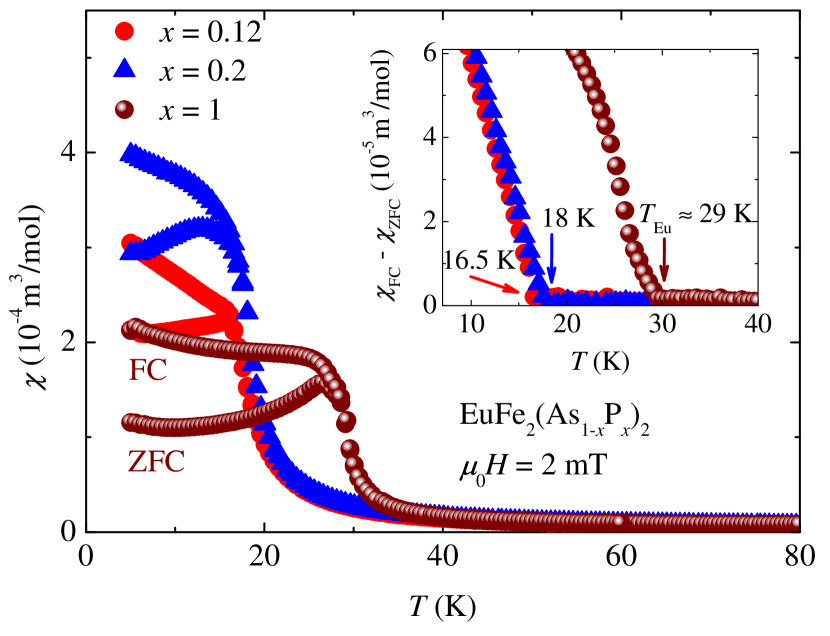
As shown in Fig. 2 for all the P substituted samples an obvious deviation between and is seen at low temperatures. This is not the case for = 0,ZRen09 ; Guguchia2011 for which AFM order of Eu2+ with the moments pointing along the axis was reported. This result is consistent with previous magnetizaton studies,Sina suggesting that the ground state of the coupled Eu2+ spins is a canted AFM state (C-AFM state) (i.e., AFM with the net ferromagnetic (FM) component along the -axis) in EuFe2(As1-xPx)2 ( = 0.12, 0.2) and a FM state in EuFe2P2. Recently, neutron diffraction measurements were also performed on EuFe2P2 and an almost axial FM structure of the Eu2+ spins was established.Ryan The C-AFM and FM structure of the Eu-sublattice in EuFe2(As1-xPx)2 ( = 0.12, 0.2, 1) sharply contrasts with the planar antiferromagnetism seen in the parent compound EuFe2As2, suggesting a delicate interplay between the Eu 4 and the Fe 3 electrons. It was concluded from different experiments SJiang ; Guguchia that there is a strong coupling between the localized Eu2+ spins and the conduction electrons of the two-dimensional (2D) Fe2As2 layers in EuFe2As2. This revealed that the magnetic exchange interaction between the localized Eu 4 moments is mediated by the itinerant Fe 3 electrons. However, the interaction of the Eu moments with the magnetic moments of the Fe sublattice (band magnetism) cannot be neglected. Only a combination of both interactions can further elucidate the C-AFM ground state observed in EuFe2(As1-xPx)2 ( = 0.12 and 0.2). Note that a C-AFM ground state was also found in the related compound EuFe1.8Co0.2As2.Guguchia2011
The magnetic ordering temperature of the Eu2+ moments was determined by the temperature at which the difference between and sets in (see inset of Fig. 2). It was found to be 16.5 K, 18 K, and 29 K for = 0.12, = 0.2, and = 1, respectively. The value of for = 0.12 is slightly reduced compared to 19 K for the parent compound = 0. However, on further increasing the P concentration increases and reaches a maximum for = 1. The value of for = 1 is in agreement with those reported in literature.Jeevan ; GCao ; Ryan
III.1.3 Zero-field SR measurements
In a SR experiment nearly 100 spin-polarized muons +
are implanted into the sample one at a time. The positively
charged + thermalize at interstitial lattice sites, where they
act as magnetic microprobes. In a magnetic material the
muon spin precesses in the local magnetic field at the
muon site with the Larmor frequency = /(2 (muon
gyromagnetic ratio /(2) = 135.5 MHz T-1).
ZF SR is a very powerfull tool
to investigate microscopic magnetic properties of solids without applying an external magnetic field.
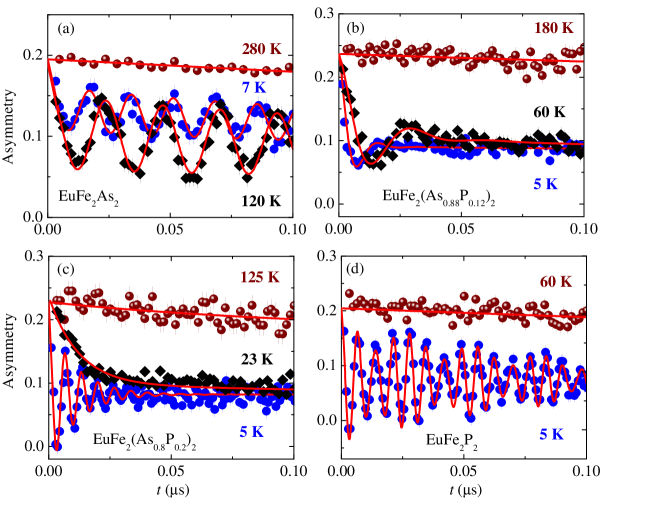
ZF SR time spectra for the single crystal of EuFe2As2 and for the polycrystalline samples EuFe2(As1-xPx)2 are shown in Fig. 3, recorded for three different temperatures: , , and . For EuFe2As2 the ZF SR measurements were performed with the initial muon spin polarization tilted by approximately 45∘ away from the crystallographic -axis. At high temperatures (see Fig. 3), no muon spin precession and only a very weak depolarization of the SR signal is observed. This weak depolarization and its Gaussian functional form are typical for a paramagnetic material and reflect the occurrence of a small Gaussian-Kubo-Toyabe depolarization, originating from the interaction of the muon spin with randomly oriented nuclear magnetic moments. At temperatures below a well-defined spontaneous muon spin precession is observed in all compounds, indicating long-range magnetic order of the Eu2+ moments in the investigated compounds. For = 0 and 0.12 above 20.5 K and 16.5 K, respectively, muon spin precession with a lower frequency is observed which is caused by the long-range SDW order of the Fe moments. However, for , instead of the oscillatory behavior seen in the SDW state for = 0 and 0.12, a fast decaying signal is observed (see Fig. 3c). The reason for this strongly decaying SR signal will be discussed below. For = 1 only the magnetic ordering of the Eu moments is seen in the SR spectra (Fig. 3d). Note that for = 0, 0.12 and 0.2 only one SR frequency is visible. However, for = 1 two distinct precession frequencies occur in the SR spectra, corresponding to the local magnetic fields 1.08 T ( 70 of the signal) and 1.37 T ( 30 of the signal). This indicates that two magnetically inequivalent muon stopping sites are present in EuFe2P2.
The ZF SR data were analyzed using the following functional form:
| (2) |
and = 1 - (i = 1 for = 0, 0.12, 0.2, and i = 1, 2 for = 1) are the fractions of the oscillating and nonoscillating SR signal. For the single crystal ( = 0) one finds = 0.73(2) and = 0.27(3). However, for the polycrystalline samples = 2/3 and = 1/3. The 2/3 oscillating and the 1/3 nonoscillating SR signal fractions originate from the spatial averaging in powder samples where only 2/3 of the magnetic field components are perpendicular to the muon spin and cause muon spin precession. denotes the initial asymmetry, and is the initial phase of the muon-spin ensemble. represents the internal magnetic field at the muon site, and the depolarization rates and characterize the damping of the oscillating and nonoscillating part of the SR signal, respectively. The transversal relaxation rate is a measure of the width of the static magnetic field distribution at the muon site, and also reflects dynamical effects (spin fluctuations). The longitudinal relaxation rate is determined by dynamic magnetic fluctuations only.maeter
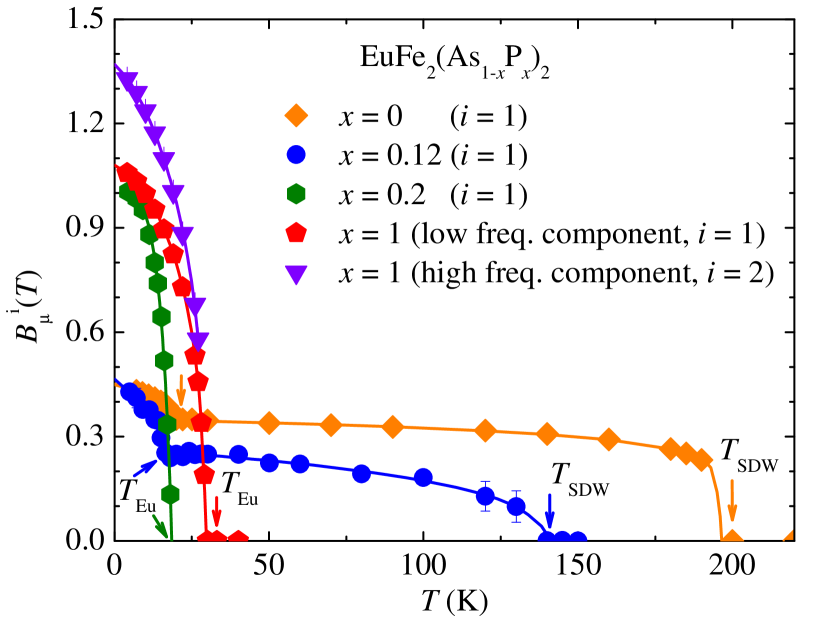
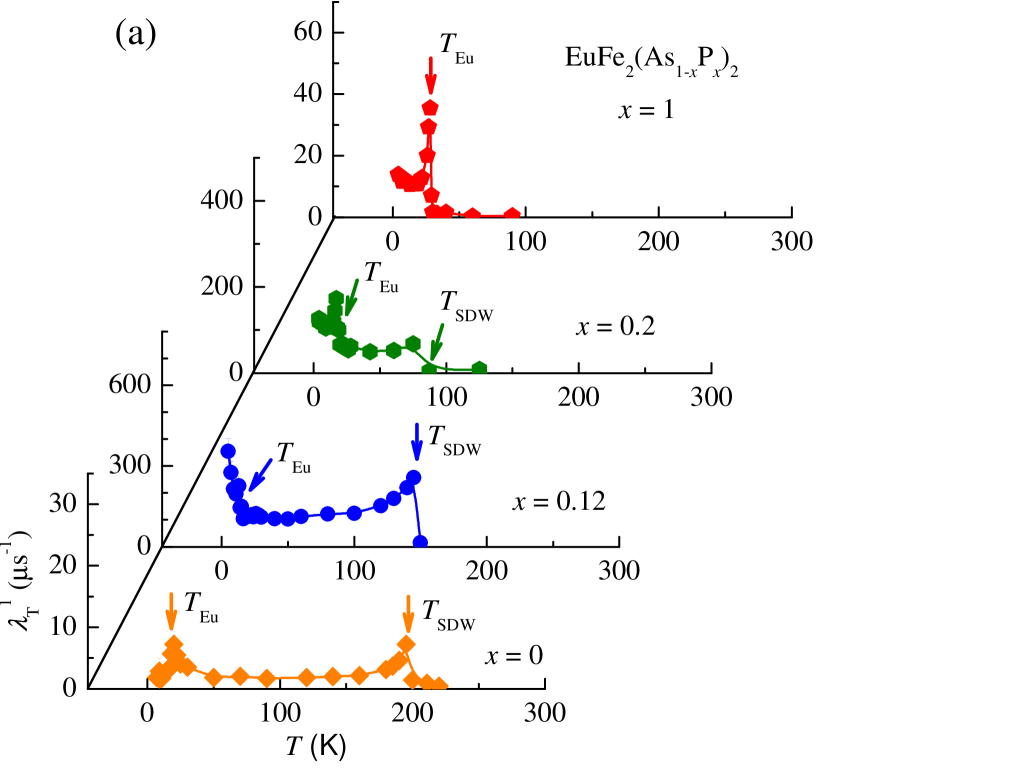
The temperature dependence of the internal magnetic field for EuFe2(As1-xPx)2 is shown in Fig. 4. is proportional to the magnitude of the ordered moment and thus to the magnetic order parameter. The second component ( = 2) in the SR signal was observed only for =1, and hence, we will discuss the -dependence of the relevant physical parameters related to the first component ( = 1) only. For = 0 a sharp step like increase of is observed below 195 K, which reflects the appearance of the SDW ordering of the Fe moments. The value of is in good agreement with 190 K obtained from neutron diffraction.Xiao09 A sharp increase of is an indication for a first order transition. A first order transition due to SDW formation was also observed in the related compound SrFe2As2.Jesche Upon lowering the temperature first tends to saturate, but increases again when the magnetic order of the Eu2+ moments occurs at .
| (0) | (0) | (0) | (0) | |||||
|---|---|---|---|---|---|---|---|---|
| (K) | (K) | (K) | (T) | (T) | (T) | (T) | ||
| 0 | 19.5(6) | 20.5(5) | 195(3) | 0.45(1) | - | 0.35(1) | - | |
| 0.12 | 16.5(5) | 16.7(6) | 140(5) | 0.476(12) | - | 0.258(10) | - | |
| 0.2 | 17.9(5) | 18.4(2) | 85 | 0.997(12) | - | 0 | - | |
| 1 | 29.5(5) | 29.3(4) | 0 | 1.08(1) | 1.37(2) | 0 | 0 |
To describe the temperature dependence of we assumed the following phenomenological function:
| (3) |
where (0) and (0) represent the zero-temperature values of the internal magnetic field probed by the muons in the Eu and in the SDW ordered states, respectively. and are empirical exponents. As indicated by the solid lines in Fig. 4 the function in Eq. (3) describes the data reasonably well, yielding the parameters given in Table. I. Note that with increasing the values of and (0) decrease, and for = 0.2 and = 1 no long-range SDW order of the Fe moments is observed. On the other hand, decreases with increasing , reaches minimum at = 0.12 and then increases again, in agreement with the above susceptibility measurements. In addition, (0) significantly increases with above =0.12. Considering the magnetization results, the increase of (0) may be ascribed to the appearance/growth of the ferromagnetic component as a result of P substitution. However, without microscopic modeling (i.e., calculation of the stopping site and the dipolar fields at the site) it is not possible to conclude how a change of the magnetic structure with P substitution would affect the internal field at the muon site.
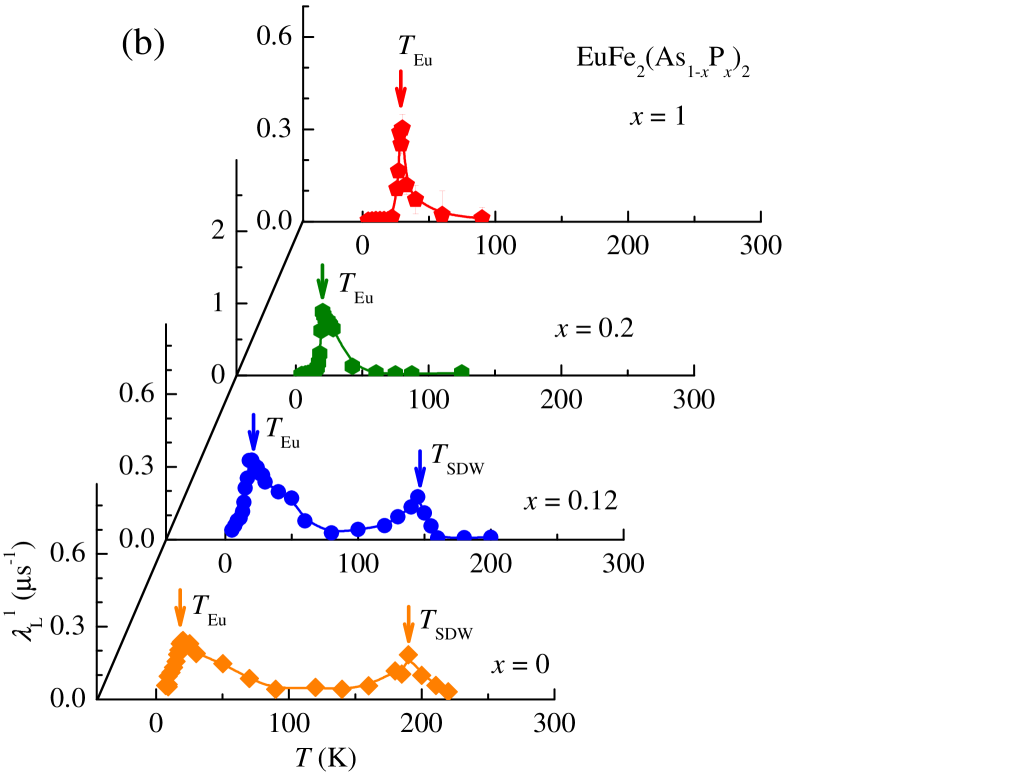
The temperature dependences of the transverse and longitudinal depolarization rates
and are
presented in Figs. 5a and 5b, respectively. Note that is much smaller
for the end members = 0, 1 of the investigated system than for the
mixed compounds = 0.12, 0.2.
As shown in Fig. 5a, for = 0, 0.12, and 0.2 the onset of the Fe
magnetic order is accompanied by an increase of
that decreases with decreasing temperature.
Upon reaching the magnetic ordering temperature of Eu
shows another maximum. For = 1, the strong increase of
around is only due the Eu order. No SDW transition is observed at higher temperatures.
The magnetic ordering temperatures of Eu () and Fe () are also clearly
visible in the longitudinal relaxation rate , which also shows
a clear anomaly at and (see Fig. 5b).
As mentioned above, for the sample with = 0.2 (see Fig. 3c, diamonds) only
a fast depolarization of the implanted muons is observed above , but no coherent
precession signal. The fast depolarization of the SR signal could be either due to a wide
distribution of static fields, and/or to strongly fluctuating
magnetic moments. To discriminate between these two possibilities we compare the
values of and .
Note that for = 0.2, and 85 K is
very large ( 50 MHz) while is small ( 0.05 MHz).
consists of a static as well as of a dynamic contribution, while
contains only a dynamic contribution. Since in our case
,
the static contribution dominates , and
the fast depolarization of the SR signal observed for = 0.2 is due to the
(quasi-)static disordered SDW phase with 85 K.
The important parameters for all samples extracted from the magnetization and the SR experiments are summarized in
Table I.
Very recently, bulk superconductivity with 28 K
was reported in single crystals of P substituted EuFe2(As1-xPx)2, Jeevan
based on resistivity, magnetization, and specific heat measurements.
However, superconductivity coexisting with AFM Eu2+ order
was only found in a very narrow range
(0.16 0.22), where the SDW transition is suppressed.
In the present study no indication of superconductivity was seen for = 0.2 from
magnetization measurements.
This might be due to the fact that in our sample ( = 0.2) the SDW state is not completely
suppressed as supported by the SR measurements.
In addition to chemical pressure, the physical properties of
EuFe2As2 can be also tuned by the application of hydrostatic pressure.Terashima ; Matsubayashi
Previous reports of high pressure experiments on EuFe2As2
revealed pressure-induced superconductivity in a narrow pressure range of 2.5-3.0 GPa,Terashima ; Matsubayashi
accompanied by a suppression of the SDW state of the Fe moments.
Since pressure experiments on EuFe2As2 were already reported by various groups,Terashima ; Matsubayashi
we decided to study pressure effects in the P substituted sample EuFe2(As0.88P0.12)2.
The sample with = 0.12 was chosen for the following reasons:
1) according to the SC phase diagram reported Jeevan for
EuFe2As2 as a function of chemical pressure (P content )
the sample with = 0.12 is close to the value of at which superconductivity
appears. By applying hydrostatic pressure, the SC phase might be reachable.
2) based on previous reports,Terashima ; Matsubayashi superconductivity was found in the vicinity
of the pressure value where the SDW state is suppressed.
In the following sections the results of the magnetization and the SR experiments
performed on EuFe2(As0.88P0.12)2 under hydrostatic
pressures are presented.
III.2 Hydrostatic pressure effect on EuFe2(As0.88P0.12)2
III.2.1 High pressure magnetization measurements

Magnetization measurements were carried out under hydrostatic pressures
up to = 5.9 GPa. The temperature dependence of the ZFC and FC
magnetic susceptibilities for EuFe2(As0.88P0.12)2
recorded at ambient and selected applied
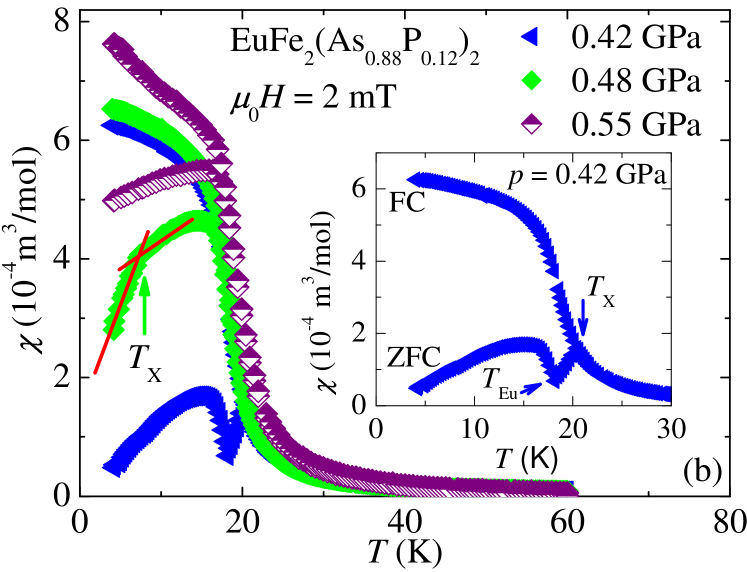
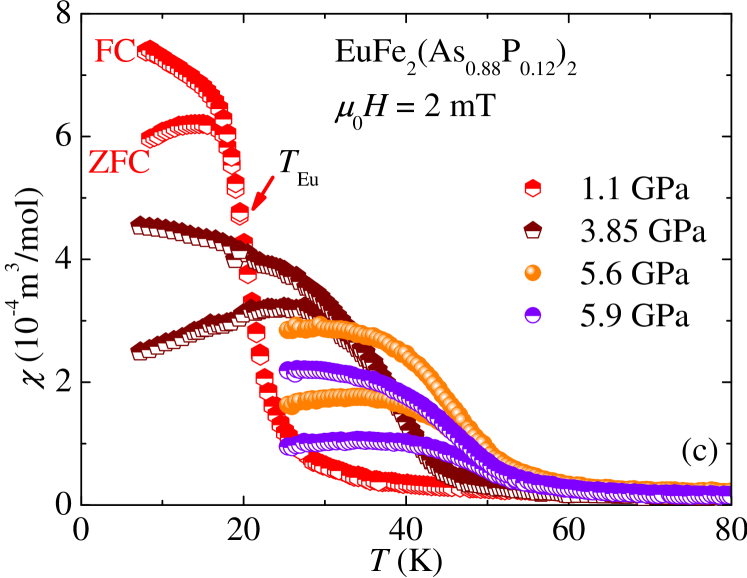
pressures is shown in Fig. 6a ( 0.4 GPa), in Fig. 6b (0.42 GPa 0.55 GPa),
and in Fig. 6c (1.1 GPa 5.9 GPa). Note that Fig. 6 shows the data
after subtraction of the background signal
from the empty pressure cell.
The magnetic ordering temperature
of the Eu2+ moments was determined as described in Sec. IIIA.2.
At ambient pressure a clear bifurcation between the ZFC and FC curves
appears below 16.5 K, which is consistent
with the susceptibility data obtained for the sample without pressure cell (see Fig. 2).
In addition, the magnitudes of the susceptibilities are also in fair agreement.
Upon increasing the pressure an anomaly in the ZFC susceptibility is observed at
= 0.4 GPa, 0.42 GPa and 0.48 GPa as shown in Figs. 6a and 6b.
The low-temperature data for = 0.4 GPa are shown in the inset of Fig. 6a. In addition to the Eu order
observed at 18 K, a strong decrease of the ZFC susceptibility is observed at
11 K, which is possibly due to the appearance of superconductivity.
The decrease of the susceptibility corresponds to nearly 100 diamagnetic shielding.
In order to confirm superconductivity transport measurements under pressure are necessary. Only
magnetization data do not allow to conlcude that the observed decrease of
is due to the appearance of superconductivity. Hence we call this phase ”X”.
For = 0.42 GPa the susceptibility also shows a pronounced decrease at 20 K (see Fig. 2b,
the low-temperature data are shown in the inset).
Below 18.2 K the susceptibility starts to increase again due to the C-AFM ordering of the Eu2+ moments.
Upon increasing the pressure to = 0.47 GPa the transition temperature decreases to 8.8 K.
Above = 0.55 GPa the ”X” phase is no longer visible (see Fig. 6c). It is also absent for
0.35 GPa. Therefore, pressure-induced ”X” phase in EuFe2(As0.88P0.12)2
is very likely present in a very narrow pressure range.
We observed that increases upon increasing
hydrostatic pressure, similar to chemical pressure.
The maximum value of = 56 K is reached at = 5.6 GPa, and
at higher pressures it tends to decrease (see Fig. 6c).
For instance, = 53 K at the maximum applied pressure = 5.9 GPa.
A maximum of was also observed for the parent compound
EuFe2As2, but at higher pressure ( = 8 GPa).
According to recent X-ray diffraction studies Uhoya of
EuFe2As2, a collapsed tetragonal
(cT) phase was found above 8 GPa.
It is known that the pressure-induced structural transition toward the cT phase is
connected with a valence change of the Eu ions, as reported
for EuFe2P2 and EuCo2P2.Ni Therefore, it is possible that
the decrease of above 5.6 GPa is connected with a pressure-induced valence change
from the magnetic Eu2+ to the nonmagnetic Eu3+
state. However, to gain further insight into this pressure region,
measurements at 5.9 GPa are necessary.
III.2.2 Zero-field SR measurements under pressure
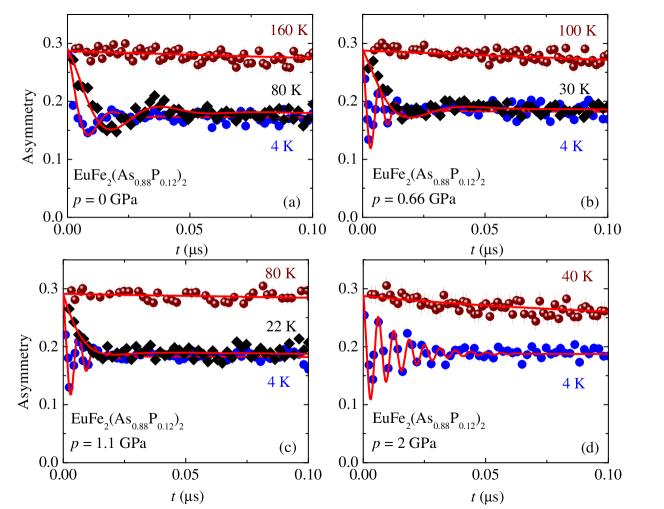
Hydrostatic pressure effects on the magnetic properties of EuFe2(As0.88P0.12)2 were studied microscopically by means of ZF SR. Some representative SR time spectra at different applied pressures are shown in Fig. 7. A substantial fraction of the SR asymmetry signal originates from muons stopping in the MP35N pressure cell Andreica surrounding the sample. Therefore, the total SR asymmetry is a sum of two components:
| (4) |
(t) is the contribution of the sample, and (t) is the contribution of the pressure cell. (t) is well described by Eq. (2) with = 2/3 and = 1/3 (since for = 0.12 the SR spectra contain only one frequency, = 0 and = 0). The signal of the pressure cell was analyzed by a damped Kubo-Toyabe (KT) function:Andreica
| (5) |
Here (0) is the amplitude of (t) at t = 0. The width of the static Gaussian field distribution = 0.338 and the damping rate = 0.04 were obtained from a measurement of the empty pressure cell. The total initial asymmetry is (0)+(0) = 0.29. The ratio (0)/[(0)+(0)] 40 implies that approximately 40 of the muons are stopping in the sample.
| (0) | (0) | ||||||
|---|---|---|---|---|---|---|---|
| (GPa) | (K) | (K) | (K) | (K) | (T) | (T) | |
| 0 | 16.5(5) | 16.4(3) | - | 141.2(1) | 0.44(1) | 0.25(1) | |
| 0.4 | 17.5(4) | - | 11.2(3) | - | - | - | |
| 0.42 | 17.6(5) | - | 20.3(3) | - | - | - | |
| 0.44 | - | 17.7(3) | - | 110(1) | 0.99(2) | 0.19(2) | |
| 0.48 | 17.9(4) | - | 7.3(3) | - | - | - | |
| 0.66 | 18.9(5) | 18.4(6) | 0 | 75(2) | 1.07(5) | 0.17(4) | |
| 1.1 | 20.5(5) | 19.9(7) | 0 | 40(3) | 1.27(3) | 0.12(2) | |
| 1.73 | 24.6(3) | - | 0 | - | - | - | |
| 1.97 | 24.4(5) | 23.6(7) | 0 | 0 | 1.23(2) | 0 | |
| 2.5 | 27.2(3) | - | 0 | - | - | - | |
| 3.85 | 35.8(5) | - | 0 | - | - | - | |
| 4.54 | 42.5(4) | - | 0 | - | - | - | |
| 5.1 | 49.5(3) | - | 0 | - | - | - | |
| 5.6 | 57(4) | - | 0 | - | - | - | |
| 5.9 | 53(5) | - | 0 | - | - | - |
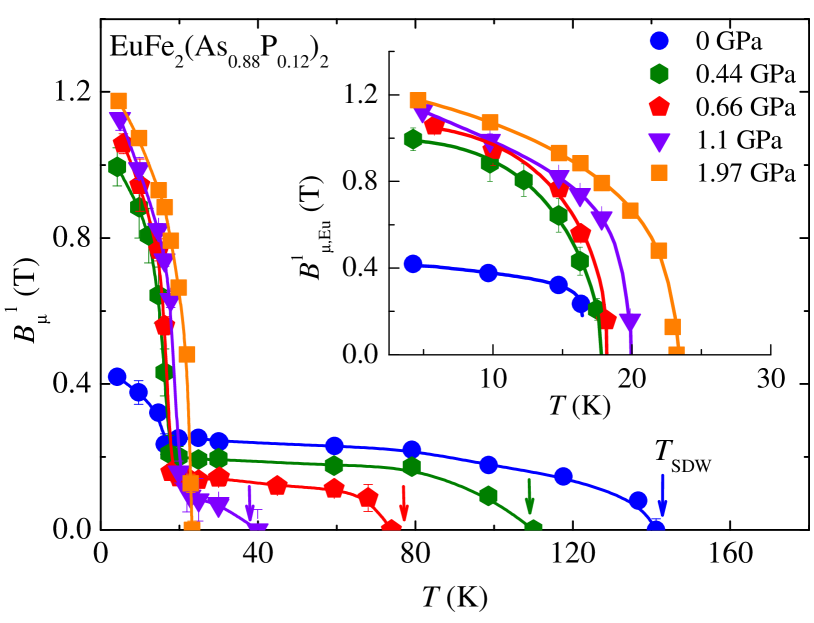
Up to = 1.1 GPa the spontaneous muon-spin precession in the Eu ordered and in the SDW state is clearly observed in the ZF SR time spectra (see Fig. 7), indicating long range magnetic order in the Eu and the Fe sublattice. Above = 1.1 GPa the SDW state is suppressed and only the magnetic order of the Eu moments remains. The temperature dependence of the internal field for various hydrostatic pressures is shown in Fig. 8. The inset shows at low temperatures where the magnetic ordering of the Eu2+ moments is evident. The data were analyzed by Eq. (3). The SDW ordering temperature of the Fe moments ( = 140 K at ambient pressure) as well as created by the Fe sublattice decrease with increasing pressure. Above = 1.1 GPa the SDW order is completely suppressed. On the contrary, increases with pressure, in agreement with the susceptibility measurements. In addition, related to the Eu ordered state also increases with pressure. Note the sharp increase of below with increasing the pressure from = 0 GPa to = 0.44 GPa. For 0.44 GPa a more smooth increase of is observed. Relevant parameters of EuFe2(As0.88P0.12)2 extracted from the high pressure magnetization and SR experiments are listed in Table II.
As shown above the magnetization measurements indicate the presence of a possible SC phase in the pressure range 0.36 GPa 0.5 GPa. An attempt to detect it in the sample EuFe2(As0.88P0.12)2 with ZF and TF SR, failed because of the strong intrinsic magnetism present in the sample.
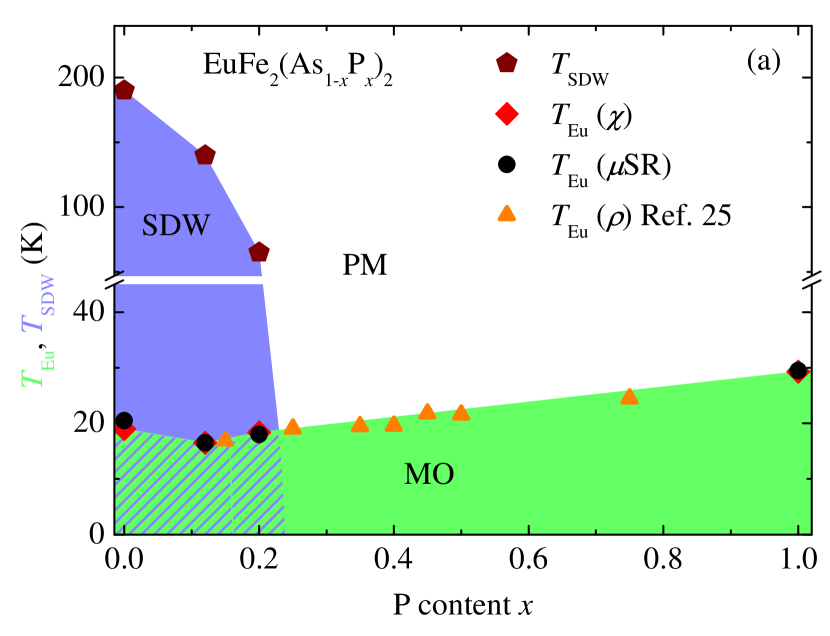
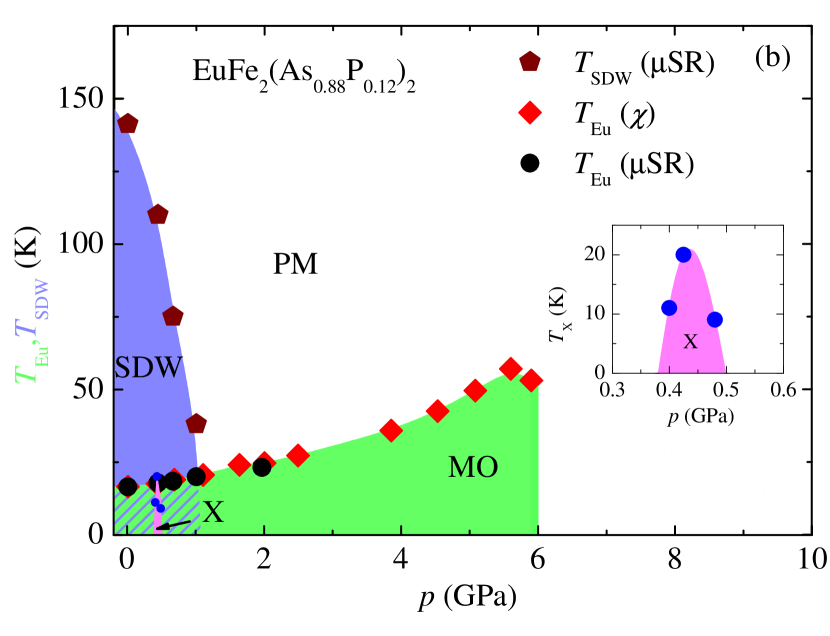
IV Phase diagram
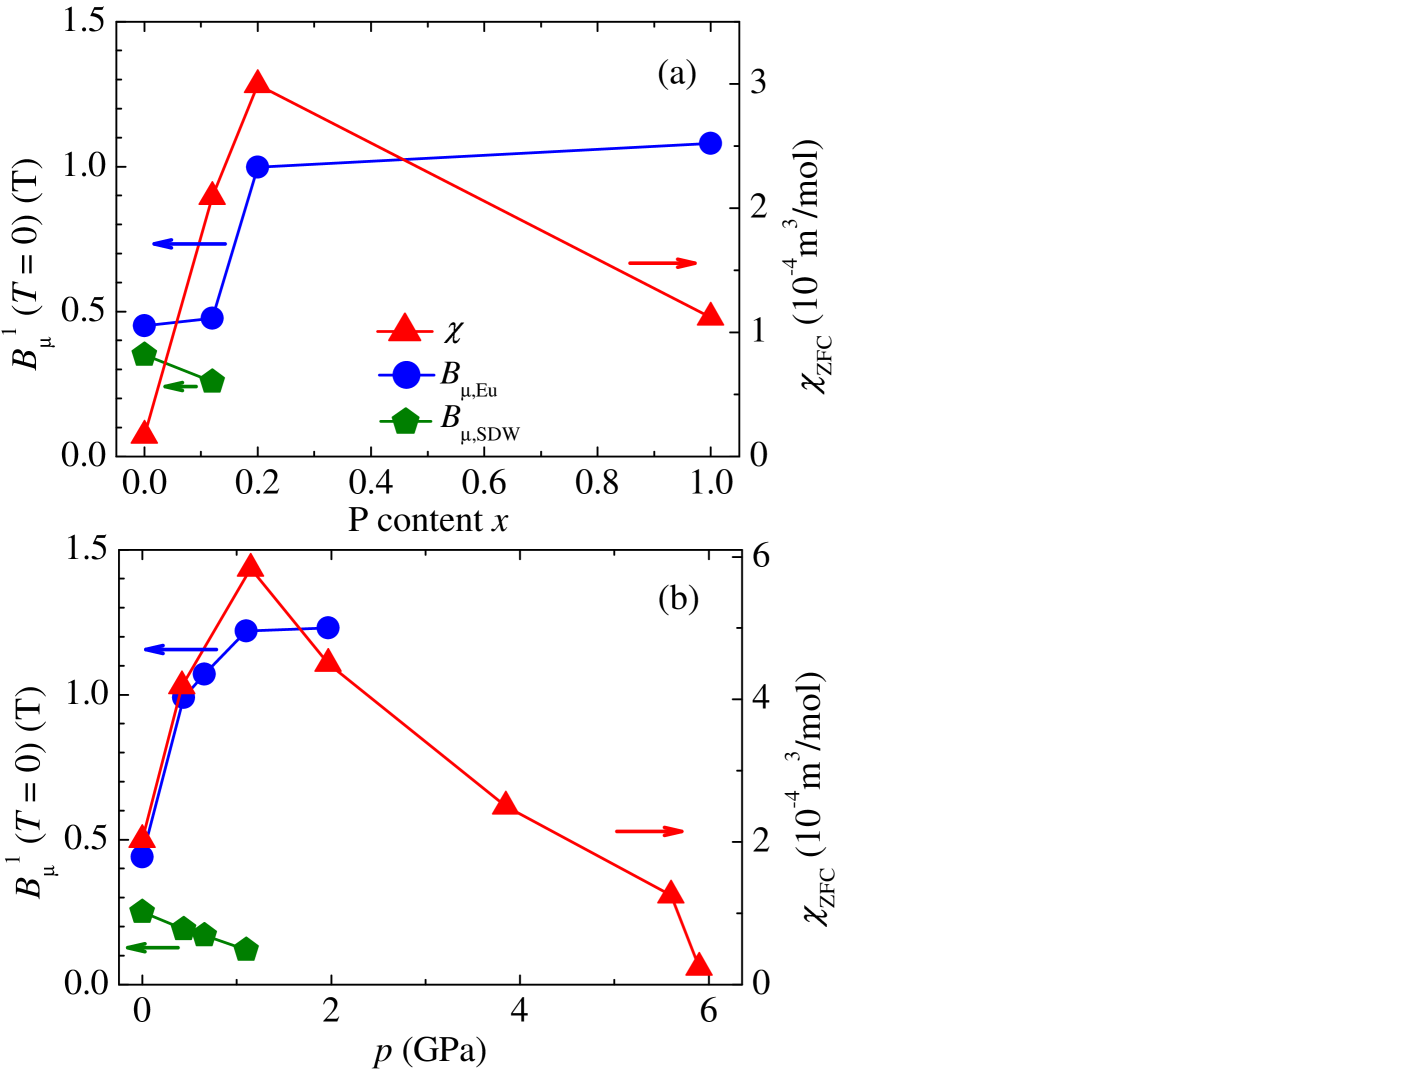
Fig. 9a shows the (-) phase diagram for the system EuFe2(As1-xPx)2. The (-) phase diagram of EuFe2(As0.88P0.12)2 is plotted in Fig. 9b. The data for represented by the triangles in Fig. 9a are taken from Ref. 25. In the (-) phase diagram three different phases were identified: a paramagnetic phase (PM), spin-density wave order of the Fe moments (SDW), and magnetic order of Eu2+ moments (MO). Moreover, in the (-) phase diagram, pressure-induced ”X” phase was found (see inset of Fig. 9b). In Fig. 10 the internal magnetic fields and probed by the muons in the Eu ordered and in the SDW state and the low temperature value of the magnetic susceptibility (7 K) are plotted as a function of P content and applied pressure .
By combining the above phase diagrams one obtains a coherent physical picture on the system EuFe2As2 upon P substitution and on EuFe2(As0.88P0.12)2 under hydrostatic pressure. An important finding is the observation of pressure-induced superconductivity in EuFe2(As0.88P0.12)2, coexisting with magnetic order of the Eu and Fe moments. Superconductivity appears in the narrow pressure region of 0.36-0.5 GPa. The presented phase diagrams in combination with the results obtained for the parent compound under pressure Terashima ; Matsubayashi allow us to draw the following conclusion on the relation between chemical and hydrostatic pressure in EuFe2As2:
1) Both chemical and hydrostatic pressure suppress and (0). However, the SDW ground state is differently affected by and . At all applied pressures below = 1.1 GPa long-range SDW order was observed, while in the case of chemical pressure for = 0.2 a disordered SDW phase exist. This may be related to the fact that by chemical pressure (P substitution) considerably more disorder is introduced.
2) Fig. 9 shows that in the case of P substitution first decreases as a function of , reaches a minimum at = 0.12, and then increases. For a fixed P content of = 0.12 the ordering temperature increases with pressures up to = 5.6 GPa. Above = 5.6 GPa, however, () decreases, acompanied by a possible valence change of the Eu moments. In the parent compound EuFe2As2 a valence change was found at a higher pressure = 8 GPa.
3) The internal magnetic field (0) in the Eu ordered state increases with increasing as well as by applying hydrostatic pressure (see Fig. 10a and b).
4) The low temperature value of the magnetic susceptibility (7 K) first increases with increasing and and above some critical values ( = 0.2 and = 1.1 GPa) it decreases (see Figs. 10a and b).
By considering the findings listed above the qualitative statement can be made that the properties of EuFe2(As1-xPx)2 are similarly tuned by chemical and hydrostatic pressure.
V CONCLUSIONS
In summary, the magnetic and superconducting properties of the system EuFe2(As1-xPx)2 ( = 0, 0.12, 0.2, 1) were studied by magnetization and SR experiments. In addition, the sample with = 0.12 was also investigated by applying hydostatic pressure up to 5.9 GPa. The (-) phase diagram of EuFe2(As1-xPx)2 and the (-) phase diagram of EuFe2(As0.88P0.12)2 were determined and discussed as well as compared to the (-) phase diagram recently obtained for EuFe2As2.Terashima ; Matsubayashi The present investigations reveal that the magnetic coupling between the Eu and the Fe sublattices strongly depends on chemical and hydrostatic pressure and determines the (-) and (-) phase diagrams as presented in this work. According to the above discussed phase diagrams chemical and hydrostatic pressures have qualitatively a similar effect on the Fe and Eu magnetic order.
There are still some open questions related to superconductivity and its interplay with the magnetic ground state of the system EuFe2As2. One of the most interesting aspects of this particular member of Fe-based superconductors is the possibility to observe coexistence or competition between superconductivity and rare-earth Eu magnetic order. In the present work the so called ”X” phase induced by pressure was observed in EuFe2(As0.88P0.12)2 in addition to the magnetic phases of the Eu and Fe sublattices. It exists in a narrow pressure range 0.36-0.5 GPa. This phase is possibly superconducting. However, transport measurements as a function of pressure are required in order to clarify this point.
VI Acknowledgments
This work was supported by the Swiss National Science Foundation, the SCOPES grant No. IZ73Z0128242, and the NCCR Project MaNEP. The SR experiments were performed at the Swiss Muon Source of the Paul Scherrer Institute (PSI), Villigen, Switzerland.
References
- (1) Y. Kamihara, T. Watanabe, M. Hirano, and H. Hosono, J. Am. Chem. Soc. 130, 3296 (2008).
- (2) M. Rotter, M. Tegel, and D. Johrendt, Phys. Rev. Lett. 101, 107006 (2008).
- (3) X.H. Chen, T. Wu, G. Wu, R.H. Liu, H. Chen, and D.F. Fang, Nature (London) 453, 761 (2008).
- (4) M.S. Torikachvili, S.L. Bud’ko, N. Ni, and P.C. Canfield, Phys. Rev. Lett. 101, 057006 (2008).
- (5) H. Fukazawa, N. Takeshita, T. Yamazaki, K. Kondo, K. Hirayama, Y. Kohori, K. Miyazawa, H. Kito, H. Eisaki, and A. Iyo, J. Phys. Soc. Jpn. 77, 105004 (2008).
- (6) T. Terashima, M. Kimata, H. Satsukawa, A. Harada, K. Hazama, S. Uji, H.S. Suzuki, T. Matsumoto, and K. Murata, J. Phys. Soc. Jpn. 78, 083701 (2009).
- (7) Z.A. Ren, W. Lu, J. Yang, W. Yi, X.L. Shen, Z.C. Li, G.C. Che, X.L. Dong, L.L. Sun, F. Zhou, and Z.X. Zhao, Chin. Phys. Lett. 25, 2215 (2008).
- (8) S. Matsuishi, Y. Inoue, T. Nomura, M. Hirano, and H. Hosono, J. Phys. Soc. Jpn. 77, 113709 (2008).
- (9) J. Zhao, Q. Huang, C. de la Cruz, S. Li, J.W. Lynn, Y. Chen, M.A. Green, G.F. Chen, G. Li, Z. Li, J.L. Luo, N.L. Wang, and P. Dai, Nature Materials 7, 953 (2008).
- (10) H. Raffius, M. Mörsen, B.D. Mosel, W. Müller-Warmuth, W. Jeitschko, L. Terbüchte, and T. Vomhof, J. Phys. Chem. Solids 54, 135 (1993).
- (11) Y. Xiao, Y. Su, M. Meven, R. Mittal, C.M.N. Kumar, T. Chatterji, S. Price, J. Persson, N. Kumar, S.K. Dhar, A. Thamizhavel, and Th. Brueckel, Phys. Rev. B 80, 174424 (2009).
- (12) S. Jiang, Y.K. Luo, Z. Ren, Z.W. Zhu, C. Wang, X.F. Xu, Q. Tao, G.H. Cao, and Z.A. Xu, New J. Phys. 11, 025007 (2009).
- (13) Z. Guguchia, J. Roos, A. Shengelaya, S. Katrych, Z. Bukowski, S. Weyeneth, F. Murányi, S. Strässle, A. Maisuradze, J. Karpinski, and H. Keller, Phys. Rev. B 83, 144516 (2011).
- (14) A.S. Sefat, R. Jin, M.A. McGuire, B.C. Sales, D.J. Singh, and D. Mandrus, Phys. Rev. Lett. 101, 117004 (2008).
- (15) A. Leithe-Jasper, W. Schnelle, C. Geibel, and H. Rosner, Phys. Rev. Lett. 101, 207004 (2008).
- (16) Y. He, T. Wu, G. Wu, Q.J. Zheng, Y.Z. Liu, H. Chen, J.J. Ying, R.H. Liu, X.F. Wang, Y.L. Xie, Y.J. Yan, J.K. Dong, S.Y. Li, and X.H. Chen, J. Phys.: Condens. Matter 22, 235701 (2010).
- (17) L.J. Li, Y.K. Luo, Q.B. Wang, H. Chen, Z. Ren, Q. Tao, Y.K. Li, X. Lin, M. He, Z.W. Zhu, G.H. Cao, and Z.A. Xu, New J. Phys. 11, 025008 (2008).
- (18) Zhi Ren, Xiao Lin, Qian Tao, Shuai Jiang, Zengwei Zhu, Cao Wang, Guanghan Cao, and Zhuan Xu, Phys. Rev. B 79, 094426 (2009).
- (19) H.S. Jeevan, Deepa Kasinathan, Helge Rosner, and Philipp Gegenwart, Phys. Rev. B 83, 054511 (2011).
- (20) K. Matsubayashi, K. Munakata, M. Isobe, N. Katayama, K. Ohgushi, Y. Ueda, Y. Uwatoko, N. Kawamura, M. Mizumaki, N. Ishimatsu, M. Hedo, and I. Umehara, Phys. Rev. B 84, 024502 (2011).
- (21) Z. Guguchia, S. Bosma, S. Weyeneth, A. Shengelaya, R. Puzniak, Z. Bukowski, J. Karpinski, and H. Keller, Phys. Rev. B 84, 144506 (2011).
- (22) J. Rodr gues-Carvajal, Physica B 192, 55 (1993).
- (23) D. Andreica, Ph.D. thesis, IPP/ETH-Zürich, (2001).
- (24) http://lmu.web.psi.ch/facilities/software/musrfit/technica l/index.html.
- (25) Guanghan Cao, Shenggao Xu, Zhi Ren, Shuai Jiang, Chunmu Feng, and Zhu an Xu, J. Phys.: Condens. Matter 23, 464204(5pp) (2011).
- (26) S. Zapf, D. Wu, L . Bogani, H.S. Jeevan, P. Gegenwart, and M. Dressel, Phys. Rev. B 84, 140503(R) (2011).
- (27) D.H. Ryan, J.M. Cadogan, Shenggao Xu, Zhu’an Xu, and Guanghan Cao, Phys. Rev. B 83, 132403 (2011).
- (28) H. Maeter, H. Luetkens, Yu.G. Pashkevich, A. Kwadrin, R. Khasanov, A. Amato, A.A. Gusev, K.V. Lamonova, D.A. Chervinskii, R. Klingeler, C. Hess, G. Behr, B. Büchner, and H.-H. Klauss, Phys. Rev. B 80, 094524 (2009).
- (29) A. Jesche, N. Caroca-Canales, H. Rosner, H. Borrmann, A. Ormeci, D. Kasinathan, H.H. Klauss, H. Luetkens, R. Khasanov, A. Amato, A. Hoser, K. Kaneko, C. Krellner, and C. Geibel, Phys. Rev. B 78, 180504(R) (2008).
- (30) W. Uhoya, G. Tsoi, Y. K. Vohra, M. A. McGuire, A.S. Sefat, B. C. Sales, D. Mandrus, and S. T. Weir, J. Phys.: Condens. Matter 22 , 292202 (2010).
- (31) B. Ni, M.M. Abd-Elmeguid, H. Micklitz, J.P. Sanchez, P. Vulliet, and D. Johrendt, Phys. Rev. B 63, 100102 (2001).