Scientometrics
Tel.: +1 (215) 895-5912
Fax: +1 (215) 895-2494
22email: wk@drexel.edu
A Fitness Model for Scholarly Impact Analysis
Abstract
We propose a model to analyze citation growth and influences of fitness (competitiveness) factors in an evolving citation network. Applying the proposed method to modeling citations to papers and scholars in the InfoVis 2004 data, a benchmark collection about a 31-year history of information visualization, leads to findings consistent with citation distributions in general and observations of the domain in particular. Fitness variables based on prior impacts and the time factor have significant influences on citation outcomes. We find considerably large effect sizes from the fitness modeling, which suggest inevitable bias in citation analysis due to these factors. While raw citation scores offer little insight into the growth of InfoVis, normalization of the scores by influences of time and prior fitness offers a reasonable depiction of the field’s development. The analysis demonstrates the proposed model’s ability to produce results consistent with observed data and to support meaningful comparison of citation scores over time.
keywords:
Citation analysis Normalized citation scores Preferential attachment Fitness Citation network Scholarly impact Information visualizationIntroduction
Citation frequency is a basic indicator of the use and usefulness of scientific publications (Pritchard, 1969). Citation analysis has been commonly used to evaluate scholarly productivity and impact (Garfield, 1972; Cronin and Overfelt, 1994). However, due to human subjectivity in citation behaviors and a wide spectrum of factors involved in a scholar’s decision to include a reference, citation frequency is not an unambiguous quantity for objective evaluation of scholarly communications (Nicolaisen, 2007; Zyczkowski, 2009). According to Garfield (1972), citation scores are associated with many variables beyond scientific merit.
It has been recognized that citation growth is a process of cumulative advantage, in which “success seems to breed success” (Price, 1976, p. 292). Early players are likely to dominate in gaining citations given the advantage of entry time. In terms of Barabasi and Albert (1999), complex systems such as a citation network demonstrate scale-free properties as a result of network growth with preferential attachment. Specifically, when a node enters a scale-free network, it is more likely to connect to (cite) those that have been more strongly connected (highly cited). The scale-free model nicely explains distributions of connectivity that decay with a power law function, commonly observed in real world networks such as the world wide web and citation networks (Redner, 1998; Amaral et al, 2000b; Barabási, 2009; Matjaz and Perc, 2010).
Despite its model simplicity and effectiveness in regenerating related distributions, the preferential attachment mechanism in the scale-free model only represents partial reality. While many real-world connectivity distributions show a long tail, they are rarely perfect power-laws that are free of scales. Due to constraints such as aging and limited capacities to receive new connections, certain categories of these networks demonstrate single-scale or broad-scale characteristics (Amaral et al, 2000a). Broad-scale structures such as co-authorship networks demonstrate a power-law region followed by an exponential or Gaussian cutoff because of individual capacities to collaborate.
In addition, preferential attachment alone does not sufficiently depict the reality given the common observation that competitive latecomers do have chances to break the loop and play important roles in growing network communities. In written communications, an article with great scientific metric may attract lots of citations even if it is published lately (Redner, 1998). This recognition of competitiveness, in addition to the time factor in preferential attachment, has triggered research on new models in network science.
According to Bianconi and Barabási (2001), a node’s growth in connectivity in a network depends on its fitness to compete for links. Fitter nodes have the ability to overcome highly connected nodes that are less fit. In the fitness model, entry time as well as factors associated with a node’s competitiveness (fitness) account for its ultimate connectivity. A fitness network demonstrates not only the rich-get-richer effect (dominance of early players) but also the fitter-get-richer phenomenon (opportunities for latecomers to surpass the established).
The ideas of network growth, preferential attachment, and fitness have important implications in citation analysis. We have acknowledged that raw citation count is not a fair vehicle for scholarly impact evaluation. Particularly, time is a factor that likely hinders meaningful comparison of papers published in different years. While one may suggest the use of yearly averages to normalize citation scores for a comparative evaluation, research has clearly indicated that citation growth is not a linear function of time (Robert G. Sumner, 1995; Gupta, 1997; Barabasi and Albert, 1999; Bianconi and Barabási, 2001; Zhu et al, 2003). How to isolate the influence of time in citation analysis requires close examination of this relationship.
Furthermore, we reason that fitness is a very broad notion and, in the context of citation analysis, potentially represents a variety of constituent variables. To understand quantitatively the process of papers111We use papers, articles and publications interchangeably. In the data used for this study, a paper may refer to a research article, a book chapter, or a book. competing for citations requires a mathematical model in which the notion of fitness is integrated and can be factorized into related variables in citation data.
In the light of preferential attachment and fitness, this research aims to build a simple, general model to quantify citations and analyze scholarly impacts in evolving citation networks. The model will integrate time as well as related fitness factors in the modeling and offers a means to single out contributions (bias) on citation scores for comparative analysis. We will conduct a case study to validate the proposed model and to demonstrate its utility in the evaluation.
Proposed Model
We present a fitness model to analyze citation distributions over time. The purpose of this modeling is to quantitatively offer insight into citation characteristics and evolving patterns in various domains. While its applicability can be verified with real data, the model will incorporate important variables and take into account their relations in contributing to scholarly impact. By quantifying individual factors’ contributions, we can estimate key parameters in the model and obtain important quantitative descriptors about the development of a domain in question.
We describe the proposed model by introducing three key aspects in the analysis. It is apparent that the number of citations a paper has received reflects several factors in the following respects: 1) quality, merit, and contribution of research presented in the paper; 2) attractiveness of the paper due to existing influences of its authors and publication venue; and 3) age of the paper which allows for the accumulation of citations over time. We model citation-based scholarly impact using these (abstract) factors and elaborate on model formulation below.
Citations over Time
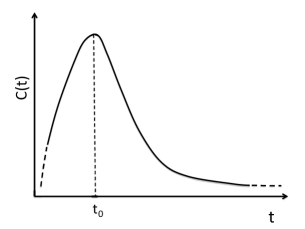
Research has identified some common patterns about how citations accumulate over time. According to Gupta (1997), a citation decay curve consists of two parts: an increase of citations during first couple of years followed by gradual decline of citations when the paper gets older, as shown in Figure 1 (a). The cumulative trend is illustrated in Figure 1 (b). Similar patterns have been found in related studies such as Robert G. Sumner (1995); Zhu et al (2003).
|
|
|---|---|
| (a) Citations | (b) Cumulative citations |
Viewing papers as nodes and citations as directed arcs connecting the nodes, network science research has provided important methods and tools to model citation frequency based on connectivity probabilities in an evolving citation network. The scale-free model, among others, provides insights into the basic mechanisms behind power-law degree distributions commonly observed in a wide spectrum of real networks. It models the outcome of such a distribution based on two simultaneous processes, namely network growth and preferential attachment. The original scale-free model proposed by Barabasi and Albert (1999) relies on a probability function linear to existing connectivity. That is, the likelihood that a new node connects to an existing node (paper ) is proportional to node ’s degree (the number of citations paper has already received). The increase of the node’s degree over time can be computed by the probability of a new node connecting to the node :
| (1) |
where is the initial degree of each node upon its introduction at time and is the total number of nodes in the network at time . Solving the above equation leads to:
| (2) |
with . Let denote the time factor, the above can be written as:
| (3) |
Given , the function roughly approximate the schematic trend of cumulative citations over time, as illustrated in Figure 1 (b). While there are other citation aging functions such as those proposed by Burrell (2002) and Zhu et al (2003), the scale-free model is very generalizable and has produced results consistent with many real world networks in power-law frequency distributions. For this reason, we adopt the functional form of in the proposed model, where is to be estimated. Although this is not necessarily the most precise method to model citation growth, it does capture the decaying pattern of citations over time, as shown in Figure 1 (b).
Fitness Modeling
So far, the model in Equation 3 is solely based on the time factor , similar to the original scale free model. Incorporation of factors related to individual nodes’ competitiveness has led to new formulations such as the fitness model, in which younger nodes with a higher fitness parameter can overcome the dominance of early players (Bianconi and Barabási, 2001). We reason that a paper’s fitness, in the citation analysis context, is associated with scholarly establishment and scientific merit of that written communication. This represents a dimension independent of time and its impact on citations manifests over time. Similar to parameter in Equation 3, the fitness factor potentiates a node’s ability to attract citations and can be measured at the moment of its introduction. Different from , however, fitness represents individual competitiveness and varies from one node to another. By introducing fitness factor of node to Equation 3, we obtain the following fitness model for citation analysis:
| (4) |
where represents a collection of factors associated with a node’s competitiveness in the citation network and can be further factorized by these variables. While Barabasi and Albert (1999) obtained in the scale-free model, we leave this to empirical validation in the data.
Suppose a number of factors contribute to a paper’s fitness. Assume factors, , can be measured in the data while others are unknown and denoted as . Examples of variables include evidence about existing influences of a paper’s authors, e.g., how frequently the authors have been cited prior to the paper’s publication. These factors in a sense represent the introductory degree of a node, similar in spirit to parameter in Equation 3.
Seen in the light of a power-law degree distribution, there is a huge divide in connectivity between highly cited nodes and those that are rarely connected to. To integrate these degree-related factors in requires normalizing their values (citation scores) from magnitudes’ differences to a reasonable scale. Log transformation appears to be a reasonable step in the modeling. We propose:
| (5) |
where and represent weights of the contributing factors.
Equation 5 is equivalent to:
| (6) |
| (7) | |||||
where is the time factor and denotes factors about a paper’s fitness in terms of existing influences. The coefficients , , and can be estimated from data. Let and . The above model is equivalent to the following equation after logarithmic transformation, for which generalized linear regression can be performed to estimate the coefficients.
| (8) |
Model Implications
Based on the model presented in Equation 7, or equivalently Equation 8, we can quantify proportionally various factors’ contributions to a paper’s scholarly impact (citations). We have taken into account three categories of variables, namely the time factor, variables about established influences prior to a paper’s publication which are potentially measurable, and other unknown variables contributing to a paper’s fitness summarized as .
By singling out the individual variables and estimating related coefficients from data, the model supports evaluation of scholarly impact at multiple levels. For example, isolating the impact of time factor will enable examination of a paper’s fitness and fair comparison of papers regardless of their ages. In addition, suppose in the data analysis we can include in exhaustive variables about established influences prior to a paper’s publication (e.g., authors’ prior impacts), then the variable is a surrogate of remaining factors about a paper’s actual fitness. In this case, quantifying will offer insight into a paper’s own ability to attract citations because of its scientific merit and contribution to the field, rather than due to other prior, external factors.
Finally, we observe that the proposed model has the potential for causality analysis or prediction of citation scores. In Equation 7, there is a time sequence from right (independent variables) to left (dependent variable). Besides the factor, all variables are about factors prior to or upon the publication of a paper. They can be measured at the time of publication. A citation score can then be seen as the result of these factors over the course of time . Because of this time sequence, it is plausible – though not in definitive terms – to tell a causal relationship between predictor variables and ultimate citation scores.
Model Validation and Data Analysis
We apply the proposed fitness model to a collection of 31 years’ citation records in information visualization (InfoVis) to validate the model and to analyze evolving patterns about the domain. In this section we describe the data, related variables used in the fitness model for paper citations, and a derived model for scholars in the analysis. We discuss results and insights from the analysis in the next section.
Data
The InfoVis data set is a collection of major publications in the emerging information visualization field during 1974 - 2004 retrieved from the ACM Digital Libraries. It was prepared by the IEEE Information Visualization Contest in 2004 to depict the early history of the field and made available as part of the InfoVis Benchmark Repository (Ke et al, 2004; Plaisant et al, 2004).
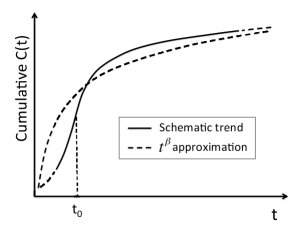
According to Fekete et al (2004), the data set contains meta data of important publications on information visualization collected from multiple venues and is representative of the early development (emergence) of the field. The original data is in the XML (Extensible Markup Language) format, which we convert to a relational database. Figure 2 shows the database schema with major tables and relationships.
Each citation record has information such as a paper’s title, authors, abstract, keywords, source, references, number of pages, and the year of publication. One paper (acm673478) has no author and is removed from the data. We perform author name unification through automatic name normalization and manual correction. The final data set contains 613 papers with 1,036 unique authors/scholars and 8,502 references to papers within and without the set.
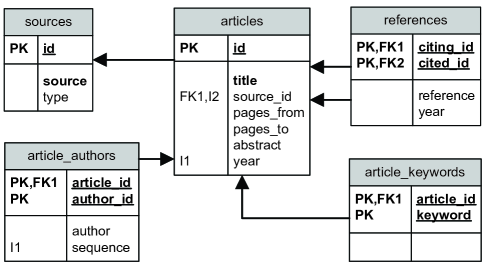
Yearly distributions of the number of publications, the number of references, and the number of citations are shown in Figure 3. Because the focus of this study is on scholarly impact and fitness factors based on citation scores, data fields related to content such as title and abstract are not used in the modeling.
Fitness model for papers and related variables
In terms of the fitness model in Equation 7, we identify related variables from the InfoVis data for model validation and data analysis. We use generalized linear regression in the equivalent form of Equation 8 to estimate related parameters and to examine influences of identified variables. We use to denote the number of citations a paper received within the collection. Time represents the age of paper when data were collected in 2004. The InfoVis data also have evidence about existing impacts prior to a paper’s publication, denoted as variables:
-
1.
Authors’ prior impact factor refers to the number of citations authors of paper received (for earlier works) before the paper’s publication.
-
2.
Venue’s prior impact factor is the average number of citations to (earlier) papers at the venue where paper was published before its publication.
-
3.
References’ prior impact factor denotes the number of citations to works referenced by paper prior to its publication.
Note that all variables rely solely on records in the InfoVis collection. We do not seek additional citation information about the collected papers from external sources. Replication of the analysis reported in this article is straightforward. It can be conducted on many other domains where representative citation records in a given time period are available .
Derived model for scholars
The proposed model has so far focused on the fitness of nodes in citation analysis, where nodes represent papers. For an analysis from the perspective of scholars (authors), a second model can be derived from Equation 7. We treat an author’s citation score from a paper as a fair share of the authorship. Using fractional count, we distribute the credit for a multi-authored work equally among its contributors (Lindsey, 1980; Lee and Bozeman, 2005). That is, the citation score of each scholar (author) of paper is , where is citation frequency of paper and is the number of contributors (authors) of the paper.
One additional factor for modeling a scholar’s citation frequency is the number of papers he or she has authored, denoted as . This being considered, factors about authored papers’ fitness need to be normalized (averaged) so that is not redundant to existing contributions in individual papers. We propose the use of geometric mean to average contributing variables and for each author. For example, given a set of values for variable observed in papers authored by scholar , the geometric mean is computed by:
| (9) |
While arithmetic mean is the common approach to averaging citation scores, research has also adopted harmonic mean and geometric mean in citation analysis (Glanzel and Schubert, 1993; Sikorav, 1991). Advantages of geometric mean include reduced standard variance and model simplicity when variables are log-transformable. Using geometric means and additional variable , the fitness model for scholar according to Equation 7 can be written as:
| (10) | |||||
| (11) | |||||
| (12) |
Here turns out to be part of the fitness model for paper in Equation 7. By using geometric means, the two models for papers and scholars are tightly associated. This derived fitness model for scholars, shown in Equation 12, can be seen as aggregation of normalized individual papers’ contributions toward author citations.
Results
We present model validation and analysis results from modeling the InfoVis data. We focus on the fitness model for papers and discuss results from the derived model for scholars (authors) as well. We also present results from additional analyses of frequency distributions and multi-authorship impacts.
Model validation
Fitness model for papers
Based on the fitness model for papers in Equation 7, generalized linear regression of the InfoVis data produces estimates of coefficients in Table 1. As results indicate, all estimates are statistically significant in the InfoVis data, where prior fitness and time variables contribute positively to paper citation frequencies.
| Coefficient | Estimate | Std Error | t value | () | |
| 4.3E-11 | *** | ||||
| : author impact | 5.5E-50 | *** | |||
| : venue impact | 0.026 | * | |||
| : refernece impact | 0.0035 | ** | |||
| : time factor | 1.1E-29 | *** | |||
| (adj. ), on and DF | |||||
The fitness model for papers based on estimates in Table 1 can be expressed as Equation 13, where the growth of citations over time follows the function , close to scale-free model derivation (Barabasi and Albert, 1999). While prior impact factors all contribute to a paper’s overall ability to attract citations, authors’ prior impact factor appears to have a greater impact .
| (13) | |||||
The fitness model for papers explains nearly of citation score variances in the InfoVis data ( and adjusted ). Given only four factors included in the model, this is relatively high. For example, Peters and van Raan (1994) studied fourteen determinants of citation scores in the discipline of chemical engineering and their model explained of the variance. Ohter models, with an aim to boost prediction accuracy, involved a wide spectrum of content and bibliometric factors (Fu and Aliferis, 2010).
The proposed model only takes into account external variables such as prior fitness factors and time. Without analysis of inherent characteristics such as paper content and scientific merit, the nearly coefficient of determination is considerably large. This supports the assertion that citation growth is indeed a cumulative advantage process, in which success extensively breeds success (Price, 1976).
Fitness model for scholars
Modeling scholar fitness in the InfoVis data based on Equation 12 produces estimates in Table 2. Authors’ prior impact factor (geometric mean), time factor (geometric mean), and the number of papers all have significant impacts on the citation outcome. While venues’ prior impacts and references’ prior impacts do not show significant influences on citation outcomes in the data, we reason they contribute positively to citations and their non-significant is likely due to their association with other factors such as prior author impact .
| Coefficient | Estimate | Std Error | t value | ||
| 1.3E-17 | *** | ||||
| : author impact | 1.6E-41 | *** | |||
| : venue impact | 0.31 | ||||
| : reference impact | 0.06 | . | |||
| : time factor | 4E-36 | *** | |||
| : authored papers | 4.5E-132 | *** | |||
| (adj. ), on and DF | |||||
Given estimates in Table 2, the fitness model for scholars can be expressed as Equation 14. Citation growth over time follows the rough functional form of , to which the scale-free model remains a fine approximation (Barabasi and Albert, 1999). Apparently, the number of papers a scholar authored has great influences on the citation outcome. The relation between scholar citation frequency and is , close to a linear function.
| (14) | |||||
Again, the analysis indicates significant impacts of preferential attachment in citation growth as a cumulative advantage process (Price, 1976; Barabasi and Albert, 1999). The large from modeling InfoVis scholars suggests that there is an extensive rich-get-richer and fitter-get-richer effect. Scholarly productivity and impact evaluation based on raw citation scores is not necessarily fair given existing advantage of early players and bias caused by scholarly establishment. Isolating the influences of time and prior fitness factors may lead to new insight into the evaluation, which we will discuss later.
Validation of citation frequency distributions
Connectivity distribution analysis has been an important tool in network science research. A major goal of various complex network models has been to reproduce important patterns/characteristics in these distributions. Here we use the two models discussed above to generate citations distributions for papers as well as for scholars. Figures 4 (a) and (b) show cumulative frequency distributions for the two models respectively and compare their predicted results to observed distributions in the data.

|

|
|---|---|
| (a) papers | (b) scholars |
In general, distributions generated by the proposed fitness models manifest cumulative patterns similar to those observed in the data. Predicted citation frequencies appear to be conservative estimates of observed frequencies. Overall, the models produce more rarely cited nodes (top-left in both figures) and fewer highly cited ones (bottom-right in both figures). For highly-cited nodes that are predicted by the models, their citation frequencies are smaller than actual values (bottom-right in both figures). Despite these local differences, predicted (model-generated) and observed distributions look consistent.
Top papers and scholars in InfoVis
| No. | Title | Year | ||||
|---|---|---|---|---|---|---|
| 1 | Cone Trees: animated 3D… | 1991 | 70 | 33.9 | 6.4 | 300 |
| 2 | The perspective wall: detail and… | 1991 | 30 | 14.8 | 2.7 | 200 |
| 3 | Visual information seeking: tight… | 1994 | 29 | 16.4 | 3.2 | 230 |
| 4 | Information visualization using 3D… | 1993 | 28 | 15.1 | 2.5 | 142 |
| 5 | Tree-Maps a space-filling approach to | 1991 | 28 | 13.8 | 2.8 | 212 |
| 6 | The table lens: merging graphical and | 1994 | 24 | 13.7 | 2.7 | 151 |
| 7 | Pad++: a zooming graphical interface… | 1994 | 23 | 13.1 | 4.5 | 202 |
| 8 | Pad: an alternative approach to the… | 1993 | 22 | 12.0 | 6.7 | 151 |
| 9 | Stretching the rubber sheet: a… | 1993 | 22 | 12.0 | 3.7 | 79 |
| 10 | Dynamic queries for information… | 1992 | 19 | 9.9 | 2.1 | 127 |
| 11 | A review and taxonomy of distortion-or | 1994 | 19 | 10.9 | 3.8 | 120 |
| 12 | Tree visualization with tree-maps: 2-d | 1992 | 18 | 9.5 | 2.3 | 215 |
| 13 | Graphical Fisheye Views | 1993 | 16 | 8.9 | 2.6 | 122 |
| 14 | Toolglass and magic lenses: the see-th | 1993 | 15 | 8.3 | 3.3 | 346 |
| 15 | Parallel coordinates a tool for… | 1990 | 15 | 7.3 | 2.8 | 145 |
| 16 | The movable filter as a user… | 1994 | 13 | 7.7 | 2.5 | 72 |
| 17 | Worlds within worlds: metaphors for… | 1990 | 13 | 6.4 | 2.7 | 54 |
| 18 | The dynamic HomeFinder: evaluating… | 1992 | 12 | 6.5 | 1.5 | 75 |
| 19 | Interactive graphic design using… | 1994 | 12 | 7.1 | 2.0 | 49 |
| 20 | To see, or not to see- is That the… | 1991 | 10 | 5.2 | 3.0 | 24 |
| Correlation with : | 0.586 | 0.593 | 0.394 | |||
With treatments on time and fitness factors, the proposed model has the potential to single out these variables and to identify an individual node’s ability for long-term growth. The InfoVis data were prepared in 2004 to document the birth and early history of the field. Now that many years have past, there is new evidence about how well nodes (papers and scholars) have grown in citations. We use the total number of citations identified for each paper or scholar in the ACM digital libraries in 2012, denoted as , as a surrogate of its long-term impact.
We sort papers by their overall citation scores within the InfoVis 2004 data and select the top for Table 3. We reason that removing the time factor from citation scores, among others, supports a fairer comparison of papers published in various years. This leads to weighted citation scores based on time normalization and further reduction of fitness factors in (see additional and columns in Table 3). While and are in general consistent with the outcome, appears to have a slightly higher correlation with whereas , with removal of both time and prior fitness factors, has a weaker correlation.
| No. | Scholar name (mean pub year) | ||||
|---|---|---|---|---|---|
| 1 | B. Shneiderman (1995) | 94 | 82.5 | 31.7 | 5389 |
| 2 | J. D. Mackinlay (1995) | 87 | 77.2 | 28.2 | 1736 |
| 3 | S. K. Card (1995) | 82 | 70.3 | 24.3 | 3547 |
| 4 | G. W. Furnas (1994) | 81 | 69.2 | 25.7 | 1595 |
| 5 | G. Robertson (1994) | 60 | 50.9 | 17.3 | 2177 |
| 6 | E. R. Tufte (1988) | 58 | 40.3 | 18.7 | 884 |
| 7 | C. Ahlberg (1994) | 33 | 27.8 | 10.6 | 535 |
| 8 | R. Rao (1995) | 30 | 27.5 | 11.1 | 271 |
| 9 | W. S. Cleveland (1988) | 27 | 19.7 | 9.6 | 311 |
| 10 | T. Munzner (1997) | 22 | 21.9 | 11.8 | 318 |
| 11 | B. Bederson (1998) | 22 | 23.2 | 10.4 | 2094 |
| 12 | S. K. Feiner (1992) | 20 | 16.8 | 9.4 | 2656 |
| 13 | P. Pirolli (1996) | 18 | 17.6 | 6.8 | 1396 |
| 14 | S. G. Eick (1997) | 18 | 17.5 | 8.6 | 736 |
| 15 | B. Johnson (1991) | 16 | 13.1 | 5.5 | 241 |
| 16 | S. F. Roth (1995) | 16 | 15.0 | 7.4 | 471 |
| 17 | J. D. Hollan (1995) | 14 | 13.6 | 6.6 | 967 |
| 18 | M. H. Brown (1993) | 14 | 12.1 | 6.1 | 622 |
| 19 | M. Chalmers (1997) | 13 | 13.7 | 8.4 | 594 |
| 20 | J. Lamping (1994) | 13 | 12.0 | 4.9 | 649 |
| Correlation with : | 0.685 | 0.710 | 0.707 | ||
Based on the fitness model for scholars, we perform a similar analysis of these variables, namely: 1) the raw citations of a scholar in the data , 2) time normalized citations , 3) time and prior fitness normalized citations , and 4) citations in ACM DL by 2012. As shown in Table 4, both and have stronger correlations with the long-term citation growth than raw citation score does. Note that the normalized score represents unknown fitness factors in the analysis and may be further factorized in future studies. No significance test has been performed on this specific analysis given the small samples.
Paper fitness over time
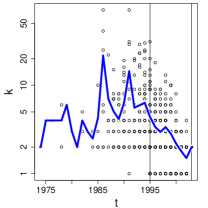
The InfoVis data are about the birth and growth of the scientific field of information visualization. Citation records in the data, though not a exhaustive collection about the field, are generally considered representative of its development. Plotting raw citation scores of papers in the data over time, however, shows a counter-intuitive picture. In Figure 5 (a), average citation score peaks in late 1980s - early 1990s and decreases continuously afterwards. While we understand that this trend is mainly due to the lack of citation data for recent publications, tracking raw citation scores for analyzing the development of a field does not offer much insight. Note that there is only one paper published in 2004 in the collection, which has no citations and is not included in the plots.
|
|
|
|---|---|---|
| (a) citations | (b) normalized by | (c) normalized by & |
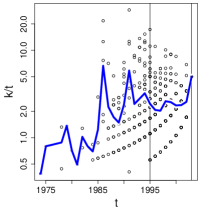
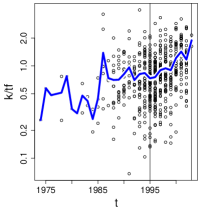
Plots of the normalized scores and over time, as shown in Figure 5 (b) and (c) respectively, tell a different story. Time normalized also has peaks in late 1980s but moves roughly constantly over time after early 1990s. With normalized by time and prior fitness factors, there appears to be an overall incremental development over the years, especially during 1995 - 2003. According to Fekete et al (2004), 1995 marked an important milestone of the field when the first IEEE Symposium on Information Visualization was held. The InfoVis data in this analysis include 9 years’ proceedings of the conference from 1995 - 2003. It is quite certain that the field experienced healthy growth during this period and the plot in Figure 5 (c) is relatively consistent with this observation.
Summary of model validation and analysis
The modeling and validation rely on generalized linear regression analyses, citation frequency distributions, comparison with long-term citation evidence, and examination of (normalized) citation frequencies over time. We have found the proposed fitness model to be a useful tool for scholarly impact evaluation, which offers insight consistent with observations about citation growth in general and the InfoVis field in particular. Models produce significant results with the InfoVis data and regenerate citation distribution patterns similar to those in the data. The fitness models, involving time and prior fitness factors, explain a significant portion of citation variances ( in the model for papers and for scholars). Isolation of these factors offers good estimation about nodes’ (papers’ and scholars’) ability to gain citations in the long term. Normalization of citation scores by time and prior fitness factors also leads to a more reasonable depiction of InfoVis development in its recent history.
Additional data analysis
Paper fitness distributions
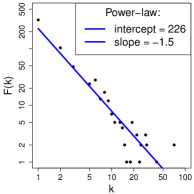
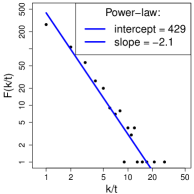
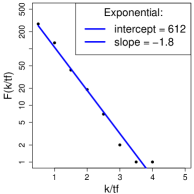
In Figure 4, we looked at cumulative distributions of raw citation scores. Figure 6 (a) shows the discrete, non-cumulative distribution of paper citation frequencies, which follows a rough power-law function linear on the log-log plot. Figure 6 (b) plots time normalized whereas (c) shows the distribution of with both time and prior fitness normalization.
|
|
|
|---|---|---|
| (a) citations | (b) normalized by | (c) normalized by & |
While the distribution remains roughly linear on log-log (see Figure 6 (b)), the distribution resembles an exponential form (see Figure 6 (c)). The normalization, with the removal of contributions from time and variables related to prior fitness, is essentially an unknown factor about a paper’s additional ability to gain citations. It is likely a representative of constituent variables such as a paper’s quality, scientific merit, and potential contribution to the field. In this sense, can be seen as a measure about a paper’s inherent fitness whereas prior fitness and time are external factors. The exponential distribution suggests a single- or broad-scale nature of . That is there are certain constraints on how related inherent factors may vary, leading to a scale limit (Amaral et al, 2000a). Identification of additional variables in data and further factorization of may lead to discovery of important characteristics of this distribution and better understanding of its implications on citation analysis.
Impact of multi-authorship
The average number of authors per paper over time, as shown in Figure 7, is generally increasing over 31 years in the InfoVis data. Earlier analysis of the field has shown that collaboration was a key factor in the development of InfoVis given its multidisciplinary nature (Börner et al, 2005). Analyzing multi-authorship contributions will help understand collaboration trends and impacts.
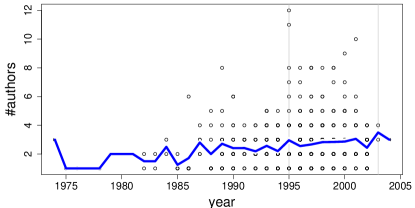
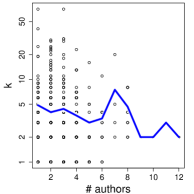
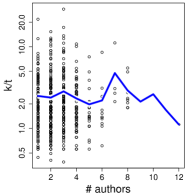
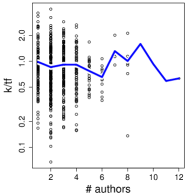
Figure 8 plots paper citation score over the number of authors. It is interesting that several papers with seven authors have high citation scores (see the peaks in Figures 8 a, b, and c). We argue that these are peculiar to the data and may not be generalizable. If we ignore these seven-author papers as exceptions (outliers), there is a general decreasing trend of average citation scores with an increased number of co-authors.
|
|
|
|---|---|---|
| (a) citations | (b) normalized by | (c) normalized by & |
With normalized citation scores and , shown in Figure 8 (b) and (c), the impact of co-author team size becomes ambiguous. While it is difficult to reach any conclusion about large collaboration teams given the lack of data, many high-impact papers were results of one to three co-authors (see individual data points at the top of Figure 8 plots). Previous studies have offered evidence about productive collaboration in small teams in InfoVis (Ke et al, 2004; Börner et al, 2005). For example, strong collaboration of three key researchers J.D. Mackinlay, S.K. Card, and G. Robertson, among top scholars listed in Table 4, produced several milestone works on information visualization and has been highly regarded in the field.
Conclusion
We propose a model to analyze citation growth and influences of fitness variables. Taking into account time factor and prior fitness factors , the model offers not only a new formula to predict growing citations but also an approach to quantifying influences of these factors (bias) in scholarly impact analysis.
Applying the proposed method to modeling paper and scholar citations in the InfoVis 2004 data, a benchmark collection documenting the birth and 31 years’ history of information visualization, leads to findings consistent with citation growth in general and our observation about the domain in particular. While and variables have been found to have significant influences on paper citation scores, the overall effect size is considerably large, with for the paper fitness model and for the derived scholar fitness model. Citation growth over time follows a power function close to that identified in the scale-free model, in which citation score with (Barabasi and Albert, 1999).
Distribution analysis and normalization of citation frequencies based on model estimates provide insights consistent with observations about the domain. Both paper and scholar fitness models reproduce citation frequency distributions that roughly match observed distributions. Isolating the impact of time from raw citation scores produces normalized scores better correlated with a long-term citation benchmark. While plotting raw citation scores over 30 years of InfoVis seems to suggest a counter-intuitive story about the field, normalizing the scores by influences of time and prior fitness reveals a trend consistent with our general understanding of the field.
Overall, the analysis demonstrates the ability of the proposed model to produce results consistent with the data and to support meaningful comparison of citation scores. The model is based on the general reasoning behind preferential attachment and fitness in evolving, growing networks. The simplicity of the proposed fitness modeling, which relies on nothing more than citation records, enables straightforward replication of the reported analysis. We plan to apply the model to analyzing other scientific domains in future studies.
References
- Amaral et al (2000a) Amaral LAN, Scala A, Barthélémy M, Stanley HE (2000a) Classes of small-world networks. Proceedings of the National Academy of Sciences of the United States of America 97(21):11,149–11,152, URL http://www.pnas.org/content/97/21/11149.abstract, http://www.pnas.org/content/97/21/11149.full.pdf+html
- Amaral et al (2000b) Amaral LAN, Scala A, Barthelemydagger M, Stanley HE (2000b) Classes of small-world networks. Proceedings of the National Academy of Science 97:11,149–11,152
- Barabási (2009) Barabási AL (2009) Scale-free networks: A decade and beyond. Science 325:412–413, URL http://www.sciencemag.org/cgi/content/full/325/5939/412
- Barabasi and Albert (1999) Barabasi AL, Albert R (1999) Emergence of scaling in random networks. Science 286:509–512
- Bianconi and Barabási (2001) Bianconi G, Barabási AL (2001) Competition and multiscaling in evolving networks. Europhys Lett 54:436–442
- Börner et al (2005) Börner K, Dall’Asta L, Ke W, Vespignani A (2005) Studying the emerging global brain: Analyzing and visualizing the impact of co-authorship teams. Complexity, special issue on Understanding Complex Systems 10(4):58–67
- Burrell (2002) Burrell QL (2002) Modelling citation age data: Simple graphical methods from reliability theory. Scientometrics 55(2):273–285
- Cronin and Overfelt (1994) Cronin B, Overfelt K (1994) Citation-based auditing of academic performance. Journal of the American Society for Information Science 45(2):61–72
- Fekete et al (2004) Fekete JD, Grinstein G, Plaisant C (2004) InfoVis 2004 contest: The history of InfoVis. URL http://www.cs.umd.edu/hcil/iv04contest/
- Fu and Aliferis (2010) Fu LD, Aliferis CF (2010) Using content-based and bibliometric features for machine learing models to predict citation counts in the biomedical literature. Scientometrics 85:257–270, 10.1007/s11192-010-0160-5
- Garfield (1972) Garfield E (1972) Citation analysis as a tool in journal evaluation. Science 178:471–479
- Glanzel and Schubert (1993) Glanzel W, Schubert A (1993) A characterization of scientometric distributions based on harmonic means. Scientometrics 26(1):81–96
- Gupta (1997) Gupta BM (1997) Analysis of distribution of the age of citations in theoretical population genetics. Scientometrics 40(1):139–162, 10.1007/BF02459265
- Ke et al (2004) Ke W, Börner K, Viswanath L (2004) Major information visualization authors, papers and topics in the acm library. In: INFOVIS ’04: Proceedings of the IEEE Symposium on Information Visualization (INFOVIS’04), IEEE Computer Society, Washington, DC, USA, pp 216–217, http://dx.doi.org/10.1109/INFOVIS.2004.45
- Lee and Bozeman (2005) Lee S, Bozeman B (2005) The impact of research collaboration on scientific productivity. Social Studies of Science 35(5):673–702, 10.1177/0306312705052359, URL http://sss.sagepub.com/content/35/5/673.abstract, http://sss.sagepub.com/content/35/5/673.full.pdf+html
- Lindsey (1980) Lindsey D (1980) Production and citation measures in the sociology of science: The problem of multiple authorship. Social Studies of Science 10(2):145–162
- Matjaz and Perc (2010) Matjaz, Perc (2010) Zipf s law and log-normal distributions in measures of scientific output across fields and institutions: 40 years of slovenia s research as an example. Journal of Informetrics 4(3):358 – 364, 10.1016/j.joi.2010.03.001, URL http://www.sciencedirect.com/science/article/pii/S1751157710000234
- Nicolaisen (2007) Nicolaisen J (2007) Citation analysis. Annual Review of Information Science and Technology 43:609–641
- Peters and van Raan (1994) Peters HPF, van Raan AFJ (1994) On determinants of citation scores: A case study in chemical engineering. Journal of the American Society for Information Science 45(1):39–49
- Plaisant et al (2004) Plaisant C, Fekete J, Grinstein G (2004) Promoting insight based evaluation of visualizations: From contest to benchmark repository. Tech. rep., HCIL, University of Maryland, URL http://www.cs.umd.edu/hcil/pubs/tech-reports.shtml
- Price (1976) Price DJ (1976) A general theory of bibliometric and other cumulative advantage processes. Journal of the American Society for Information Science 27(5-6):292–306
- Pritchard (1969) Pritchard A (1969) Statistical bibliography or bibliometrics? Journal of Documentation 25:348–349
- Redner (1998) Redner S (1998) How popular is your paper? an empirical study of the citation distribution. The European Physical Journal B - Condensed Matter and Complex Systems 4(2):131–134
- Robert G. Sumner (1995) Robert G Sumner J (1995) Utilizing the age of references to control the exhaustivity of the reference representation in information retrieval. Information Processing & Management 31:29–45
- Sikorav (1991) Sikorav J (1991) The utility of scientific papers. Scientometrics 21:49–68, URL http://dx.doi.org/10.1007/BF02019182, 10.1007/BF02019182
- Zhu et al (2003) Zhu H, Wang X, Zhu JY (2003) Effect of aging on network structure. Phys Rev E 68(5):056,121, 10.1103/PhysRevE.68.056121
- Zyczkowski (2009) Zyczkowski K (2009) Citation graph, weighted impact factors and performance indices. Scientometrics 85:301 –315, 10.1007/s11192-010-0208-6, URL http://arxiv.org/abs/0904.2110