New Variable Stars in the Globular Cluster NGC 658411affiliation: Based on observations obtained with the SARA Observatory 0.6 m telescope at Cerro Tololo, which is owned and operated by the Southeastern Association for Research in Astronomy (http://www.saraobservatory.org).
Abstract
Using the Southeastern Association for Research in Astronomy 0.6 meter telescope located at Cerro Tololo, we searched for variable stars in the southern globular cluster NGC 6584. We obtained images during 8 nights between 28 May and 6 July of 2011. After processing the images, we used the image subtraction package ISIS developed by Alard (2000) to search for the variable stars. We identified a total of 69 variable stars in our 1010 arcmin2 field, including 43 variables cataloged by Millis & Liller (1980) and 26 hereto unknown variables. In total, we classified 46 of the variables as type RRab, with a mean period of 0.56776 days, 15 as type RRc with a mean period of 0.30886 days, perhaps one lower amplitude type RRe, with a period of 0.26482 days, 4 eclipsing binaries, and 3 long period ( days) variable stars. As many as 15 of the RRab Lyrae stars exhibited the Blažhko Effect. Furthermore, the mean periods of the RR Lyrae types, the exhibited period/amplitude relationship, and the ratio of of 0.25 are consistent with an Oosterhoff Type I cluster. Here we present refined periods, V-band light curves, and classifications for each of the 69 variables, as well as a color-magnitude diagram of the cluster.
Journal of the Southeastern Association for Research in Astronomy, 6, 00-00, \slugcomment
and
I Introduction
Globular clusters provide an ideal controlled environment to study variable stars and hence stellar evolution since the stars in the cluster presumably formed out of the same cloud of gas and dust, have the same composition, have the same distance, and have the same age (Smith 2004). In addition to understanding the important aspects of late-stage stellar evolution in a controlled environment, variable stars in globular clusters are one of the primary standard candles that are used to measure the distances to globular clusters in the Milky Way and nearby galaxies. They also provide a method to easily observe thousands of stars at once, a useful characteristic when searching for variable stars.
NGC 6584 is a relatively understudied globular cluster located 13.5 Kpc from the Sun in the southern constellation Telescopium (Harris 1996). It is an Oosterhoff type I cluster (Oosterhoff 1939) and Sarajedini & Forrester (1995) have estimated its metallicity at [Fe/H]=-1.440.16. Early studies of this cluster were performed by Bailey (1924) who identified nine potential variable stars in its vicinity. Millis & Liller (1980) published the locations of 48 variable stars in NGC 6584. They utilized photographic plates in their observations and analyses. As a result, the light curves that they present are relatively incomplete and the periods that they provide are somewhat imprecise. Sarajedini & Forrester (1995) confirmed these 42 RR Lyrae variables and tentatively identified 56 possible yet undiscovered RR Lyraes by analyzing the variation in the frame-to-frame dispersion in V and B-V as a function of V for the stars in the instability strip of their color-magnitude diagram (CMD). Those stars which showed a large range in V dispersion were identified as possible RR Lyraes. In the same year, Samus et al. (1995), also using photographic photometry, again confirmed Millis & Liller’s 48 variables. Since the results of Sarajedini & Forrester (1995) and Samus et al. (1995) image subtraction software and better CCDs have become available.
With the combination of CCD images, an observation window spanning more than 5 weeks, and an image subtraction method developed by Alard (2000), we are able to detect and analyze hereto undiscovered variable stars and produce unprecedented high-quality light curves and periods for each variable. In this study we use Alard’s image subtraction method to search the central 1010 arcmin2 of globular cluster NGC 6485 for variable stars from observations obtained in May, June, and July of 2011. We present a preliminary color-magnitude diagram for the cluster, as well as complete light curves and periods for 43 of Millis & Liller’s variables and for 26 newly identified variables.
II Observations and Reduction
We obtained images using the Southeastern Association for Research in Astronomy (SARA) 0.6 meter telescope at Cerro Tololo Interamerican Observatory (CTIO). Observations were made on the nights of 28 May; 2, 22, 25, and 28 June; 2, 5, and 6 July 2011 using an Apogee Alta E6 camera with a 10241024 pixel Kodak KAF1001E chip, a gain of 1.5 electron per ADU count, and an RMS noise of 8.9 electrons. We used 11 binning resulting in an image scale of 0.61\arcsec/px resulting in a 1010 arcmin2 field of view. The CCD was kept at a constant temperature of -25 Celsius. The typical seeing was 1.7\arcsec and ranged from 1.2 to 2.8\arcsec. On all nights of observation, 240 second exposures were taken using a Bessel V filter. The exposure time allowed us to detect dimmer variables but caused 6 of the stars in the field many to be overexposed. Most of these overexposed stars appeared to be in the foreground of the cluster. On the nights of 2, 5, and 6 July 2011, additional exposures were taken using Bessel B, R, and I filters with exposure times of 300, 90, and 50 seconds respectively. All images were debiased, flat-fielded, dark subtracted, and cleaned of hot, cold, and bad pixels using MaximDL.
III Analysis
Image Subtraction was accomplished using the ISIS-2.2 package (Allard & Lupton 1998; Allard 2000). ISIS accounts for changes in seeing conditions by convolving a high quality reference image to the point spread functions of each individual frame and then subtracting the two images to determine any change in intensity. The package contains seven c-shell scripts and three parameter files that were used in our analysis. The different c-shell scripts are dates, interp (registration and interpolation), ref (build reference frame), subtract (subtracts images from reference), detect (stacks subtracted images), find (finds variables above a user-defined threshold), and phot (produces light curves for all detected possible variables), along with three parameter files.
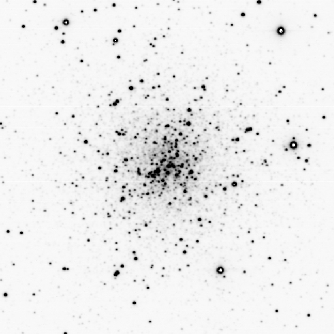
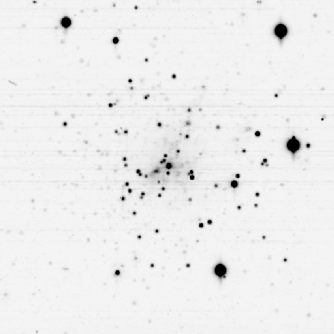
We began by running a modified version of the dates script, which identified and registered each image file in the image directory. We then ran the interp script which aligned each image to a previously chosen alignment image. Next, the ref script combined five of our highest quality images into a reference frame (Fig. 1). In order to maintain consistent and comparable values for relative flux across nights, one reference image was created using five of the best images (those with seeing between 1.2 and 1.3\arcsec). We then ran the subtract script, which first convolves the high-quality reference frame to the point-spread function of the image to be subtracted (in order to compensate for variations in seeing over the course of the observations), and then subtracts the convolved reference frame from each image. These subtracted images were then stacked using the detect script creating a var.fits image which shows the degree of variability across the observation run for each star in the cluster as shown in Fig. 2. We then used the find script to identify variable stars above a certain user-defined threshold called SIGTHRESH. We used a SIGTHRESH of 0.03 in our analysis to ensure that all possible variables were found. This value typically resulted in 1500 possible variables. Finally, the phot script was used to generate light curve data files for each identified variable. These light curves allowed us to eliminate false positives from the find script. Variable stars produce very distinct light curves, and thus false positives due to noise and variations in seeing were easily identified amongst these plots and discarded.
Periods were determined, when possible, based on combined photometric data from all eight nights. We used the period finding software AVE (Analisis de Variabilidad Estelar, Analysis of Estellar Variability) from Grup d’Estudis Astronomics. AVE uses the Lomb-Scargle algorithm (Scargle 1982) to determine the most probable period for a given set of data. Due to the more than 5 week observation span, we were able to determine the periods of most of the variables with periods less than 1 day to an accuracy of days. Those variables exhibiting the Blažhko Effect were less accurate due to modulation of their light curves.
Millis & Liller’s (1980) variables were identified visually and astrometrically and then confirmed by comparing their periods with our own. Five of the variables identified by Millis & Liller were outside the field of view of our images thus were not be observed.
IV Results
| Variable Type | Count | Period (days) |
|---|---|---|
| RRab | 46 | 0.56776 |
| RRc | 15 | 0.30886 |
| RRe | 1 | 0.26482 |
| Eclipsing | 4 | 0.32431 |
| LPV | 3 |
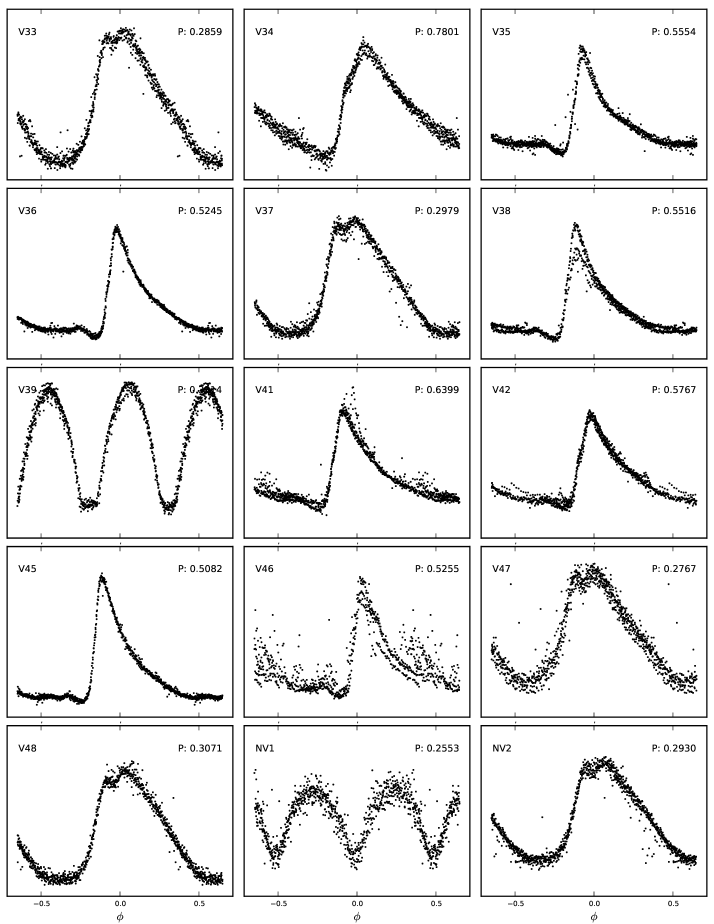
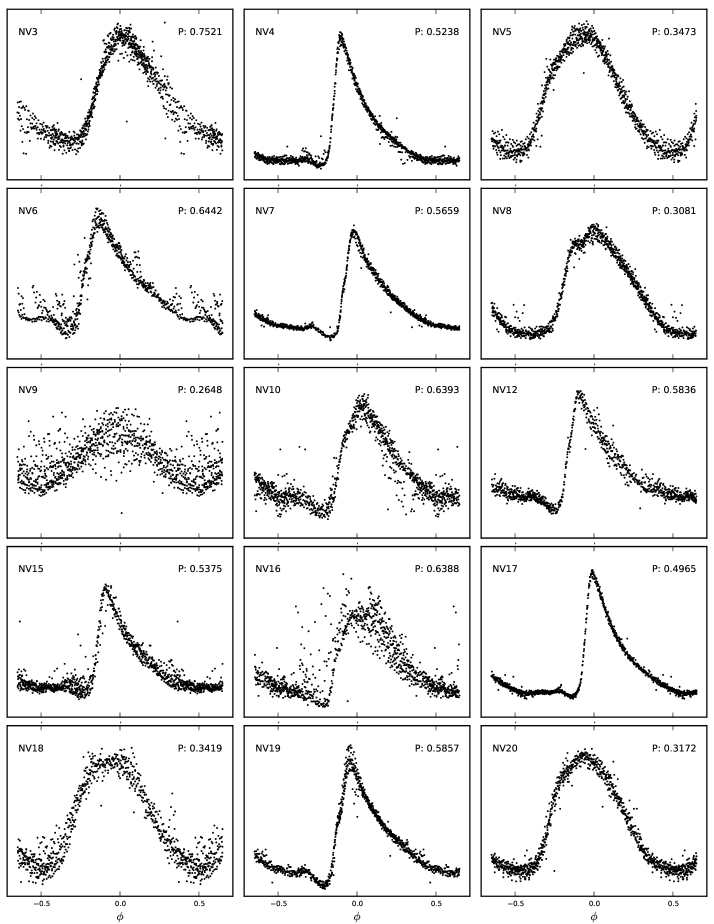
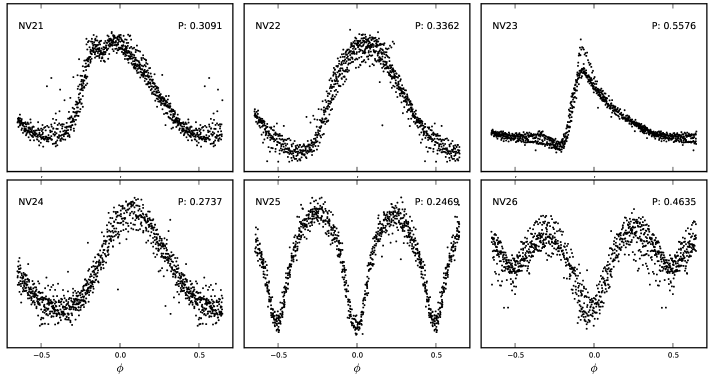
Table 1 summarizes our findings by classification. Table 2 list the positions, periods, and classification of all of the variables that we identified. In Table 2 variables previously identified by Millis & Liller (1980) are labled with a V and the number they assigned in the first column. Newly discovered variables are labeled as NV and are in order of increasing right ascension. We detected all the Millis & Liller (1980) variables that were within our 1010 arcmin2 field. Their variables 24, 27, 40, 43, and 44 were outside our field of view. We did note that variable 45 was misidentified on the finder chart in Millis & Liller (1980), thus the position we list for of this variable has been shifted by several arc-seconds in Table 2. We found periods for variables V12, V19, and 39 that Millis & Liller were unable to determine. We also were able to eliminate those periods where multiple possible periods were listed; specifically V5, V20 and V35. Besides the increased accuracy of our periods the only significant change from Millis and Liller was V13 which we found to be 0.34549 days as compared to 0.39 days.
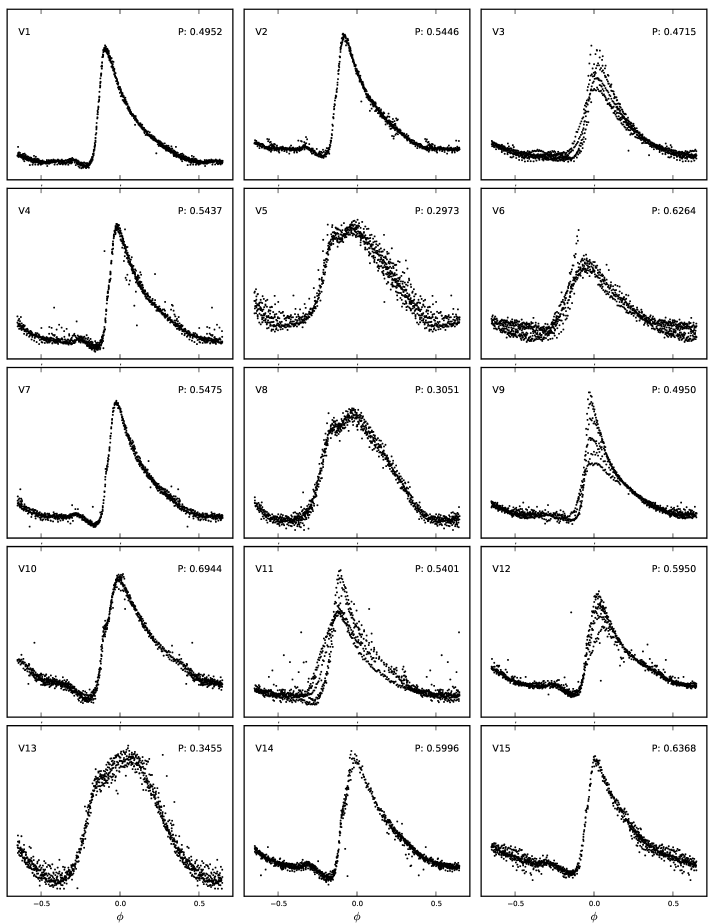
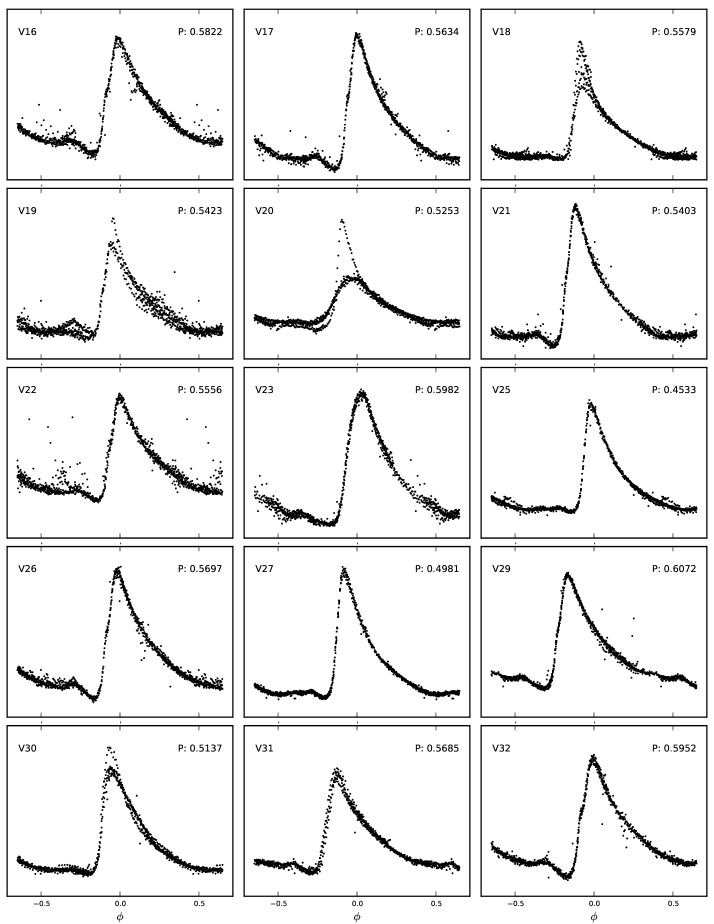
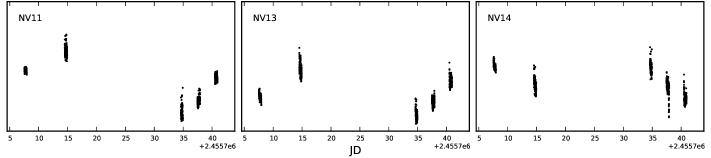
Each detected variable was classified based on the shape of its light curve, its period, and its maximum amplitude. In addition to the Miller & Liller variables we found 26 additional variables in our field, most of which are RR Lyrae variables, long period variables, or eclipsing variables. Of the total 69 variables detected, 46 were classified as RRab stars, 15 as RRc, 1 possible RRe, 4 eclipsing binaries, and 3 long period variables. From the fraction we confirm that the cluster is of Oosterhoff Type I. RRab stars are characterized by large amplitudes and periods between 0.4 and 0.8 days. RRc stars have smaller amplitudes and periods between 0.2 and 0.4. NV9 has the characteristics of a type RRe variable (Alcock et al. 1996; Bono et al. 1997). It has a lower amplitude and period than type RRc stars. Eclipsing binary stars are easily identified by their unique light curves. As many as 15 of the RRab stars appeared to exhibit the so-called Blažhko effect (Blažhko 1907; Smith 2004), which is characterized by a long term modulation in amplitude and period. These variables are noted with and asterisk in Table 2. Their periods are likely to be less accurate given their behaviour. We have not assigned periods to the long period variables at the tip of the asymptotic giant branch because further observations will be needed to establish the their periods. We assign ’LPV’ to these variables with a period greater than 2 days.
| \colheadType \startdataV1 | 18 | 18 | 28.82 | -52 | 13 | 27.0 | 0.49520 | RRab | ||||||||
| V2 | 18 | 18 | 42.20 | -52 | 12 | 30.0 | 0.54465 | RRab | ||||||||
| 11footnotemark: 1aV3 | 18 | 18 | 42.14 | -52 | 13 | 16.2 | 0.47162 | RRab | ||||||||
| V4 | 18 | 18 | 40.30 | -52 | 13 | 25.5 | 0.54377 | RRab | ||||||||
| 22footnotemark: 2bV5 | 18 | 18 | 40.49 | -52 | 13 | 29.1 | 0.29725 | RRc | ||||||||
| 33footnotemark: 3aV6 | 18 | 18 | 34.45 | -52 | 12 | 7.8 | 0.62619 | RRab | ||||||||
| V7 | 18 | 19 | 1.34 | -52 | 11 | 55.3 | 0.54748 | RRab | ||||||||
| V8 | 18 | 18 | 55.62 | -52 | 13 | 35.3 | 0.30511 | RRc | ||||||||
| 44footnotemark: 4aV9 | 18 | 18 | 43.55 | -52 | 12 | 2.7 | 0.49513 | RRab | ||||||||
| V10 | 18 | 18 | 37.07 | -52 | 11 | 36.7 | 0.69432 | RRab | ||||||||
| 55footnotemark: 5aV11 | 18 | 18 | 35.42 | -52 | 13 | 10.8 | 0.53945 | RRab | ||||||||
| 66footnotemark: 6aV12 | 18 | 18 | 35.84 | -52 | 12 | 32.6 | 0.59505 | RRab | ||||||||
| V13 | 18 | 18 | 35.85 | -52 | 14 | 32.3 | 0.34549 | RRc | ||||||||
| 77footnotemark: 7aV14 | 18 | 18 | 41.20 | -52 | 13 | 43.2 | 0.59954 | RRab | ||||||||
| V15 | 18 | 18 | 23.56 | -52 | 12 | 41.9 | 0.63632 | RRab | ||||||||
| V16 | 18 | 18 | 42.04 | -52 | 12 | 58.6 | 0.58220 | RRab | ||||||||
| V17 | 18 | 12 | 41.87 | -52 | 13 | 22.3 | 0.56338 | RRab | ||||||||
| 88footnotemark: 8aV18 | 18 | 18 | 32.99 | -52 | 13 | 18.3 | 0.55789 | RRab | ||||||||
| 99footnotemark: 9aV19 | 18 | 18 | 40.66 | -52 | 13 | 6.4 | 0.54223 | RRab | ||||||||
| 1010footnotemark: 10a,bV20 | 18 | 18 | 28.15 | -52 | 12 | 57.9 | 0.52530 | RRab | ||||||||
| V21 | 18 | 18 | 34.48 | -52 | 13 | 55.1 | 0.54025 | RRab | ||||||||
| V22 | 18 | 18 | 38.02 | -52 | 12 | 50.5 | 0.55559 | RRab | ||||||||
| V23 | 18 | 18 | 30.76 | -52 | 13 | 10.0 | 0.59812 | RRab | ||||||||
| V25 | 18 | 18 | 56.91 | -52 | 11 | 12.8 | 0.45336 | RRab | ||||||||
| V26 | 18 | 18 | 33.62 | -52 | 13 | 52.1 | 0.56970 | RRab | ||||||||
| V28 | 18 | 18 | 48.09 | -52 | 12 | 19.8 | 0.49815 | RRab | ||||||||
| V29 | 18 | 18 | 41.49 | -52 | 11 | 40.5 | 0.60720 | RRab | ||||||||
| 1111footnotemark: 11aV30 | 18 | 18 | 42.85 | -52 | 9 | 31.9 | 0.51375 | RRab | ||||||||
| V31 | 18 | 18 | 30.61 | -52 | 13 | 38.5 | 0.56831 | RRab | ||||||||
| V32 | 18 | 18 | 40.71 | -52 | 14 | 5.4 | 0.59515 | RRab | ||||||||
| V33 | 18 | 18 | 26.81 | -52 | 11 | 55.2 | 0.28595 | RRc | ||||||||
| V34 | 18 | 18 | 30.11 | -52 | 12 | 16.4 | 0.78010 | RRab | ||||||||
| 1212footnotemark: 12bV35 | 18 | 18 | 36.82 | -52 | 12 | 48.4 | 0.55550 | RRab | ||||||||
| V36 | 18 | 18 | 38.94 | -52 | 14 | 0.2 | 0.52454 | RRab | ||||||||
| V37 | 18 | 18 | 26.06 | -52 | 14 | 28.1 | 0.29786 | RRc | ||||||||
| 1313footnotemark: 13aV38 | 18 | 18 | 26.81 | -52 | 11 | 55.1 | 0.55159 | RRab | ||||||||
| V39 | 18 | 18 | 19.48 | -52 | 10 | 47.2 | 0.33141 | EB | ||||||||
| 1414footnotemark: 14aV41 | 18 | 18 | 40.70 | -52 | 13 | 4.9 | 0.63992 | RRab | ||||||||
| V42 | 18 | 18 | 39.88 | -52 | 11 | 55.3 | 0.57675 | RRab | ||||||||
| 1515footnotemark: 15cV45 | 18 | 18 | 28.75 | -52 | 12 | 30.8 | 0.50823 | RRab | ||||||||
| V46 | 18 | 18 | 25.08 | -52 | 12 | 35.3 | 0.52555 | RRab | ||||||||
| V47 | 18 | 18 | 38.32 | -52 | 13 | 20.8 | 0.27666 | RRc | ||||||||
| V48 | 18 | 18 | 38.55 | -52 | 13 | 26.1 | 0.30706 | RRc | ||||||||
| NV1 | 18 | 18 | 6.83 | -52 | 12 | 25.0 | 0.25531 | EB | ||||||||
| NV2 | 18 | 18 | 19.26 | -52 | 12 | 38.3 | 0.29297 | RRc | ||||||||
| NV3 | 18 | 18 | 27.84 | -52 | 12 | 59.4 | 0.75210 | RRab | ||||||||
| NV4 | 18 | 18 | 27.99 | -52 | 12 | 55.7 | 0.52384 | RRab | ||||||||
| NV5 | 18 | 18 | 28.19 | -52 | 14 | 7.0 | 0.34724 | RRc | ||||||||
| NV6 | 18 | 18 | 32.16 | -52 | 14 | 43.2 | 0.64406 | RRab | ||||||||
| NV7 | 18 | 18 | 32.79 | -52 | 12 | 24.7 | 0.56583 | RRab | ||||||||
| NV8 | 18 | 18 | 33.14 | -52 | 10 | 15.5 | 0.30807 | RRc | ||||||||
| NV9 | 18 | 18 | 34.47 | -52 | 12 | 49.1 | 0.26482 | RRe | ||||||||
| NV10 | 18 | 18 | 35.57 | -52 | 13 | 31.4 | 0.63930 | RRab | ||||||||
| NV11 | 18 | 18 | 35.66 | -52 | 12 | 20.6 | LPV | |||||||||
| NV12 | 18 | 18 | 35.67 | -52 | 13 | 7.1 | 0.58387 | RRab | ||||||||
| NV13 | 18 | 18 | 37.69 | -52 | 12 | 59.8 | LPV | |||||||||
| NV14 | 18 | 18 | 37.79 | -52 | 13 | 6.2 | LPV | |||||||||
| 1616footnotemark: 16aNV15 | 18 | 18 | 38.16 | -52 | 12 | 54.8 | 0.53741 | RRab | ||||||||
| NV16 | 18 | 18 | 38.42 | -52 | 12 | 56.0 | 0.63630 | RRab | ||||||||
| NV17 | 18 | 18 | 38.58 | -52 | 12 | 21.4 | 0.49644 | RRab | ||||||||
| NV18 | 18 | 18 | 38.77 | -52 | 13 | 14.1 | 0.34180 | RRc | ||||||||
| 1717footnotemark: 17aNV19 | 18 | 18 | 39.48 | -52 | 14 | 32.8 | 0.58572 | RRab | ||||||||
| NV20 | 18 | 18 | 39.93 | -52 | 11 | 21.3 | 0.31722 | RRc | ||||||||
| NV21 | 18 | 18 | 40.01 | -52 | 13 | 9.1 | 0.30911 | RRc | ||||||||
| NV22 | 18 | 18 | 40.81 | -52 | 10 | 32.5 | 0.33625 | RRc | ||||||||
| 1818footnotemark: 18aNV23 | 18 | 18 | 41.98 | -52 | 12 | 53.7 | 0.55739 | RRab | ||||||||
| NV24 | 18 | 18 | 42.72 | -52 | 12 | 28.9 | 0.27374 | RRc | ||||||||
| NV25 | 18 | 18 | 44.98 | -52 | 8 | 10.7 | 0.24689 | EB | ||||||||
| NV26 | 18 | 18 | 51.42 | -52 | 13 | 30.8 | 0.46364 | EB | ||||||||
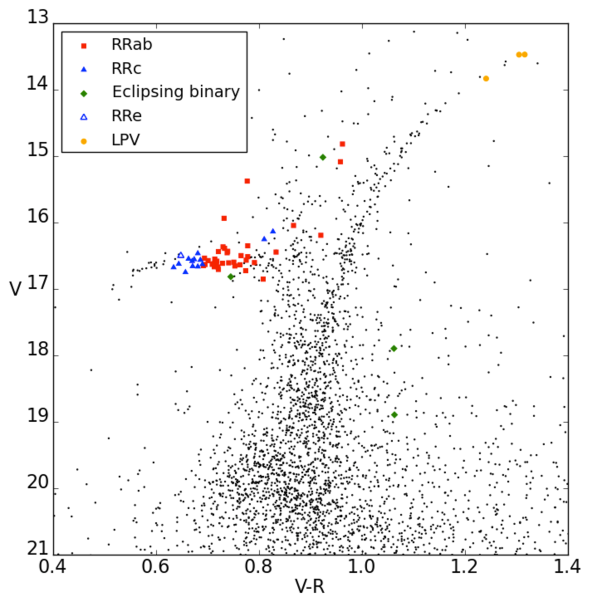
Cluster membership was determined using a color magnitude diagram (CMD). The CMD was constructed from 137 V and 155 R frames from several nights to determine magnitudes, colors, and cluster membership of the variables. DAOPHOT was used to determine V and R magnitudes of the stars (Stetson 1987). In the CMD shown in Figure 5 RRab and RRc variables are indicate by the red and blue colored points, respectively. RRc variables tend to lie on the warmer (left) side of the instability strip whereas RRab variables are to the cooler (right) of the instability strip. Scatter in the variables is partly due to blending of the variables with other stars, our averaging of several hundred images before using DAOPHOT, and possible variable reddening in the direction of the cluster.
Six of our variables, V11, V22, NV7, NV19, NV20, and NV21 were blended with other stars and show significant offset to the right of the instability strip and are likely cluster members. Four of the RRab variables V15, V41, NV4, and NV15 were significantly brighter than the RR Lyrae variables found in the instability strip of the cluster and are suspected not to be cluster members. From the CMD we are able to determine that 2 of the eclipsing variables to the right of the giant branch are not cluster members. The 3 long period variables that we found all lie near the tip of the asymptotic giant branch. The remainder of the RR Lyrae stars lie very near or in the instability strip and thus are likely cluster members.
V Conclusions
Over a 39 day time span from late May to early July of 2011 we observed the globular cluster NGC 6584 for 8 nights using the SARA 0.6 meter telescope at CTIO. Using the image subtraction software ISIS we were able to find precise periods of previously known variables and 26 newly discovered variables stars, most of which are RR Lyrae stars. Within our 1010 arcmin2 field of view we detected all the variables listed by Millis & Liller (1980) bringing the total to 74 variables in the vicinity of the cluster. Of all the RR Lyrae variables all but 4 appeared to be members of the cluster. Two of the 4 eclipsing binaries are likely to be cluster members. In total, we classified 46 of the variables as type RRab, with a mean period of 0.56776 days, 15 as type RRc with a mean period of 0.30886 days, perhaps one lower amplitude type RRe, with a period of 0.26482 days, 4 eclipsing binaries, with a mean period of 0.3243 days, and 3 long period ( days) variable stars. As many as 15 of the RRab Lyrae stars exhibited the Blažhko Effect. The ratio of of 0.25 is consistent with cluster being of type Oosterhoff Type I.
Acknowledgements.
We thank C. Alard for making ISIS 2.2 publically available. This project was funded in part by the National Science Foundation Research Experiences for Undergraduates (REU) program through grant NSF AST-1004872. Additionally A. Darragh, E. Johnson, B. Murphy were partially funded by the Butler Insitute for Research and Scholarship. The authors also thank F. Levinson for a generous gift enabling Butler University’s membership in the SARA consortium.References
- Alard & Lupton (1998) Alard, C., & Lupton, R. H. 1998, Astrophys. J. , 503, 325
- Alard (2000) Alard, C. 2000, A&AS, 144, 363
- Alcock (1996) Alcock, C., Allsman, R. A., Axelrod, T. S., et al. 1996, AJ, 111, 1146
- Bailey (1924) Bailey, S. I. 1924, Harvard College Observatory Bulletin 801, pp.7-8
- Blažko (1907) Blažko, S. 1907, Astronomische Nachrichten, 175, 325
- Bono (1997) Bono, G., Caputo, F., Cassisi, S., Incerpi, R., & Marconi, M. 1997, Astrophys. J. , 483, 811
- Harris (1996) Harris, W. E. 1996, AJ, 112, 1487
- Millis & Liller (1980) Millis, A. J. & Liller, M. H. 1980, AJ, 85, 3
- Oosterhoff (1939) Oosterhoff, P. T. 1939, The Observatory, 62, 104
- Samus et al. (1995) Samus, N. N. et al. 1995, AJ, 21,4
- Sarajedini & Forrester (1995) Sarajedini, A. & Forrester, W. L. 1995, AJ, 109, 3
- Scargle (1982) Scargle, J. D. 1982, Astrophys. J. , 263, 835
- Smith (2004) Smith, H. A. 2004, RR Lyrae Stars, by Horace A. Smith, ISBN 0521548179. Cambridge, UK: Cambridge University Press
- Stetson (1987) Stetson, P. B. 1987, PASP, 99, 191