Study of and
Abstract
The decays and have been investigated with a sample of 225.2 million events collected with the BESIII detector at the BEPCII collider. The branching fractions are determined to be and . Distributions of the angle between the proton or anti-neutron and the beam direction are well described by the form , and we find for and for . Our branching-fraction results suggest a large phase angle between the strong and electromagnetic amplitudes describing the decay.
pacs:
14.20.Dh, 14.40.Pq, 13.25.GvI Introduction
The meson is interpreted as a bound state of a charmed quark and a charmed antiquark (). The decay process ( or ) is an octet-baryon-pair decay mode, and should be a good laboratory for testing perturbative QCD (pQCD) because the three gluons in the OZI-violating strong decay correspond to the three pairs that form the final-state nucleons. The ratio of the branching fractions for the and final states provides information about the phase angle between the strong and the electromagnetic (EM) amplitudes governing the decay ref:theory01 ; Yuan:2003hj ; Wang:2003hy . Because the initial-state isospin is 0, the strong-decay amplitudes for the and final states must be equal. The and EM decays are expected to have amplitudes that are of about the same magnitude, but with opposite signs, like the magnetic moments (as discussed in Section VII). Because the EM decays of to and behave the same as non-resonant production of those final states, the magnitude of the EM decay amplitude of can be estimated from the cross section for continuum production . If the strong and EM amplitudes are almost real, and therefore in phase, as predicted by pQCD ref:theory01 ; Yuan:2003hj ; Wang:2003hy ; ref:theory3 ; ref:theory4 , then interference would lead to a branching fraction for about one-half as large as that for . Conversely, if the strong and EM amplitudes are orthogonal, then the strong decay dominates and the branching fractions are expected to be equal. In previous experiments, has been measured with good precision, while has been measured with quite a large uncertainty ref:pdg ; ref:finice . They appear to be equal within errors, at odds with the pQCD expectation.
The angular distribution for can be written as a function of the angle between the nucleon or antinucleon direction and the beam as follows:
where is an overall normalization. These angular distributions reflect details of the baryon structure and have the potential to distinguish among different theoretical models ref:theory01 ; Yuan:2003hj ; Wang:2003hy ; ref:theory3 ; ref:theory4 .
In this paper, we report new studies of the process made with the BESIII detector at the BEPCII electron-positron storage ring ref:bes3 ; ref:bes3physics . With the world’s largest sample of decays, we obtain improved measurements for the and branching fractions and angular distributions.
II BEPCII and BESIII
BEPCII is a two-ring collider designed for a peak luminosity of cm at a beam current of 0.93 A. The cylindrical core of the BESIII detector consists of a helium-gas-based drift chamber (MDC) for charged-particle tracking and particle identification by , a plastic scintillator time-of-flight system (TOF) for additional particle identification, and a 6240-crystal CsI(Tl) Electromagnetic Calorimeter (EMC) for electron identification and photon detection. These components are all enclosed in a superconducting solenoidal magnet providing a 1.0-T magnetic field. The solenoid is supported by an octagonal flux-return yoke with resistive-plate-counter muon detector modules (MU) interleaved with steel. The geometrical acceptance for charged tracks and photons is of , and the resolutions for charged-track momentum and photon energy at 1 GeV are and , respectively. More details on the features and capabilities of BESIII are provided in Ref. ref:bes3 .
III Data sample
Our data sample consists of 225.2 million events collected during 2009. The estimated uncertainty in the number of events is ref:jpsitotnumber . A GEANT4-based Agostinelli:2002hh ; Allison:2006ve detector simulation is used to produce Monte Carlo (MC) samples for signal and background processes that are generated with specialized models that have been packaged and customized for BESIII ref:bes3gen . EvtGen ref:evtgen is used to study phase-space signal events for and for exclusive backgrounds in decays. BABAYAGA ref:babayaga is used to generate Bhabha and events as possible EM backgrounds. A large inclusive sample (200 million events) is used to simulate hadronic background processes. The resonance is generated by KKMC ref:kkmc . Known decay modes are generated with EvtGen, using branching fractions set to world-average values ref:pdg . The remaining decay modes are generated by LUNDCHARM ref:bes3gen , which is based on JETSET Sjostrand:1993yb and tuned for the charm-energy region. The decays and are excluded from this sample.
IV General event selection
Charged tracks in BESIII are reconstructed from MDC hits. To optimize the momentum measurement, we select tracks in the polar angle range and require that they pass within cm of the interaction point in the beam direction and within cm in the plane perpendicular to the beam.
Electromagnetic showers are reconstructed by clustering EMC crystal energies. Efficiency and energy resolution are improved by including energy deposits in nearby TOF counters. Showers used in selecting photons and in reconstruction must satisfy fiducial and shower-quality requirements. Showers in the barrel region () must have a minimum energy of 25 MeV, while those in the endcaps () must have at least 50 MeV. Showers in the region between the barrel and endcap are poorly reconstructed and are excluded. To eliminate showers from charged particles, a photon must be separated by at least 10∘ from any charged track. EMC timing requirements suppress electronic noise and energy deposits unrelated to the event.
V Analysis of
V.1 Event Selection
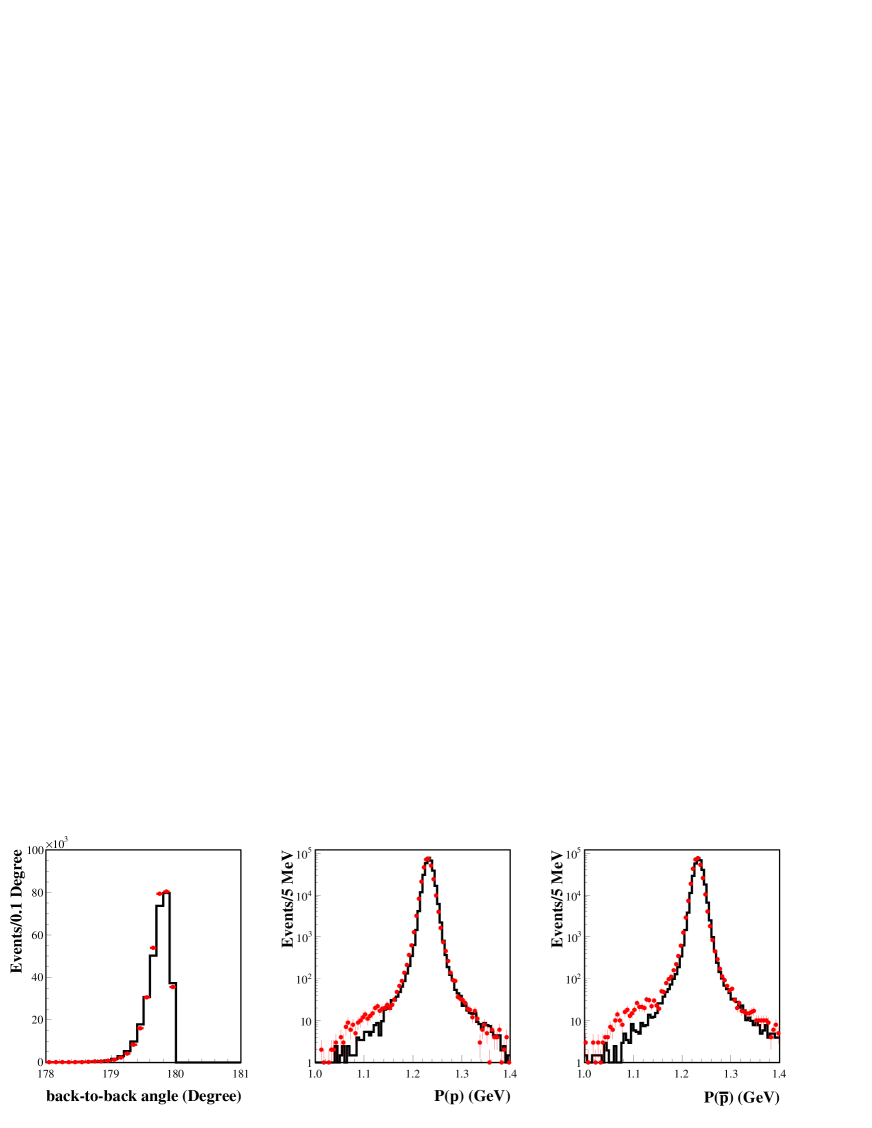
Events with exactly two good charged tracks in the polar angle range are selected. We exclude the two endcap regions to reduce systematic uncertainties in tracking and particle identification. By using a loose particle-identification requirement for the positive track (probability of the hypothesis greater than the probabilities for the and hypotheses), and by requiring no particle identification for the negative track, the efficiency is maximized and the systematic uncertainty is minimized. A vertex fit is performed to the two selected tracks to improve the momentum resolution, and the angle between the and is required to be greater than . Finally, for both tracks, the measured momentum magnitude must be within 30 MeV/ () of the expected value of 1.232 GeV/. Fig. 1 shows comparisons between data and MC for the angle between the and and for their momenta.
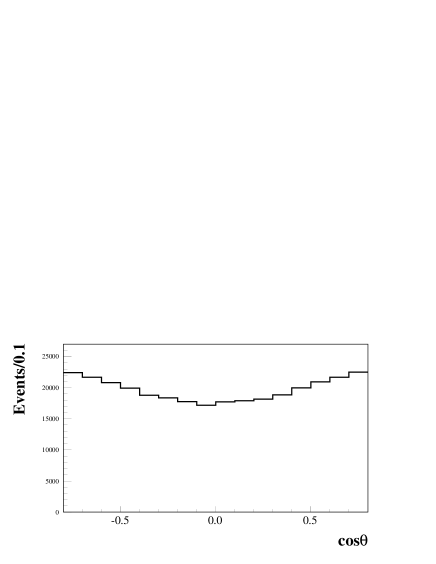
This selection results in a signal of candidate events. Fig. 1 (b) and (c) show the and momentum distributions for these events, along with the expected distributions for a pure MC signal. Backgrounds overall are very small, and appear to be negligible in the accepted and momentum range. Three independent procedures are used to estimate this background: inclusive MC, exclusive MC of potential background processes (Bhabha events and decays to , , , , , and with ), and a sideband technique. The estimates range from 0.02% to of the signal. We apply no subtraction and take the largest of the estimates (sideband) as a systematic uncertainty in the final result. The raw distribution of for the protons in the selected signal events is given in Fig. 2.
V.2 Efficiency Correction
To measure the branching fraction and angular distribution, it is necessary to correct for the selection efficiency, which is dominated by track reconstruction and selection and by particle-identification efficiency. We use signal MC to obtain the efficiency, but use data to correct for imperfections in the simulation, thereby reducing the systematic uncertainty in the correction. We measure differences between the data and MC separately for the efficiencies of tracking and particle identification, leaving the other selection cuts in place or tightening them for cleaner selection. The correlation between the corrections in the tracking and particle-identification efficiencies has been shown in MC studies to be small, so we combine them into a single correction function that is applied to the MC-determined efficiency. Because the tracking and TOF response depend on the track direction, the efficiency correction is determined in bins of .
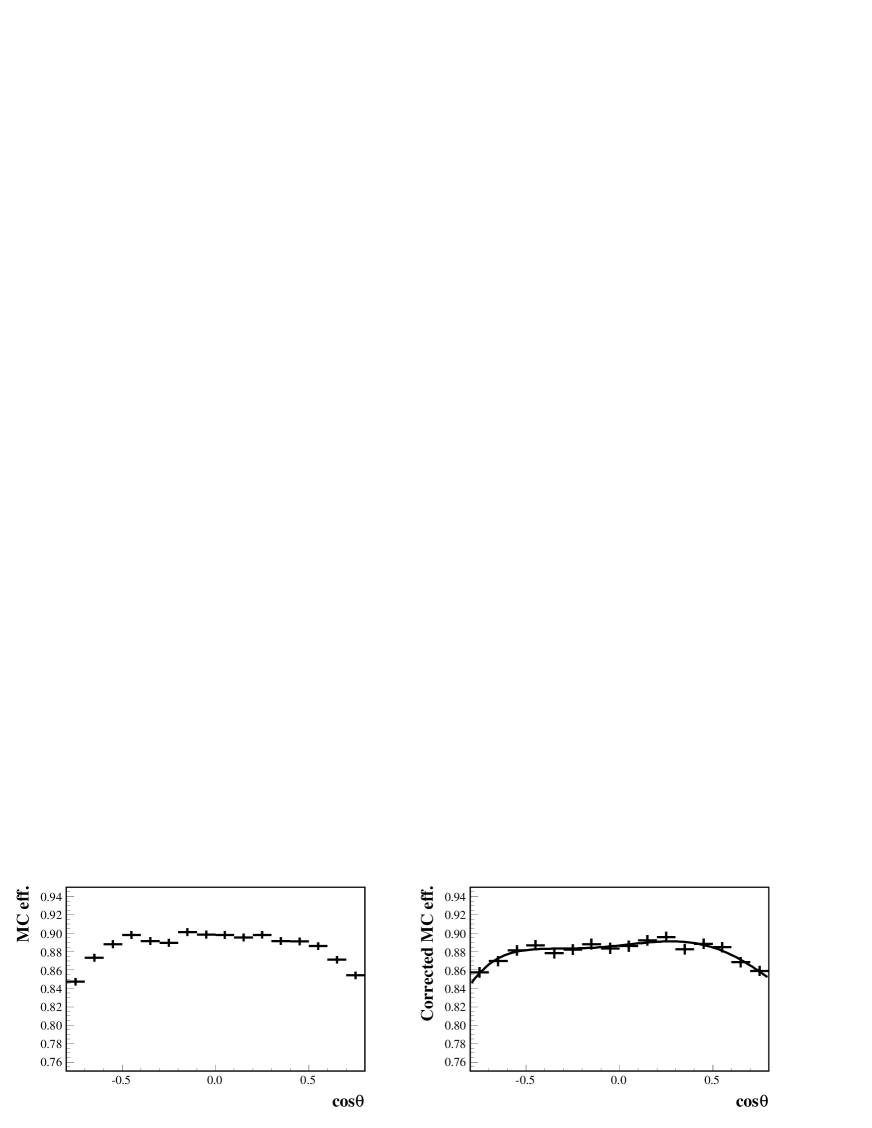
We divide the full angular range () into 16 equal bins and for each bin compute the efficiency for the successful reconstruction of the or track as follows:
where () is the number of events with 1 (2) good charged track(s) detected. For , we require only one good charged track which is identified as a or . Note that in this case, unlike the selection, we can apply particle identification to the selection to improve purity, since any inconsistency between data and MC would cancel in the efficiency. Fig. 3 shows the data/MC comparison for the tracking efficiencies and the computed correction factor for each bin for and .
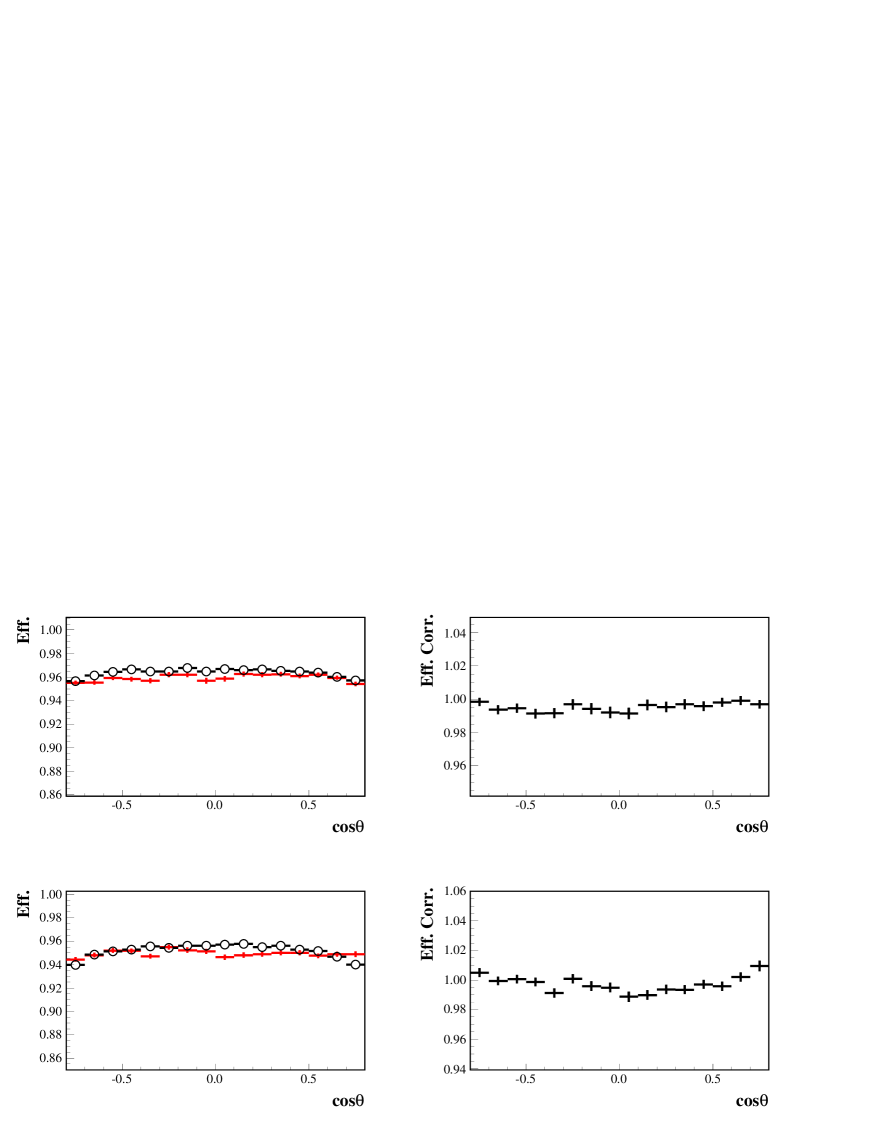
We can similarly measure the particle-identification efficiency for the in each bin, considering only events in which there are two good charged tracks, with the negatively-charged track identified as an antiproton. We define the efficiency as follows:
where is the number of selected events in which the proton has been successfully identified and is the number of events without the proton identified. To select a more pure sample we tighten the selection on the and momenta to be within 20 MeV/ () of the expected value. Figure 4 shows the data/MC comparison for the proton particle identification efficiency and the resulting correction factor .
In each bin, the corrected MC-determined efficiency to be applied to data is computed with the following formula:
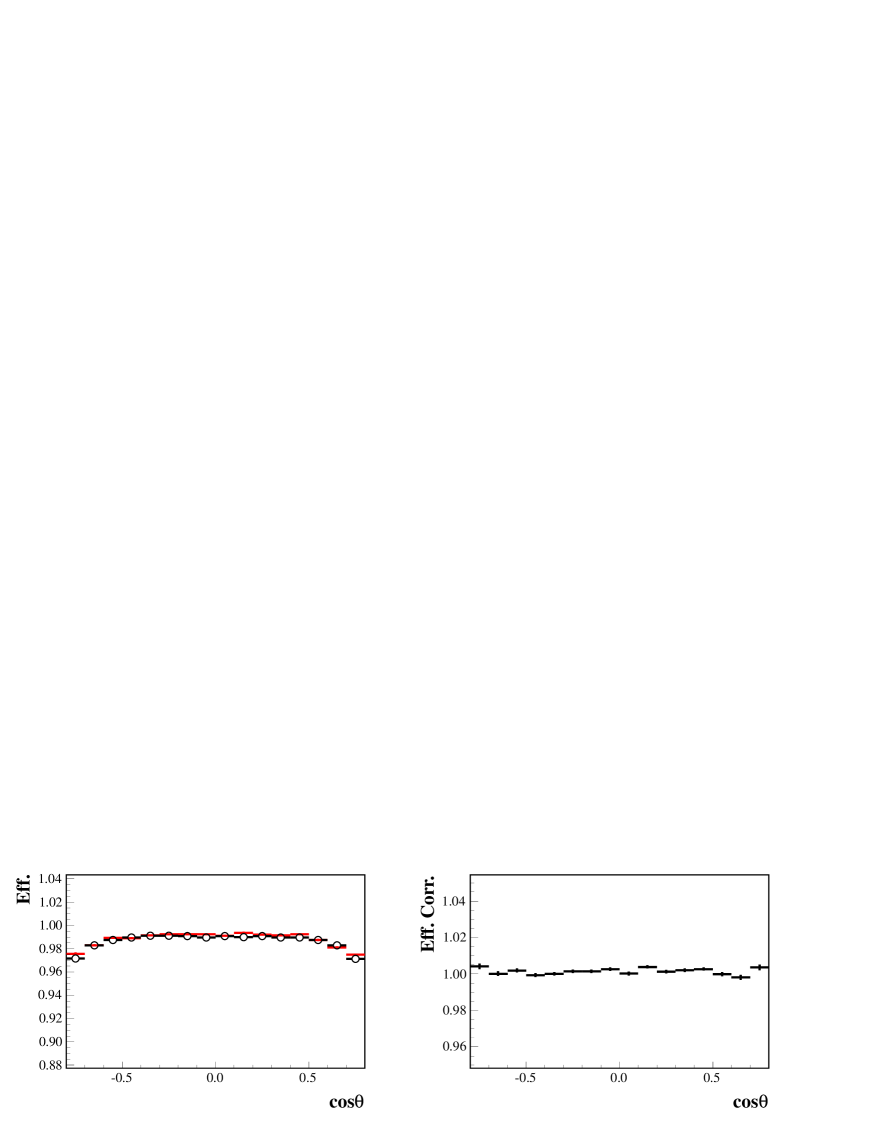
To diminish the effect of bin-to-bin scatter due to statistical fluctuations, we fit the corrected efficiency as a function of with a fifth-order polynomial, as shown in Fig. 5.
V.3 Angular Distribution and Branching Fraction
We fit the measured angular distribution of the proton from to the function , where is the overall normalization and is the corrected MC-determined efficiency function (Sect. V.2). The angular distribution and the fit are shown in Fig. 6. The for the fit is 16, with 14 degrees of freedom, and the value determined for the angular-distribution parameter is , where the error is statistical only.
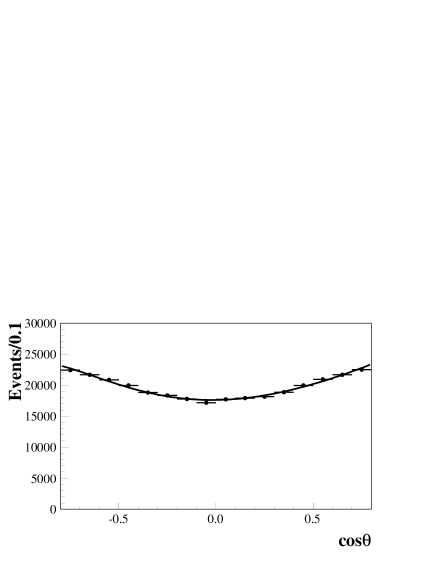
The raw yield of events obtained by counting protons in the angular range is . The efficiency-corrected yield obtained by fitting the distribution over this range is . The fitted value of is used to determine the total number of events in the full angular range of as follows:
Combining this final yield with the number of events in our sample (, we find the branching fraction to be
where the error is statistical only.
V.4 Systematic Errors and Results
To determine the uncertainty in the efficiency correction, we use toy MC experiments to obtain distributions in the branching fraction and that reflect the statistical errors of the bin-by-bin efficiency values. We perform this study by varying each bin randomly according to a normal distribution for each MC experiment, redoing the polynomial fit and then remeasuring the efficiency-corrected yield. The results have normal distributions and they are fitted with Gaussian functions to estimate the associated uncertainties in the branching fraction and , which are found to be and 0.011, respectively.
The full magnitude of the momentum sideband background estimate () is taken to be the uncertainty in the branching fraction due to the background correction. We fit the sideband-subtracted angular distribution and determine a new value for the angular parameter , taking the change relative to the standard result (0.004) as the systematic error.
To estimate the systematic error due to the detector angular resolution, we perform a study with the signal MC. The “true” generated proton is fitted before and after smearing with a MC-derived angular resolution function. The differences in the fitted values (0.010) and in the branching fractions () are taken as the systematic uncertainties from this source.
The branching fraction also incurs two systematic uncertainties that do not affect . A small systematic uncertainty enters due to the correction for the requirement, which depends on the determined value of and its error. The dominant uncertainty in the branching fraction is due to the estimated 1.3% error in the number of events in our sample ref:jpsitotnumber .
To study the effect from continuum production, we write the total cross section as
where and are the EM and strong amplitudes of and is the phase angle between them. is the cross section contributed by the continuum under the peak. These values are taken from the calculation in Sect. VII. The difference with and without is assigned as the systematic error.
Finally, we change by (includes systematic error) and reevaluate the branching fraction to estimate the systematic error in the branching fraction measurement.
Table 1 provides a summary of all identified sources of systematic uncertainty, which are assumed to be uncorrelated, and their quadrature sum. The final results for our measurements are as follows:
The branching fraction measurement is consistent with the previous world average ref:pdg and improves the overall precision by about a factor of 2.5. The value of is also consistent with previous experiments (Table 2) and is improved significantly.
| Sources | Effect on | Effect on () |
|---|---|---|
| Efficiency Correction | 0.011 | 0.005 |
| Background | 0.004 | 0.002 |
| Resolution | 0.010 | 0.004 |
| Value | 0.004 | |
| Number of | 0.026 | |
| continuum | 0.015 | |
| Total | 0.015 | 0.031 |
| Collaboration | |
|---|---|
| Mark1 Peruzzi:1977pb | |
| Mark2 Eaton:1983kb | |
| Mark3 Mark3 | |
| DASP DSAP | |
| DM2 Pallin:1987py | |
| BESII Bai:2004jg |
VI Analysis of
VI.1 Event Selection
We search for candidates by selecting events that have no good charged tracks originating in the interaction region. The antineutron annihilation “star” in the EMC provides a signature for these events that is much more identifiable than the hadronic shower produced by a neutron. We therefore first select events with showers characteristic of interactions, and then search in these events for energy deposited by hadronic interactions on the opposite side of the detector.
The most energetic shower in the event is assigned to be the candidate and is required to have an energy in the range GeV. To optimize the discrimination against backgrounds, we apply a fiducial cut of to the candidate. This ensures that the energy is fully contained in the EMC for most signal events. To suppress photon backgrounds, we impose a requirement on the second moment of the candidate shower, defined as , where is the energy deposited in the crystal of the shower and is the distance from the center of that crystal to the center of the shower. To be accepted, the candidate must satisfy cm2. To further exploit the distinctive shower topology, we require the number of EMC hits in a cone around the candidate shower direction to be greater than 40.
Events with accepted candidates are searched for EMC showers on the opposite side of the detector that are consistent with being the neutron in a decay. The energy of this shower must be between and GeV, a range found to be characteristic of the EMC neutron response in MC studies. If multiple showers are present, the one that is most back-to-back with respect to the candidate is selected. To further suppress backgrounds from all-neutral decays, continuum production and EM processes, we require , where is the total deposited energy in the EMC, excluding that of the shower and any additional energy in the cone.
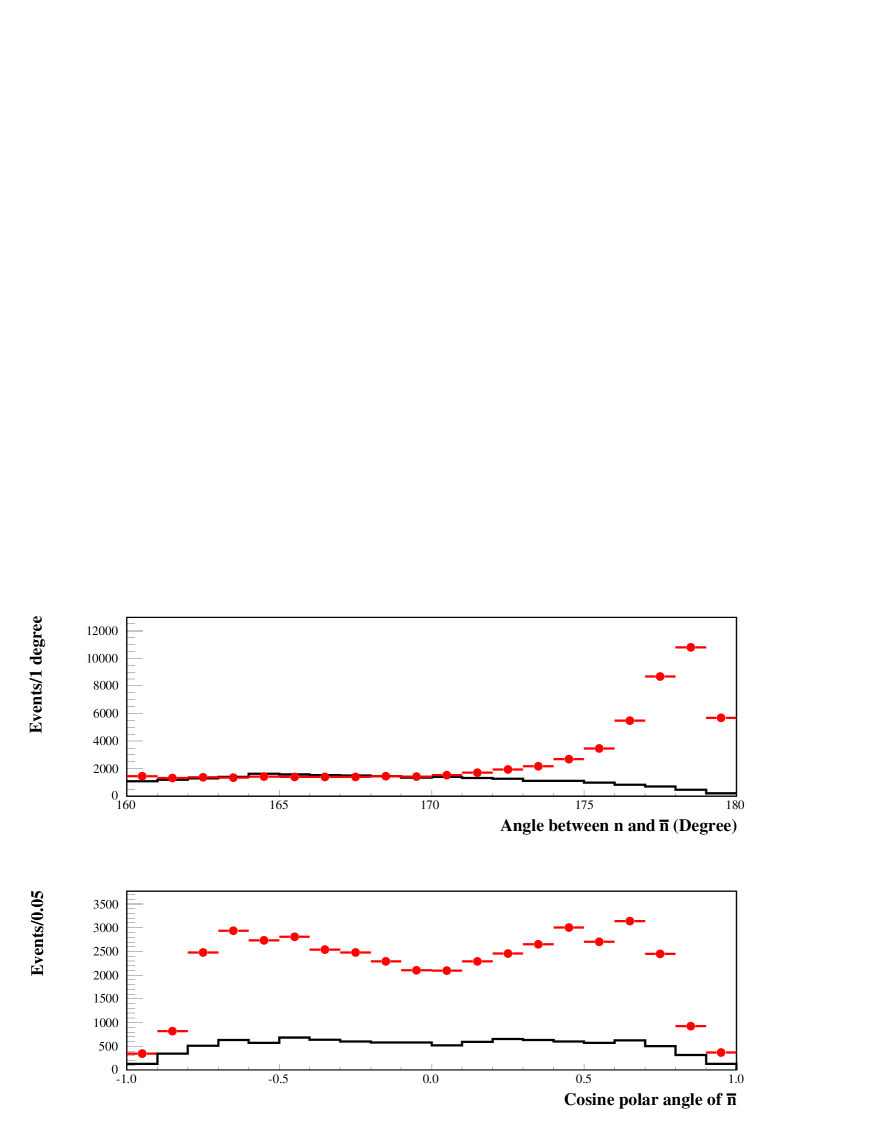
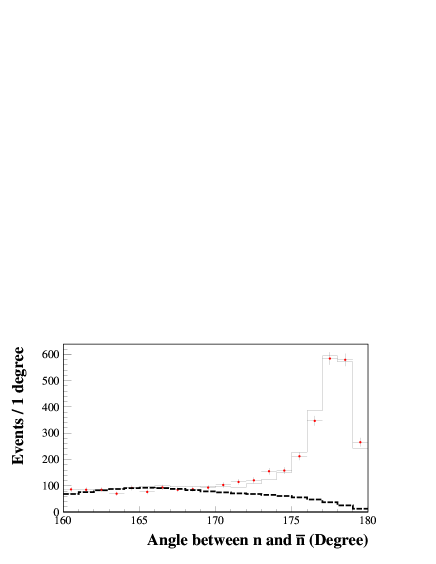
The expected signal for is an enhancement near in the distribution of the angle between the shower and the direction of the . The distributions of this angle and of the cosine of the polar angle of the shower () for selected candidates are shown in Fig. 7. The enhancement near in the distribution of the angle between the and constitutes the signal. Since there is nonnegligible background, the number of events must be determined by fitting. Distributions of the angle between the and are constructed in bins of and fitted with signal and background functions.
Data-driven methods are used to determine the efficiency and signal shapes for . We select and charge-conjugate (c.c.) events in data to obtain and samples to evaluate the selection efficiency. We use the and in events that have been selected using information from just the MDC to get unbiased information on the shape and efficiency of the and response in the EMC, since antiproton and antineutron hadronic interactions are similar.
Generic MC is used to assess the background. Fig. 7 (a) shows that there is no peaking in the distribution of the angle between the and for this background. We also consider possible exclusive background channels: , , , , , , and (). None of these potential background sources exhibits peaking in the distribution of the angle between the and .
VI.2 Efficiency Determination
We use specially chosen event samples from data to determine the efficiencies for each requirement in the selection. The overall efficiency is then computed bin-by-bin in as the product of these components and is applied as a correction in obtaining the angular distribution and branching fraction.
We select events to study the efficiency of the selection. Events with exactly two good charged tracks identified as and are selected. Information from the TOF detector and information from the MDC are combined to do the particle identification. The and are required to have a missing mass within MeV of the nominal mass. The missing momentum of the and is required to be in the range GeV/ to ensure a sample that is as similar as possible to the in (momentum 1.232 GeV/). The number of events passing the above selection gives , the expected yield. The number of candidates selected from these events (criteria defined in Sect. VI.1) that match the missing momenta of the accompanying and within gives the observed yield . The efficiency for selection is .
To validate this procedure and ensure consistency between the in and that in the signal process , we select higher-purity candidates in () with a stringent cut of on the angle between the and . (For the cut is on the angle between the and the missing momentum of the and .) Comparisons of the selection variables (energy deposit in EMC, number of EMC hits in a cone about the shower, and the shower second moment) for these two samples are shown in Fig. 8. Each distribution is plotted after the cuts on the other variables have been imposed. There is good agreement, verifying that the in is a good match to the in the signal process , and that this process provides a reliable efficiency correction.
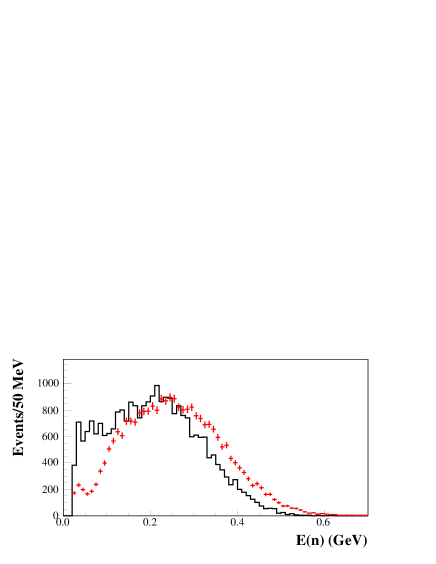
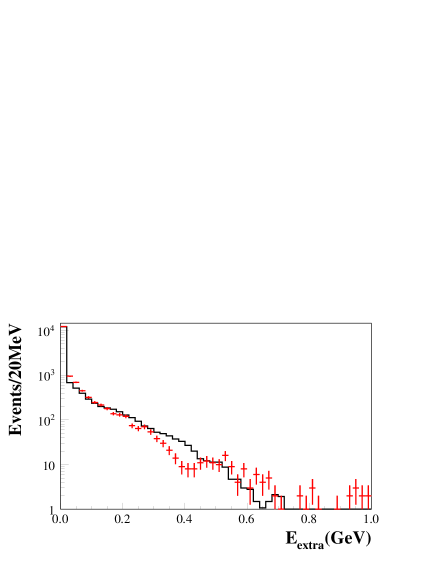
We apply the same technique to calculate the efficiency for selecting the neutron (), in this case using a sample of selected from data. A comparison of the distribution of the EMC energy for neutrons from with that from is shown in Fig. 9. In this case the momentum difference between the two samples results in a greater difference in the EMC energy than was observed in the case. This disagreement is a source of systematic error, which we try to minimize by the use of the very loose energy cut on the shower.

For the cut, we use to obtain the efficiency (). The requirements are identical to those described in Sect. V.1. Our selection of does not depend on information from the calorimeter, so the behavior of in the EMC can be used to verify the efficiency of the cut for . Figure 10 shows the comparison of the distributions for and . We require the angle between the and to be greater than to suppress background for this comparison. We find that the proportion of events in and agree well. The ratio of events with or without the requirement is calculated as the efficiency of the cut.
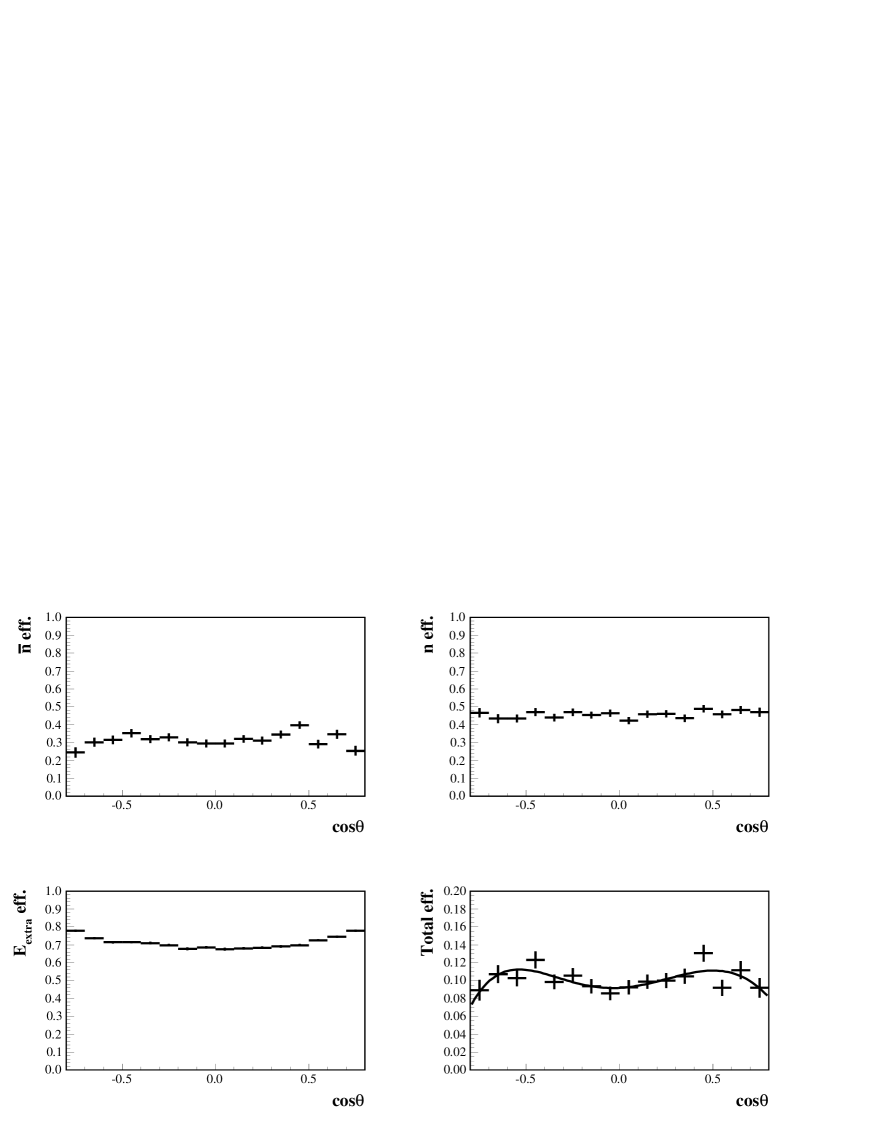
Finally, we determine the overall efficiency from the product of the three component efficiencies described above:
To facilitiate measurement of the angular distribution as well as the yield, the product efficiency is determined in 16 bins in (cosine of the polar angle) from -0.8 to 0.8. Figure 11 shows the efficiency for each cut and the product as a function of . The loss of efficiency near is caused by the requirement on the number of EMC hits in a cone around the shower. To smooth the bin-to-bin statistical fluctuations in the efficiency correction, we fit with a fifth-order polynomial (Fig. 11(d)).
VI.3 Angular Distribution and branching fraction
The number of events in each bin is obtained by fitting the distribution of the angle between the and . The signal shape is determined with the sample. Because of the 1.0-T magnetic field in the BESIII detector, the angular distribution in must be corrected before being applied to . The signal shape () for fitting the distribution of the angle between and can be expressed in terms of () and (), the polar and azimuthal angles between the shower position and the extrapolated EMC position of (), as follows:
where is the polar angle of the proton track, and . The background shape is fixed to the shape of the inclusive background, while signal and background normalizations are allowed to float in each bin. A sample fit for one bin is shown in Fig. 12.
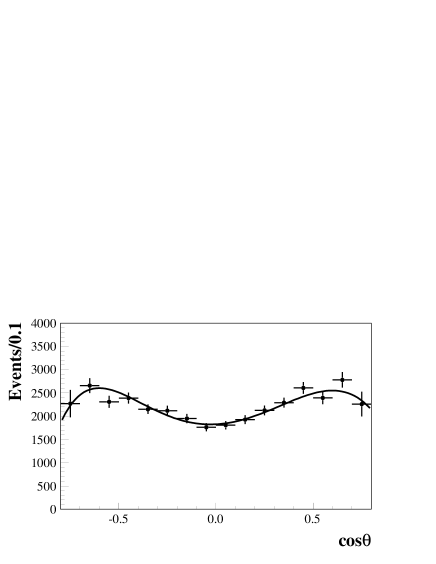
After obtaining the bin-by-bin signal yields, we fit the resulting distribution with the function , where gives the overall normalization and is the corrected efficiency. The resulting angular distribution and fit are shown in Fig. 13. The for the fit is 13 for 14 degrees of freedom, and the value determined for the angular-distribution parameter is (statistical error only).
The raw number of events in the range is . The efficiency-corrected yield obtained from the fit is . The fitted value of is used to determine the total number of events in the full angular range of as follows:
Combining this total yield with the number of events in our sample, we find the branching fraction to be
where the error is only statistical.
VI.4 Systematic Errors and Results
The different momentum distributions in (c.c.) and may introduce systematic uncertainties in the efficiency determination. We change the missing-momentum range from () GeV/ to () GeV/ when selecting the sample from (c.c.) and take the resulting differences in and the branching fraction as systematic errors. This estimation is cross-checked with a lower-statistics sample obtained from a separate BESIII data sample collected at the resonance. High-momentum candidates are selected from the decay (c.c.). The average efficiencies obtained with this sample are consistent with those from (c.c.) within statistical errors.
A second source of systematic error in the () efficiency is the effect of the requirement that the shower be within of the expected direction. We estimate the systematic errors due to this requirement by removing it and determining the changes in the results. We sum these two systematic error in quadrature to obtain the total systematic errors due to the selection of (). For the determination, the and errors are 0.04 and 0.09, respectively, and for the branching fraction they are and . For the branching fraction the efficiency is the largest source of uncertainty in our measurement.
As we did for , we use a toy MC method to estimate systematic errors due to the statistical uncertainties in the efficiency. For , this systematic error is , the largest contributor to the overall uncertainty of the measurement. For the branching fraction this error it is and is the second-largest contributor.
We change the background shape for each exclusive MC background channel and repeat the fit of the angle between and . The largest variation observed for any case considered is assigned as the systematic error.
Our signal shape in fitting the angle was obtained from . The correction of the angular distribution into one appropriate for in is a source of systematic uncertainty. To assess this we used a sideband subtraction instead of the fit to the angular distribution. We normalize the yield of MC background in the signal region () by the numbers of events in the sideband range () for data and MC background. Then we take the background-subtracted number of events in the signal region () as the yield in each bin. The differences between this alternative method and the standard method are assigned as systematic errors.
The angular resolution can introduce systematic uncertainty both through the binning and through the cut. We use the sample to evaluate the resolution for . In the data = is calculated as the equivalent of the resolution in for , where represents the extrapolated position of the at the EMC and is the reconstructed position in the EMC. Here we assume that the position reconstruction of in the EMC is similar to that for , because both are dominated by hadronic interactions. To estimate the systematic error, we smear the of with the distribution of and redo the fit in each bin, and the fit to the angular distribution. The resulting changes are taken as the systematic errors.
For the all-neutral final state the trigger efficiency is another potential source of uncertainty. We correct the efficiency curve with the MC-determined trigger efficiency and redo the fit. The resulting changes in the branching fraction and are taken as systematic uncertainties due to trigger efficiency.
To consider the systematic error from interference between the peak and the continuum, we write the total cross section as
where and are the EM and strong amplitudes for and is the phase angle between them. is the cross section contributed by continuum under the peak. These values are taken from Section VII and, as discussed there, the EM amplitude should be opposite to . The cross section close to is assumed to lie between and , so the , which is in proportion to , ranges from to , where and are the magnetic moments of the neutron and proton. To estimate the uncertainty from the continuum, we take the larger one, , therefore also . The difference with and without is assigned as systematic error.
Finally, we change by (including the systematic error) and reevaluate the branching fraction to estimate the systematic error in the branching fraction measurement.
Table 3 summarizes the systematic uncertainties and their sum in quadrature. The final results for our measurements are as follows:
The branching fraction measurement is consistent with the previous world average ref:pdg and improves the overall precision by about a factor of 2.3.
| Sources | Effect on | Effect on () |
|---|---|---|
| selection | 0.04 | 0.05 |
| selection | 0.09 | 0.12 |
| Efficiency correction statistics | 0.17 | 0.07 |
| Background | 0.03 | 0.03 |
| Signal shape | 0.02 | 0.06 |
| resolution | 0.05 | 0.01 |
| Trigger | 0.03 | 0.01 |
| value | 0.01 | |
| number of | 0.03 | |
| continuum | 0.01 | |
| Total | 0.21 | 0.17 |
VII Summary
We have used the world’s largest sample of decays to make new measurements of the branching fractions and production-angle distributions for and , obtaining the branching fractions and . These results represent significant improvements over previous measurements. The angular distributions for both decays are well described by the functional form , with measured values of for , and for .
The angular distribution can be decomposed as , where and are the total helicity and 0 decay amplitudes. In terms of the angular parameter , the ratio of amplitudes is . With our measured values for , we find and , respectively. These measurements permit discrimination among the different proposed models angletheory1 ; angletheory2 ; angletheory3 ; angletheory4 ; angletheory5 ; angletheory6 ; angletheory7 .
The relative phase between the strong and EM amplitudes can be obtained by comparing and . The EM decay amplitudes are related to the corresponding continuum cross sections close to the as follows: = . Present data Aubert:2005cb suggest that , if fitted with a smooth as expected at high enough center-of-mass energies . For the only available data Antonelli:1998fv ; hadron2011 are close to threshold. In the following it is assumed that the neutron time-like dominant magnetic form factor is negative at these center-of-mass energies, like the magnetic moment, as predicted by dispersion relations Baldini:1998qn . The cross section close to is assumed to lie between , as is seen in the present data close to threshold, and , as in the space-like region qcd2009 . Taking into account these hypotheses and their overall uncertainties, and neglecting the contribution of continuum amplitudes, the strong amplitude is given by
and the phase between the strong and EM amplitudes is found to be
The uncertainty in the phase is mostly due to the systematic error. This determination confirms the orthogonality of the strong and EM amplitudes within the precision of our measurement.
VIII ACKNOWLEDGMENTS
The BESIII collaboration thanks the staff of BEPCII and the computing center for their hard efforts. This work is supported in part by the Ministry of Science and Technology of China under Contract No. 2009CB825200; Joint Funds of the National Natural Science Foundation of China under Contracts Nos. 11079008, 11179007; National Natural Science Foundation of China (NSFC) under Contracts Nos. 10625524, 10821063, 10825524, 10835001, 10935007, 11125525; the Chinese Academy of Sciences (CAS) Large-Scale Scientific Facility Program; CAS under Contracts Nos. KJCX2-YW-N29, KJCX2-YW-N45; 100 Talents Program of CAS; Istituto Nazionale di Fisica Nucleare, Italy; U. S. Department of Energy under Contracts Nos. DE-FG02-04ER41291, DE-FG02-91ER40682, DE-FG02-94ER40823, DE-FG02-05ER41374; U.S. National Science Foundation; University of Groningen (RuG) and the Helmholtzzentrum fuer Schwerionenforschung GmbH (GSI), Darmstadt; WCU Program of National Research Foundation of Korea under Contract No. R32-2008-000-10155-0
References
- (1) R. Baldini, C. Bini and E. Luppi, Phys. Lett. B 404, 362 (1997).
- (2) C. Z. Yuan, P. Wang and X. H. Mo, Phys. Lett. B 567, 73 (2003)
- (3) P. Wang, C. Z. Yuan and X. H. Mo, Phys. Rev. D 69, 057502 (2004)
- (4) V.L. Chernyak and I.R. Zhitnitsky, Nucl. Phys. B 246, 52 (1984).
- (5) C. Carimalo, Int. J. Mod. Phys. A 2, 249 (1987).
- (6) K. Nakamura et al. (Particle Data Group), J. Phys. G 37, 075021 (2010).
- (7) A. Antonelli et al. (FENICE Collaboration), Phys. Lett. B 334, 431 (1994).
- (8) M. Ablikim et al. (BESIII Collaboration), Nucl. Instrum. Meth. A 614, 3 (2010).
- (9) “Physics at BESIII,” edited by K. T. Chao and Y. F. Wang, Int. J. Mod. Phys. A 24, No.1 (2009) supp.
- (10) M. Ablikim et al. (BESIII Collaboration), Phys. Rev. D 83, 012003 (2011).
- (11) S. Agostinelli et al. (GEANT4 Collaboration), Nucl. Instrum. Meth. A 506, 250 (2003). Geant4 version: v09-03p0; Physics List simulation engine: BERT; Physics List engine packaging library: PACK 5.5.
- (12) J. Allison et al., IEEE Trans. Nucl. Sci. 53, 270 (2006).
- (13) R. G. Ping, Chinese Physics C 32, 8 (2008).
- (14) D.J. Lange, Nucl. Instrum. Meth. A 462, 152 (2001).
- (15) Giovanni Balossini et al., Nucl. Phys. B 758, 227 (2006).
- (16) T. Sjostrand, Comput. Phys. Commun. 82, 74 (1994).
- (17) S. Jadach , B. F. L. Ward and Z. Was, Comp. Phys. Commun. 130, 260 (2000); S. Jadach, B. F. L. Ward and Z. Was, Phys. Rev. D 63, 113009 (2001).
- (18) I. Peruzzi et al., Phys. Rev. D 17, 2901 (1978).
- (19) M. W. Eaton et al., Phys. Rev. D 29, 804 (1984).
- (20) J.S. Brown, PhD thesis, University of Washington UMI 84- 19117-mc, unpublished.
- (21) R. Brandelik et al. Physica C 1, 233 (1976).
- (22) D. Pallin et al. (DM2 Collaboration), Nucl. Phys. B 292, 653 (1987).
- (23) J. Z. Bai et al. [BES Collaboration], Phys. Lett. B 591, 42 (2004)
- (24) M. B. Wise, M. Claudson, S.L. Glashow, Phys. Rev. D 25, 1345 (1982).
- (25) V.L. Chernjak, J.R. Zhitnisky, Phys. Rep. 112 (1984).
- (26) M. Gari, N.G. Stefanis, Phys. Lett. B 175, 462 (1986).
- (27) I.D. King, C.T. Sachraida, Nucl. Phys. B 279, 785 (1987).
- (28) C. Carimalo, Int. Jou. Mod. Phys. E, A 2, 249 (1987).
- (29) V.L. Chernjak, A.A. Oglobi, J.R. Zhitnisky, Zeit. Phys. C 42, 565 (1989).
- (30) N.G. Stefanis, M. Bergmann, Phys. Rev. D 47, 3685 (1993).
- (31) B. Aubert et al. (BABAR Collaboration), Phys. Rev. D 73, 012005 (2006).
- (32) A. Antonelli et al. (FENICE Collaboration), Nucl. Phys. B 517, 3 (1998).
- (33) Alexander E. Obrazovsky on behalf of the SND collaboration, “Preliminary results on hadrons from SND detector at VEPP-2000 collider,” proceedings of the XIV International Conference on Hadron Spectroscopy, 13-17 June 2011 Munich, Germany.
- (34) R. Baldini, S. Dubnicka, P. Gauzzi, S. Pacetti, E. Pasqualucci and Y. Srivastava, Eur. Phys. J. C 11, 709 (1999).
- (35) John Arrington,“Overview of proton, neutron, and pion form factor measurements,” proceedings of QCD Bound States Workshop, 15-19 June 2009, Argonne National Lab.