Direct Detections of Young Stars in Nearby Elliptical Galaxies111Based on observations made with the NASA/ESA Hubble Space Telescope, obtained at the Space Telescope Science Institute, which is operated by the Association of Universities for Research in Astronomy, Inc., under NASA contract NAS 5-26555. These observations are associated with program # 11583.
Abstract
Small amounts of star formation in elliptical galaxies are suggested by several results: surprisingly young ages from optical line indices, cooling X-ray gas, and mid-IR dust emission. Such star formation has previously been difficult to directly detect, but using UV Hubble Space Telescope (HST) Wide Field Camera 3 (WFC3) imaging, we have identified individual young stars and star clusters in four nearby ellipticals. This technique is orders of magnitude more sensitive than other methods, allowing detections of star formation to M⊙ yr-1. Ongoing star formation is detected in all galaxies, including three ellipticals that have previously exhibited potential signposts of star forming conditions (NGC 4636, NGC 4697, and NGC 4374), as well as the typical “red and dead” NGC 3379. The current star formation in our closest targets, where we are most complete, is between M⊙ yr-1. The star formation history was roughly constant from Gyr (at M⊙ yr-1), but decreased by a factor of several in the past Gyr. Most star clusters have a mass between M⊙. The specific star formation rates of yr-1 (at the present day) or yr-1 (when averaging over the past Gyr) imply that a fraction of the stellar mass is younger than Myr and is younger than Gyr, quantifying the level of frosting of recent star formation over the otherwise passive stellar population. There is no obvious correlation between either the presence or spatial distribution of postulated star formation indicators and the star formation we detect.
Subject headings:
Galaxies: elliptical and lenticular, cD — Galaxies: star clusters: general — Galaxies: star formation — Ultraviolet: galaxies — Ultraviolet: stars1. Introduction
As a class, normal elliptical galaxies are not actively forming stars. Their star formation rate (SFR) must be significantly less than M⊙ yr-1, or such activity would have been identified long ago in the form of prominent H lines or an excess of blue light. However, lower levels of star formation are suggested by small changes in optical line indices, which can be used to date stellar populations of galaxies. At constant metallicity, the Balmer line indices are sensitive to age, with inferred ages often surprisingly young. For example, in the sample of ellipticals in Trager et al. (2000), 40% have mean ages less than 6 Gyr and several are younger than 3 Gyr. Denicoló et al. (2005) obtain similar results with similar methods. This implies that many elliptical galaxies were forming stars quite recently (), in conflict with other observations that indicate little star formation in ellipticals since (Daddi et al., 2005; Labbé et al., 2005). One explanation for this discrepancy is the “frosting” effect, whereby a small rate of ongoing star formation contaminates the Balmer lines, making them relatively strong, while contributing little to the mass of the galaxy. The degree of the frosting could be understood if the rate of ongoing star formation were known, resulting in more reliable age determinations.
Several mechanisms can lead to small amounts of star formation. One avenue involves stellar winds from the ensemble of old stars in a galaxy, amounting to M⊙ yr-1 for L∗ ellipticals. Most of this stellar mass loss is believed to collide with the ambient interstellar medium (ISM) and become heated to X-ray emitting temperatures that are typically K (Mathews & Brighenti, 2003), although the efficiency of this process is unknown and some gas may remain cool (Parriott & Bregman, 2008), and occasionally may form into new stars. Most of the hot ISM in a galaxy has a cooling time much less than a Hubble time, and if not driven out as a galactic wind (through active galactic nuclei or supernovae), the gas will radiatively cool. Radiatively cooling gas is found in % of ellipticals, as apparent from the detection of the O VI line in Far Ultraviolet Spectroscopic Explorer (FUSE) observations (Bregman et al., 2005), implying a cooling rate of M⊙ yr-1. Gas emitting O VI is at the peak of the cooling curve, so it will cool to the K range. This cooled gas, confined to the central region ( kpc), is a natural source of material for star formation. In addition to the internal recycling of galactic gas, there may be infall of material onto a galaxy from other smaller galaxies or from ambient group material.
Although the gaseous content of elliptical galaxies is generally dominated by hot ( K) X-ray emitting material with masses of M⊙ (Roberts et al., 1991), some evidence for cool gas ( K) exists in addition to O VI emission. H-emitting material at K is present in the central kpc () of most ellipticals (Mathews, 1990; Caon et al., 2000), although it constitutes a relatively small amount of gas ( M⊙). While few elliptical galaxies have detectable amounts of H I ( M⊙) or H2 (Roberts et al., 1991; di Serego Alighieri et al., 2007), 5-10% were detected at 60-100 m by IRAS (Bregman et al., 1998), showing that dust emission is occasionally present. Extinction by dust lanes is also seen in % of ellipticals, and is generally near the center (Lauer et al., 2005). Evidently, cool gas exists in ellipticals and is most common in the central region, but we do not know the fate of this material nor whether its presence is stable or varies with time.
A good strategy for quantifying the amount of recent star formation in normal ellipticals is to work in the ultraviolet (UV), where old, red stars that dominate these galaxies contribute little compared to hot horizontal branch stars, post-Asymptotic Giant Branch (p-AGB) stars, and young stars (O’Connell, 1999). Indeed, many near-UV (NUV) observations have been made of early-type galaxies in an attempt to quantify amounts of recent star formation. For instance, using the Wide-Field Planetary Camera 2 (WFPC2) on the Hubble Space Telescope (HST), Ferreras & Silk (2000) found that most ellipticals in a cluster must have young stellar mass fractions of at least , and in many cases to , to account for their rest frame Å emission. At lower redshift, Kaviraj et al. (2007) studied a sample of early-type galaxies selected systematically from the Sloan Digital Sky Survey and found that of them had Galaxy Evolution Explorer (GALEX) NUV-optical colors that required a young ( Gyr) component, amounting to – of their stellar mass (see also the similar earlier study by Yi et al., 2005).
A handful of UV observations have also been made of individual stars, though these observations have mostly been limited to the nearest galaxies. Perhaps the most comprehensive set comes from Brown et al. (2008), where the UV population of stars in the nearby elliptical M32 (with a distance, kpc) was studied via near and far-UV data from the Space Telescope Imaging Spectrograph (STIS) on HST (see also Brown et al., 2000) and using stellar evolution models. However, because Brown et al. (2008) focused on determining the UV contribution from p-AGB stars and other stars at late evolutionary stages, and because the field of view of STIS was small (), no analysis of young stars in M32 was performed. This technique of imaging individual stars has also been applied to nearby lenticular galaxies; for example, NGC 5102, a nearby S0 ( Mpc), where Deharveng et al. (1997) used the Faint Object Camera (FOC) on HST to search for individual young stars as point sources and deduced a limit for the star formation rate of M⊙ yr-1. Deharveng et al. (1997) also observed NGC 3115, another nearby S0 ( Mpc), though they detected no stars and concluded that the FOC was not useful for detecting these stars at the distances of most elliptical galaxies. More recently, Crockett et al. (2011) detected clumps of blue stars in the more distant S0 NGC 4150 ( Mpc), using HST’s Wide Field Camera 3 (WFC3), and determined the star formation history of NGC 4150 by fitting the UV-optical SED on a pixel-by-pixel basis to a two-burst model.
In this paper we present HST WFC3 UV imaging of four nearby elliptical galaxies, which we used to determine star formation rates through the direct identification of young stars and star clusters. Star formation rates were measured to levels of M⊙ yr-1, a limit that is much lower than the M⊙ yr-1 limits that have previously been attained for galaxies at similar distances (O’Connell, 1999). Our sample, which we describe in §2.1, includes three ellipticals with potential signposts of star forming conditions, plus one control galaxy with no prior indication of star formation. Observations and photometry are also described in §2. We present the detected UV bright sources in §3, and discuss their physical nature in §4. Star formation rates and histories from the UV bright clusters are presented in §5, and we conclude with a discussion in §6.
2. Data
2.1. Sample Selection
Our sample consists of nearby normal L∗ elliptical galaxies, which are located between Mpc and the Virgo Cluster, with the farthest targeted galaxy at Mpc (all distances were determined via surface brightness fluctuations by Tonry et al., 2001). Three normal elliptical galaxies that demonstrated potential signposts of star formation were included, as well as one typical elliptical that has shown no indication of having current star formation. The observed targets are summarized in Table 1 and are presented below:
| Galaxy | Type | Notes | |||
|---|---|---|---|---|---|
| (Mpc) | (arcsec) | ||||
| NGC 3379 | E1 | 30.12 | 10.6 | 29.9 | no prior star formation indicator |
| NGC 4697 | E6 | 30.35 | 11.8 | 42.4 | PAH emission |
| NGC 4636 | E0-1 | 30.83 | 14.7 | 59.3 | O VI emission, cooling flows |
| NGC 4374 | E1 | 31.32 | 18.4 | 34.8 | O VI emission, AGN activity |
NGC 3379 — We selected the nearest normal elliptical that is old ( Gyr; Trager et al., 2000) and has no indication of recent star formation, NGC 3379 (M105). It is the closest galaxy in our sample at Mpc, and was chosen as the control galaxy to allow tests of whether the possible star formation indicators in the other galaxies within our sample, such as O VI emission, AGN activity, and PAH emission, are reliable tracers of ongoing star formation.
NGC 4697 — With a distance of Mpc, NGC 4697 is our second closest target and is usually designated a typical elliptical galaxy. However, from a sample of 30 nearby normal ellipticals observed with the Spitzer Space Telescope (Bregman et al., 2006a, b), it is the only galaxy that exhibited a polycyclic aromatic hydrocarbon (PAH) feature. Although PAH emission can be produced without star formation, e.g., via the winds of intermediate-age stellar populations (Vega et al., 2010), it is often an indicator of such activity.
NGC 4636 — A cooling flow elliptical within the Virgo Cluster, NGC 4636 has a distance of Mpc. It has abundant X-ray emitting gas that cools on short timescales, and exhibits O VI emission (Bregman et al., 2001, 2005). This O VI emission is an excellent tracer of cooler gas that could feed star formation and indicates a cooling rate of M⊙ yr-1.
NGC 4374 — The farthest of our targets, NGC 4374 (M84) is in the Virgo Cluster and has a distance of Mpc. O VI emission has been detected in this galaxy (Bregman et al., 2005), suggesting the presence of cooling gas that can feed star formation. Radio jets and AGN activity are also present, which may correlate with star formation (e.g., see Heckman et al., 2004).
2.2. Observations and Data Reduction
Observations were conducted using HST’s WFC3 between 2009 November 23 and 2010 March 29 (Cycle 17, PID 11583). These observations were made using UVIS through two filters, F225W and F336W, which are spaced far enough in wavelength that stars on the main sequence would stand out in color from possible contaminants such as UV-bright globular clusters on a color-magnitude diagram (CMD). Not only are the background levels in the UV substantially lower than at optical wavelengths, but fluctuations in the background due to horizontal branch stars (Worthey, 1993) are much fainter than young stars, which are expected to emit strongly in the UV.
Each galaxy was observed over two orbits for each of the F225W and F336W filters. Dithered observations were performed over each two-orbit sequence, using the UVIS box dithering pattern with four pointings per orbit to aid in the removal of artifacts. Each pointing had an exposure time of 600s, for a total of 4800s per filter per galaxy. As the exposure times were the same for all four of our targets, the data of NGC 3379 and NGC 4697, our closest targets, are deeper than those of NGC 4636 and NGC 4374.
Data were reduced on-the-fly during retrieval from the Multimission Archive at STScI (MAST), resulting in pipeline-calibrated and flat-fielded individual exposures. We then removed cosmic rays, corrected geometric distortions, and combined the dithered pointings from each orbit using Multidrizzle (Koekemoer et al., 2002). The resulting drizzled images were used as the reference frame while the photometry was performed.
2.3. Photometry
We performed PSF photometry using dolphot (version 2.0; Dolphin, 2000), a stellar photometry package with specific HST instrument modules. In addition to its customized settings for WFC3 data, dolphot can perform localized background subtraction during the photometering, which was crucial due to the background emission near the center of each galaxy that needed to be subtracted carefully, particularly in F336W.
For each galaxy, we used the deep multidrizzled F225W image as the reference frame. Initial estimates for the position shifts, magnification and rotation were made using the wfc3fitdistort task, and the individual dithered exposures were then photometered on a chip by chip basis. All recommended settings for WFC3 data were used, with the exception of the sky-fitting setting (FitSky). Instead of fitting the sky prior to each photometry measurement, the sky was fit inside the PSF region of 10 pixels but outside the photometry aperture of 4 pixels. This was done to properly take into the account the varying background levels near the center of each galaxy, particularly at radii dominated by background levels in F336W. The output magnitudes from dolphot are automatically calibrated using Vega zeropoints, while aperture corrections were determined manually using the qphot task in IRAF. Reddening corrections are based on the dust maps of Schlegel et al. (1998) using 111http://wwwmacho.mcmaster.ca/JAVA/Acurve.html.
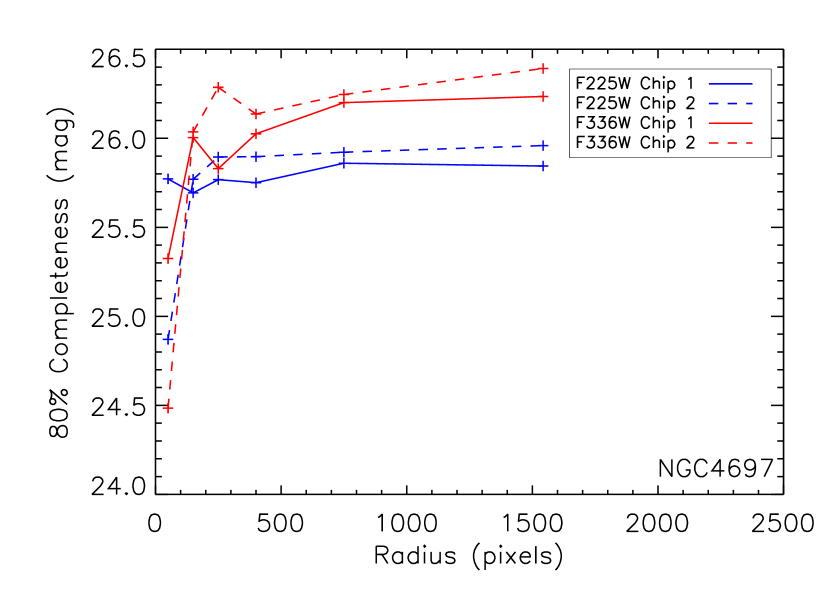
Completeness limits were determined based on artificial star tests using approximately artificial stars. We imposed a density distribution for the artificial stars, avoiding the chip gap, so that there are approximately equal number of stars in uniformly-spaced radial bins. Completeness curves were then computed within circular annuli centered on each galaxy. We imposed magnitude cuts at the 80% completeness level in both of the F225W and F336W filters, and then derived the accuracy of the recovery based on distance from the center of the galaxy per chip, as there is a difference in sensitivity per UVIS chip. The 80% completeness limit changes as a function of radius, with sources farther from the center of the galaxy being easier to detect due to the lower background. This trend is demonstrated in Figure 1, which is the completeness limit as a function of radius for NGC 4697, per filter and chip. The radial trend is weak outside the inner 200 pixels, with only a 0.3 magnitude maximum variation, where 200 pixels corresponds to only of the area within the effective radius of NGC 4697.
After completeness limits were applied, further cuts were made to the detected source list based on output from dolphot. First, elongated objects, objects that are too sharp, and extended objects were omitted from the list (i.e., sources with object types greater than 2). All sources containing too many bad or saturated pixels were also omitted (i.e., those with error flags greater than 3). Last, we applied a sharpness cut of , which we determined via testing to be the most appropriate cut for selecting point sources.
Despite performing the photometry carefully, imposing strict completeness limits based on the artificial star tests, and applying careful cuts based on dolphot quality flags, some contamination from extended and background sources was apparent in all four galaxy fields as well as all eight blank fields that were used to estimate background contamination (§2.4). We visually identified these obvious features, which stood out particularly in F336W, and then removed them by hand. We did not remove anything that was ambiguous, i.e., we only removed sources that were clearly elongated and/or clearly part of a nearby background galaxy whose bright, star forming regions were detected as individual clumps. After removing these features, the remaining sources do not appear to correspond to any visible galaxies when their positions are overlaid on optical images.
2.4. Background Control Field
While many background galaxies are easily identifiable by their extended structures, it is certain that unresolved background galaxies and point-like AGNs contaminate our source lists. To estimate the effect of this contamination in our fields, we searched MAST for WFC3 observations in the F225W and F336W filters that had similar exposure times to our data, and used all available data that are suitable as blank fields; eight fields from HST PID 11359 (Cycle 17; HUDFs 1-8). We retrieved the pipeline-calibrated WFC3 F225W and F336W data for these fields from MAST and photometered them identically to our four galaxies.
Although the blank fields were observed with the same filters and instrument, the exposure times differ from those of our observations: each F225W blank field was observed for 5688s (roughly 800s longer than our exposures) and each F336W blank field was observed for 2778s (roughly 2000s shorter than our exposures). The similar exposure times of the F225W images in the blank fields and in our fields, which were used as reference frames in all cases, lends to the photometry being performed quite similarly with dolphot. As we are particularly interested in blue sources, the depth in the redder filter is not as important, though it isn’t particularly shallow, being only 0.3 magnitudes more shallow in F336W.
Identical cuts based on output from dolphot were applied to the blank fields, including object type, error flag, and sharpness. Likewise, all obvious extended sources that were not removed by these cuts were removed by hand, as was done in each of our target fields. We also imposed a magnitude cut based on the artificial star tests that were run on our galaxies, to ensure that we did not include any objects that were only visible due to the deeper F225W data. Aperture and reddening corrections were applied as described in §2.3.
We assume all remaining sources within the blank fields to be representative of the unresolved background galaxy and point-like AGN population, as there is no reason to expect other contaminants such as stars in these fields. We combined the source lists of all eight blank fields and scaled their total area to the area of one WFC3 field to estimate the magnitudes and quantity of expected background sources in one WFC3 field. While cosmic variance may play a role in the amount of background contamination, we cannot account for these effects due to the small area of the sky covered by the eight fields in the HUDF and the lack of similar data in other blank fields.
3. UV-bright Sources
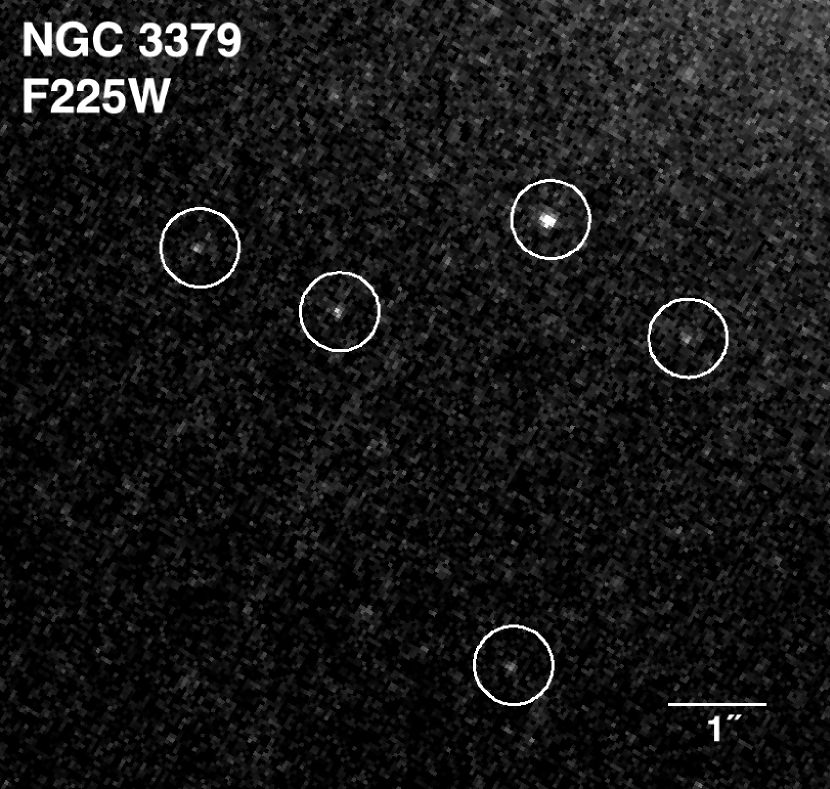
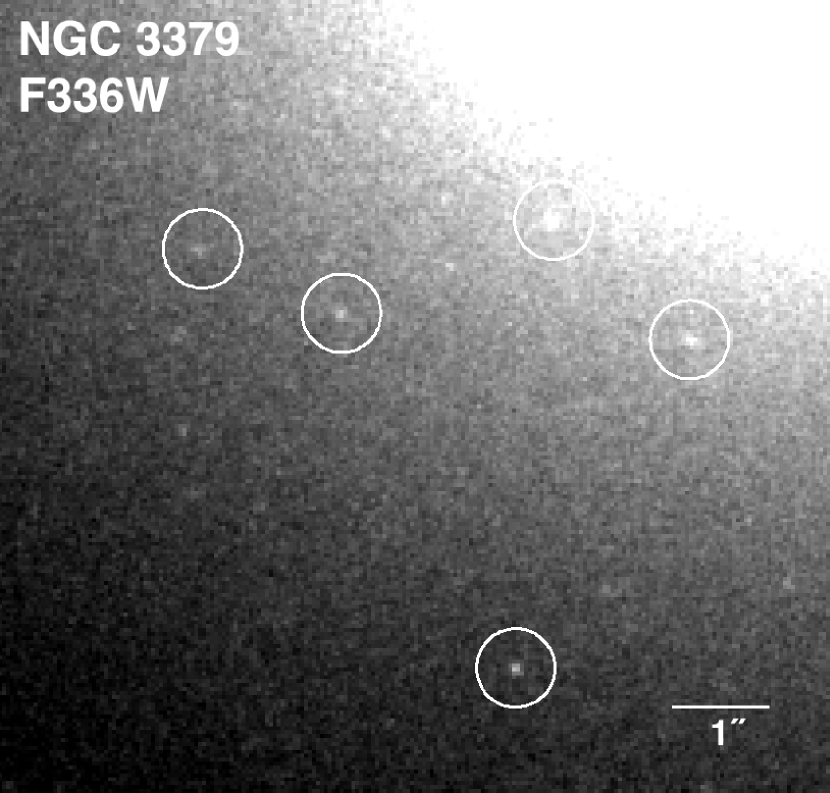
UV-bright sources are detected in all four of our targeted galaxies, though there is variation between the number and positions of sources per galaxy. An example of several of these sources can be seen in Figure 2, which displays a small portion of the observed NGC 3379 field in both the F225W and F336W filters. Figure 2 also demonstrates a noticeable difference in the surface brightness of NGC 3379 per filter, where the surface brightness in F225W is extremely low, even compared to that of F336W. This demonstrates the importance of removing the background emission surrounding individual sources carefully during the photometry process, as discussed in §2.3. It also demonstrates the usefulness of the F225W and F336W filters in searching for young stars, as the optical filters would be even more dominated by each galaxy’s surface brightness, rendering this experiment impossible.
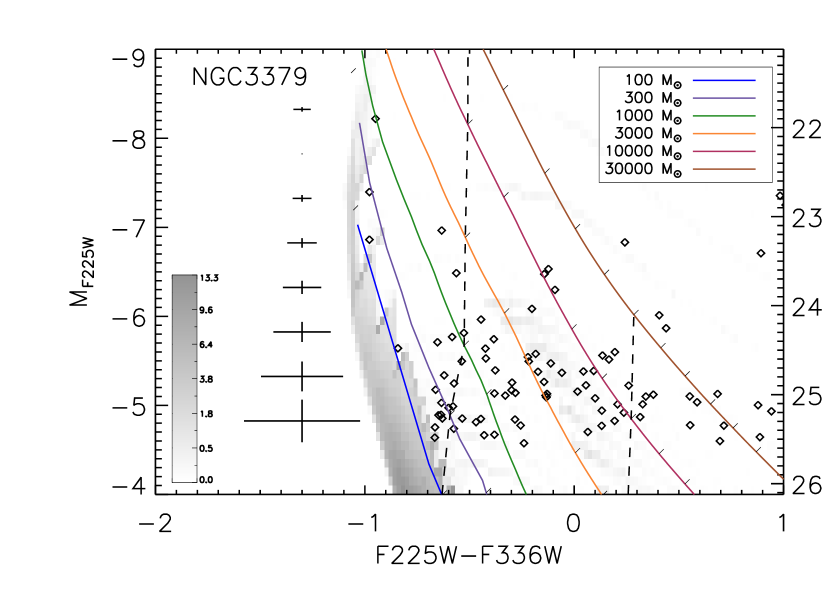
3.1. Color-Magnitude Diagrams
Color-magnitude diagrams for all four targeted galaxies are presented in Figure 3. Magnitude limits were determined via artificial star tests, and the deepest magnitude limits are indicated on the CMDs by dashed lines. The apparent magnitude limits, which are a function of radius, typically ranged from and . These variations were also dependent on chip, as the UVIS chip 2 is more sensitive than chip 1 by 0.2 magnitudes. The inner radial bin, with a radius of 100 pixels, had a much shallower limiting magnitude than the other radial bins, being about 1 magnitude shallower than the deepest limit, except in NGC 4374 where there is a lot of structure in the innermost bin, resulting in the inner bin being about 2 magnitudes shallower. However, the vast majority of sources are not within the first radial bin as it encloses very little area () of the entire WFC3 field. The absolute magnitude limit is strongly dependent on the distance to each of these galaxies, resulting in much deeper data for NGC 3379 and NGC 4697 than for our other two targets, which accounts for much of the discrepancy in the number of detected sources for each galaxy.
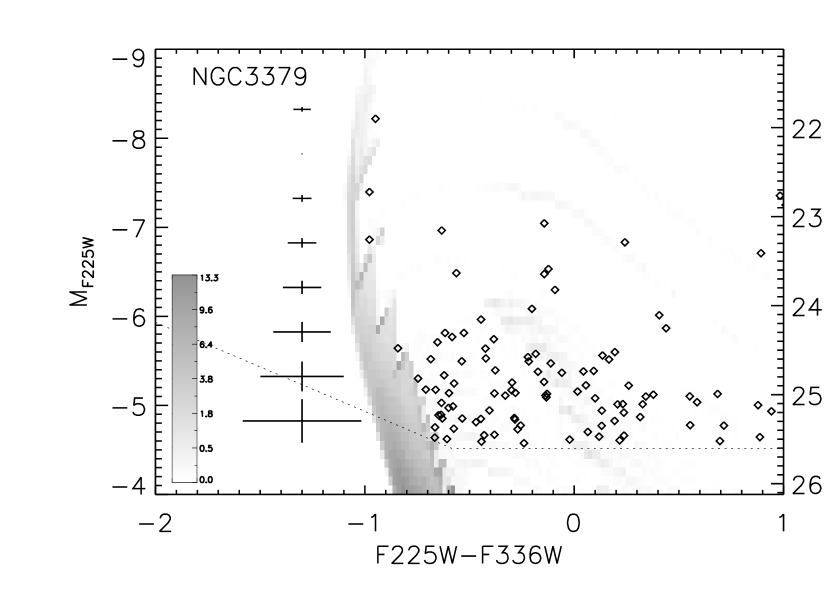
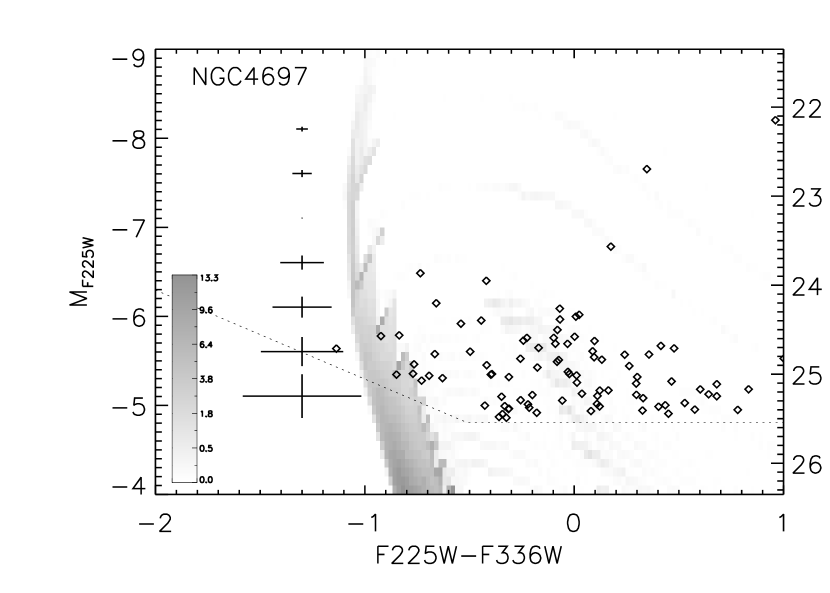
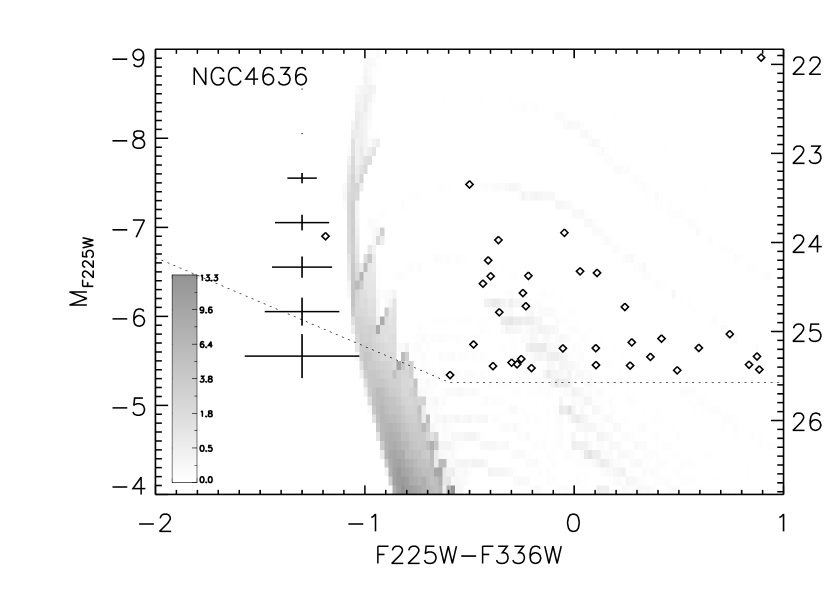
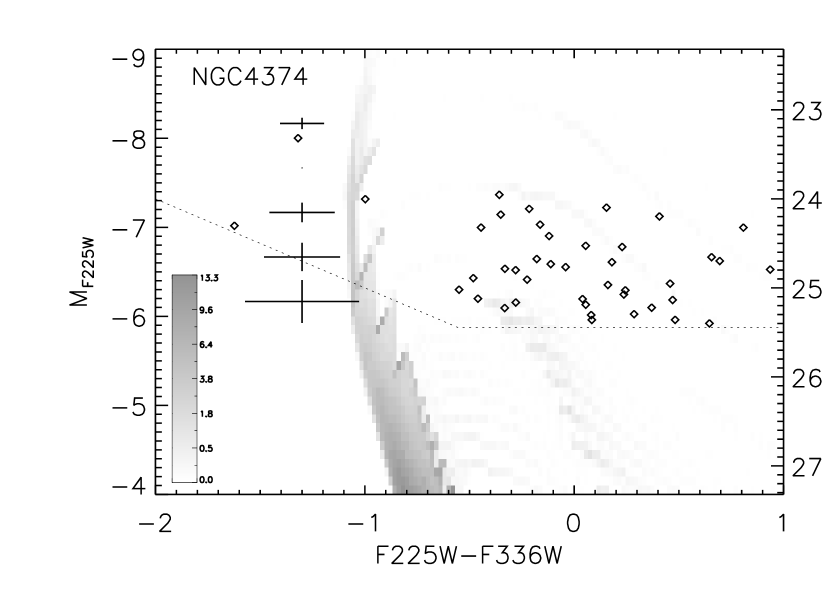
Sources are overlaid on a grayscale Hess diagram, which indicates the probability of stars at a given location on the CMD assuming a Salpeter initial mass function (IMF) and a constant star formation rate (SFR) over the past 100 Myr. The Hess diagram is based on stellar evolutionary tracks from BaSTI (Pietrinferni et al., 2004), assuming solar metallicity, solar alpha abundance, canonical models, and a Salpeter IMF from 2 to 30 M⊙ (we are limited at the high mass end by the absence of more massive BaSTI tracks, and lower mass stars will not be observable with our data). The numbers have been rescaled to account for lower-mass stars assuming a Chabrier (2003) IMF.
As globular clusters emit in the UV and are commonly found in ellipticals, we determined the colors of globular clusters in the F225W and F336W filters using the existing Dirsch et al. (2005) catalogue for NGC 4636, where we matched the positions of optically identified globular clusters to detected sources in our sample. Out of matched globular clusters, only 1 had a color blueward of . We therefore expect very little, if any, contamination from globular clusters within the color range of . Redward of , however, the CMDs are dominated by globular clusters, and so we limit the CMD color range to as the globular cluster populations of these galaxies are beyond the scope of this study.
3.2. Source Distribution
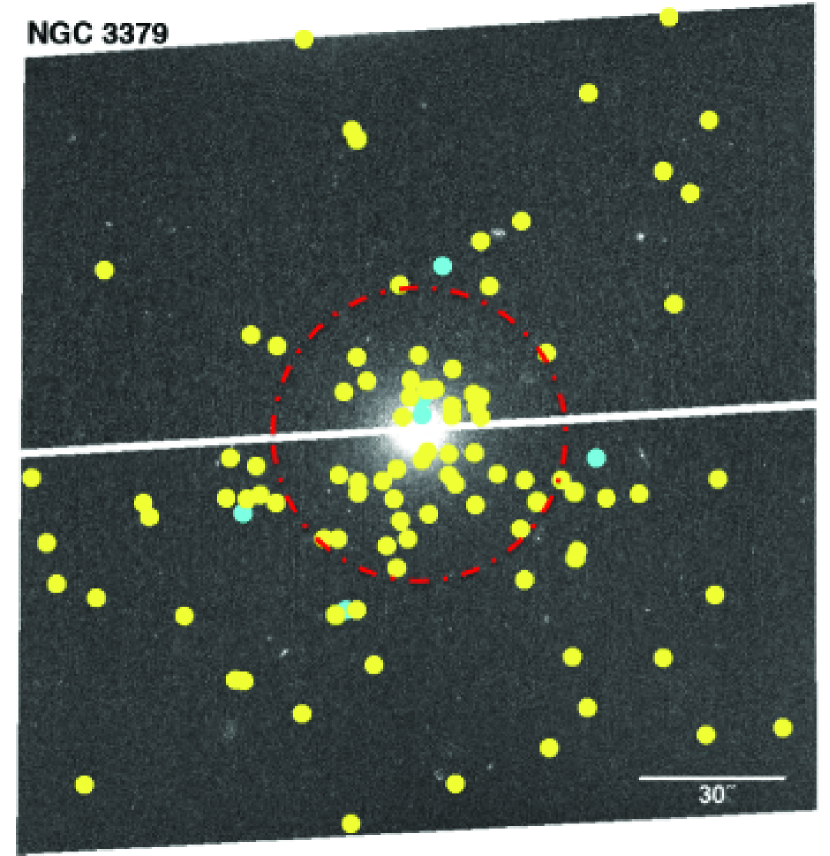
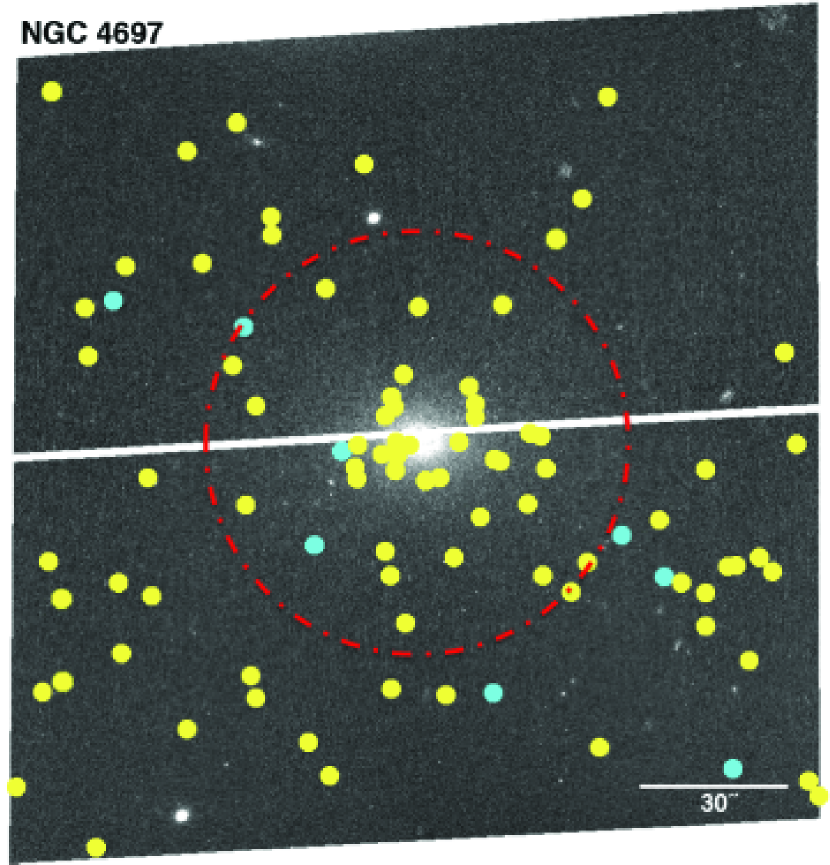
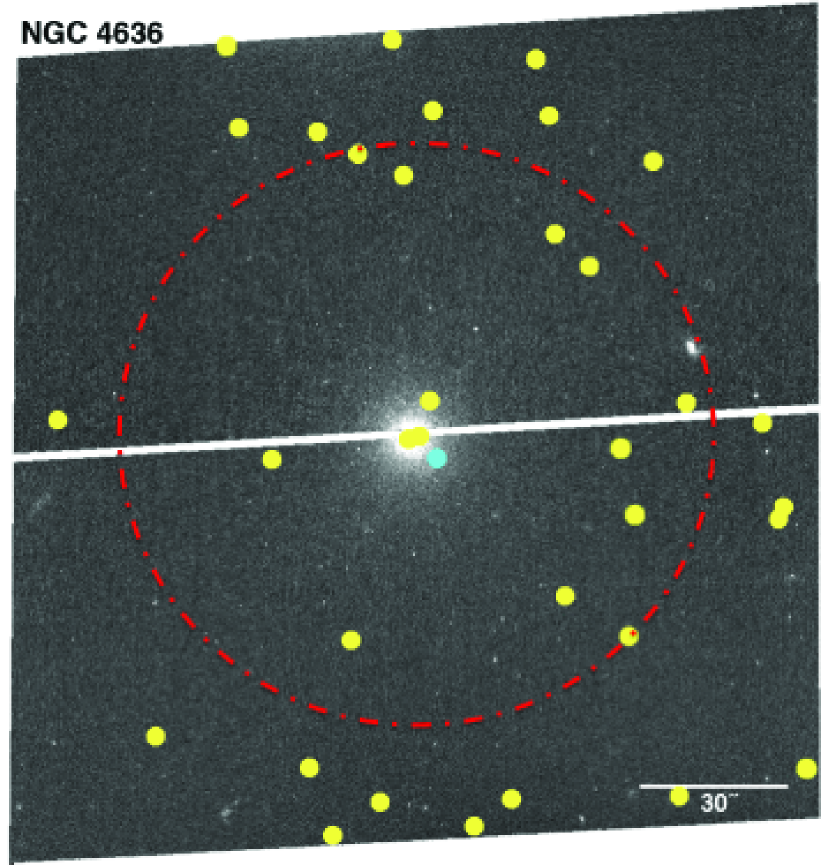
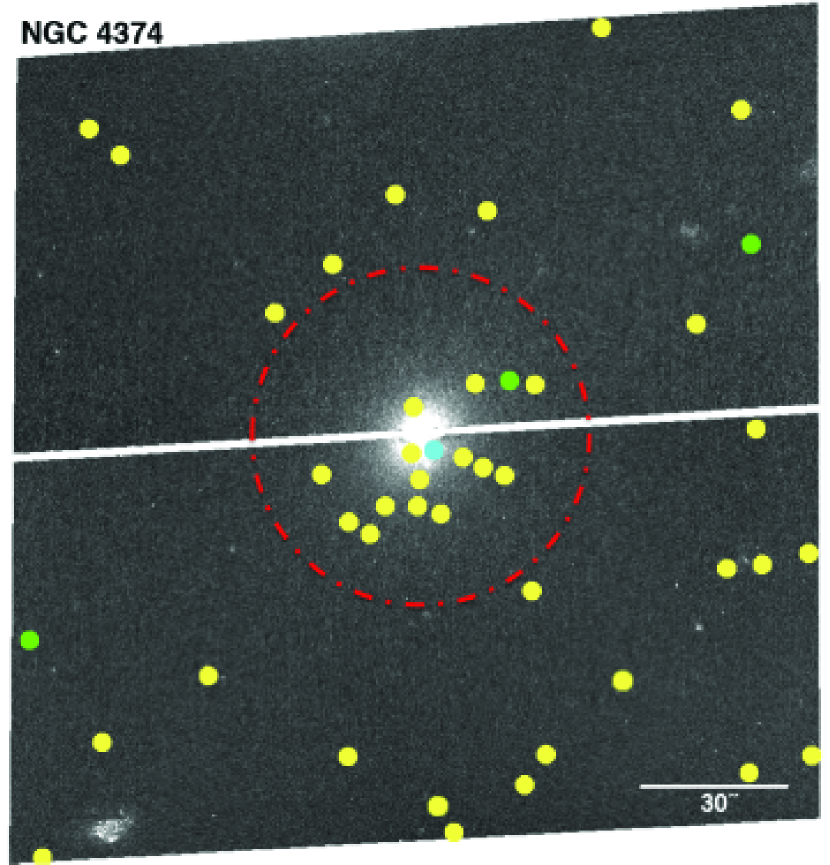
WFC3 F225W images for each galaxy are shown in Figure 4, where the positions of sources in our sample (all sources with ) are marked by colored dots. Each color represents a different F225WF336W range: blue represents all sources that are near the main sequence (), yellow represents all sources with colors to the red of the main sequence (), and green represents all sources to the blue of the main sequence (); there are only 3 green points, all of which are in NGC 4374. Many sources are concentrated around the centers of NGC 3379, NGC 4697, and NGC 4374, while there are fewer sources near the center of NGC 4636. Also, most sources are not within the color range of the main sequence, and instead have colors within .
3.3. Radial Surface Densities
Radial surface density profiles of the detected sources are given as a function of effective radius in Figure 5. The dotted, horizontal lines in each plot represent the mean density of background sources determined from the background control field, the CMD for which is shown in Figure 6 and was determined by combining the eight blank HUDF fields. This background has not been subtracted from the target galaxies CMDs in Figure 3. The solid, curved lines represent de Vaucouleurs profiles (de Vaucouleurs, 1948) that are scaled by each galaxy’s corresponding and are arbitrarily scaled in amplitude for reference. Different F225WF336W ranges are represented by different colors, where blue represents sources that have colors expected of individual young stars based on stellar evolutionary tracks, green spans colors expected of background galaxies and AGNs (see Figure 6), as well as other potential objects that are off the main sequence, and red represents the remaining sources with F225WF336W redder than that expected from the background sample and main sequence stars. The surface densities account for unobservable regions within each radial bin, such as the corners of the fields and the chip gap.
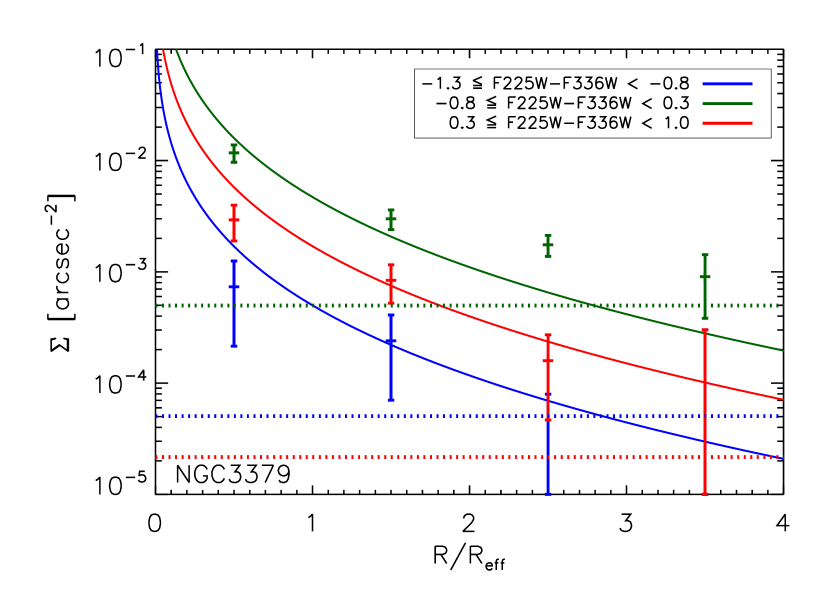
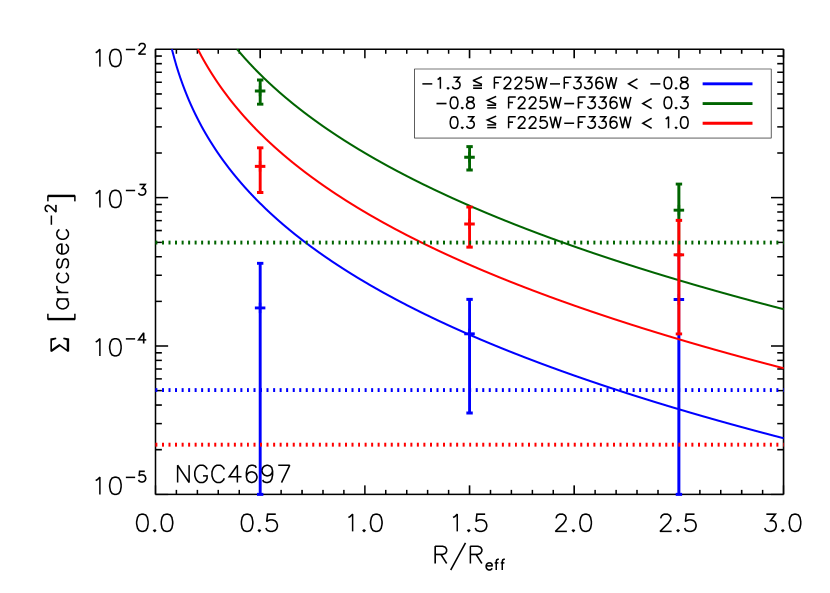
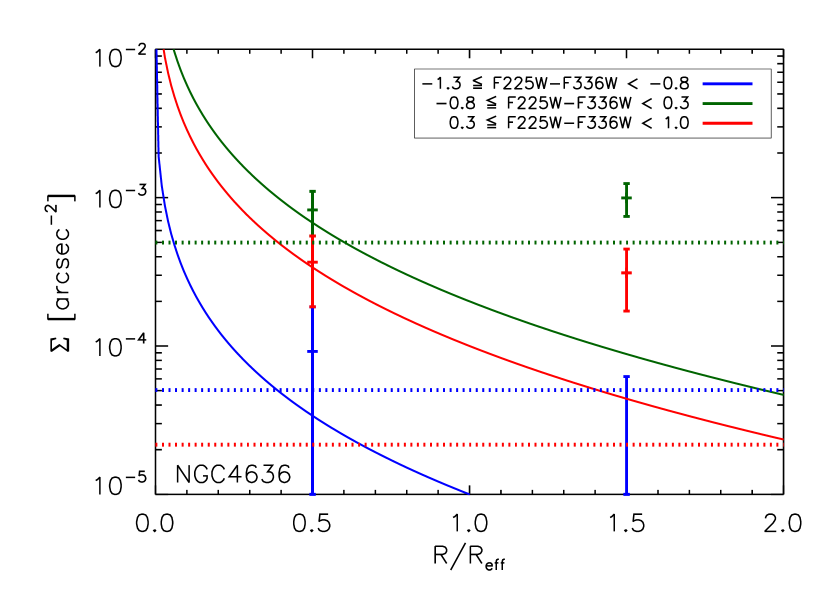
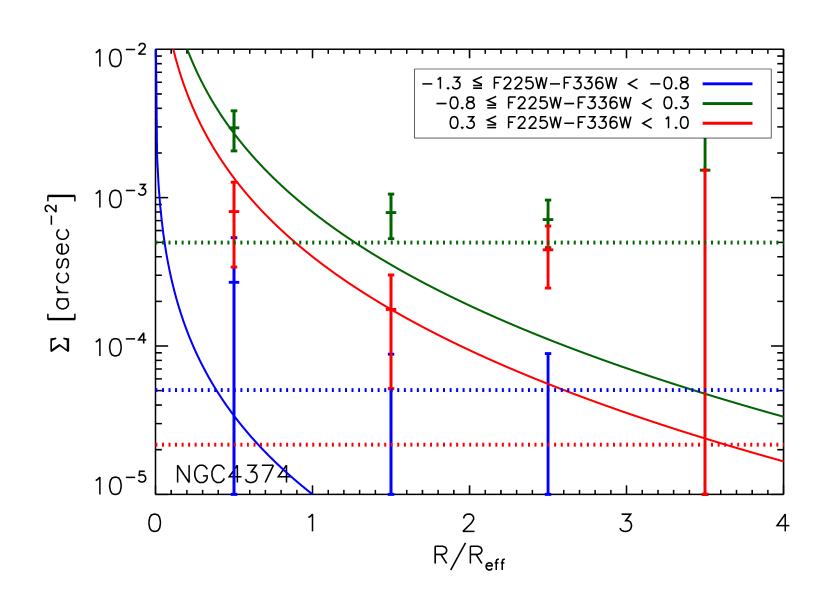

The majority of sources are in the intermediate (“background”) color range. In both NGC 3379 and NGC 4697, the surface density of sources in all three color ranges are above the mean density of background sources and reveal that these sources are concentrated about the centers of these galaxies. These trends are also seen in NGC 4374, but at lower significance. There is no clear evidence for an excess above the background in NGC 4636, except possibly for the reddest sources at intermediate radius. This is in agreement with the impression given from Figure 4, where the sources do appear concentrated towards the center of the galaxy, especially those within the intermediate color range. Some fraction of these UV-bright sources must therefore be associated with the target galaxies and cannot simply be an overlap in background sources.
4. Source Identification
A variety of sources emit in the UV, including old, horizontal branch and p-AGB stars, young stars, helium burning stars on the blue loop, open and globular clusters, AGNs, and background galaxies. It is therefore crucial to determine the expected colors and magnitudes of each of these sources and address the likelihood of their detection in our targeted galaxies, which we describe in the following subsections. As discussed in §3.1, we have already eliminated globular clusters from our sample by restricting our analysis to sources with , as sources with F225W-F336W greater than are much too red to be the young stars and open clusters that we are searching for. Globular clusters are therefore omitted from the discussion below.
4.1. Main Sequence Stars
We used stellar evolutionary tracks from BaSTI (Pietrinferni et al., 2004), which were derived specifically for WFC3 filters, to construct a Hess diagram assuming a Salpeter IMF and constant SFR over the past 100 Myr. The tip of the main sequence is clearly visible in Figure 3, spanning , and is where young, hot stars would be expected on the CMD if they were present in our targets. In all but one of the targeted galaxies there is at least one detected source within this color range, making it entirely possible that they are young O or B stars. For reference, main sequence O stars range from to , while main sequence B stars rapidly become too faint to be detected (e.g., a B2V star has ).
It is clear in the CMDs, however, that the majority of sources are not located on the main sequence, but instead are mostly redder in color. To determine whether main sequence stars could be found at these colors, we estimated the effect of metallicity on the location of the main sequence. We created Hess diagrams using -enhanced models with , , , and . Higher metallicities indeed shift the evolutionary tracks to the red, but the magnitude of the effect is small: e.g., using () instead of solar metallicity results in a shift of the main sequence of +0.1 in color.
Another possibility that could account for the appearance of the sources being redder than that of the expected location of the main sequence is the presence of dust. It is possible that there is dust at the center of some or all of our targeted galaxies, and indeed is evident by obvious dust lanes that are visible in our data of NGC 4697 and NGC 4374. However, these visible dust lanes are limited to the very central regions of the galaxy (within a radius of for NGC 4374, the galaxy with the most prominent dust features), and most of our targets are much farther from this region. So, although some sources may appear redder due to dust, it is unlikely that this is the case for all of the targets between . We have also corrected for foreground reddening based on the dust maps of Schlegel et al. (1998).
We conclude that if the sources lie on the grayscale of the Hess diagram in Figure 3, then by definition the sources can be individual stars with masses of M⊙, but that none or very few of the redder sources are individual stars. It is possible, however, that they represent a population of open star clusters, a theory we investigate in §4.2.
4.2. Star Clusters
If stars are forming in these nearby elliptical galaxies, it is likely that of the stars form embedded in clusters instead of individually (Lada & Lada, 2003). Although zero-age clusters are dominated by the most massive star, and therefore would lie on the grayscale in Figure 3, they quickly evolve to redder colors and become fainter as they lose their bright O and B stars.
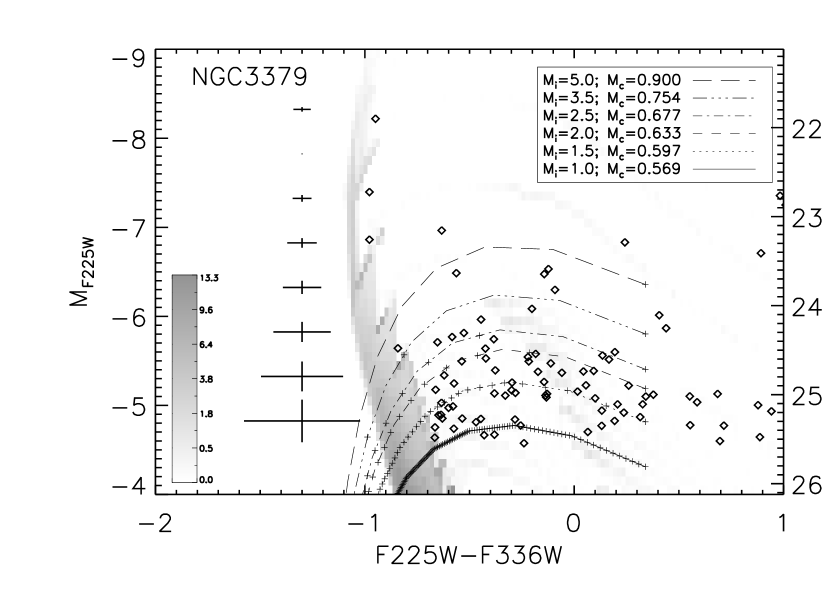
A CMD for each galaxy is shown in Figure 7 with evolutionary tracks of open clusters overlaid. The evolutionary tracks were determined assuming a Salpeter IMF and using BaSTI stellar evolutionary tracks (Pietrinferni et al., 2004), as a funtion of cluster mass, assuming that stars die instantly once they evolve off of the main sequence. The main sequence lifetimes, , are assumed to follow:
| (1) |
which is a good approximation to the lifetimes in Figure 4 of Schaller et al. (1992) over the range of relevance. Tracks for clusters with masses ranging from M⊙ to M⊙ are overlaid. These CMDs have also been corrected for background contamination, where points on the CMD were matched to the distribution of sources in the background CMD, which was scaled to the area of one WFC3 field, have been removed for a clearer picture of the intrinsic CMD. As this procedure is statistical in nature, it should not be used when examining individual sources, but it gives an accurate picture of the effect of background contamination on the CMD. Cluster tracks are the same for all four galaxies.
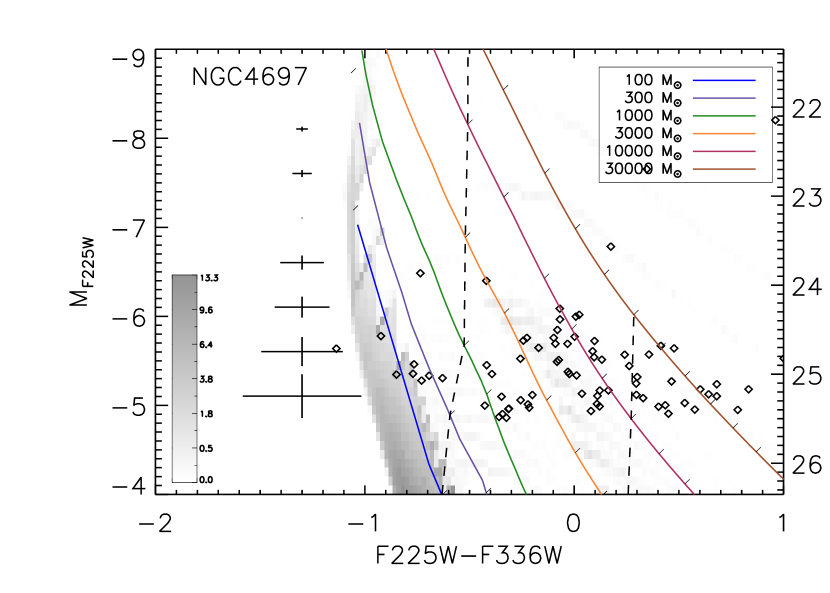

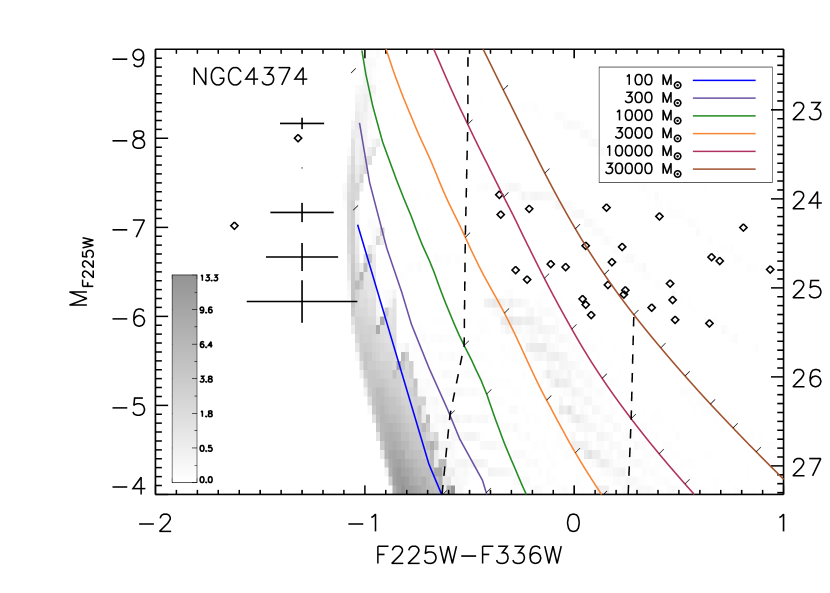
If the sources are open clusters, their distribution in the CMD reflects the cluster mass function, the rate at which clusters traverse the CMD, and the recent star formation history (SFH). For a constant SFH, the first two factors approximately cancel out at a given absolute magnitude: high mass clusters are produced less often than low mass clusters, but evolve more slowly (and therefore “pile up” on the CMD) at a given luminosity because they are later in their evolution. For example, if the cluster IMF slope is (e.g., see Gieles, 2009), clusters with masses between M⊙ to M⊙ are 10 times more numerous as M⊙ to M⊙ clusters, but evolve 14 times faster between , where most of the sources are located. We therefore expect star clusters to be approximately uniformly distributed in color at a given magnitude, as observed.
We estimated the disruption timescale of the clusters using equation (9) in Lamers et al. (2005), which scales as cluster mass to the 0.62 power and as the inverse square root of the ambient density. This latter quantity, which is dominated by the baryonic component at these small radii, we estimate using the Jaffe (1983) model, which provides a good model for elliptical galaxy light profiles. For a mass of M⊙ and an effective radius of 2 kpc, typical of the target galaxies, the ambient density at the effective radius is M⊙ pc-3, and the cluster disruption timescale is Gyr for M⊙ clusters, and Myr for even M⊙ clusters. We would therefore expect that clusters from present-day star formation have not yet disrupted. Moreover, disruption is not instantaneous, and clusters in the process of dissolving may well still appear as point sources at these distances.
To determine the radial extent of the sources, it was necessary to stack all sources to increase the signal-to-noise. A variety of stacks were created spanning different color ranges to ensure that there was no dependence of the radius on color; color had no effect on the determined radii. Stacks were scaled by the inverse of the flux, making all sources weighted equally regardless of magnitude. We used Tiny Tim HST PSF modeling software (Krist et al., 2011) to determine the PSF for WFC3 F225W filter, resulting in a PSF with . The stacked radius was more extended than the PSF, with a . The radius of the stacked sources for the F336W filter was also more extended than the PSF derived using Tiny Tim. While the minimum resolvable radius is 3.4 pc, we determine that the mean cluster radius is 5.0 pc (based on the radius of the F225W cluster stack). This is consistent with the sources being open clusters; for example, the median cluster radius in the Catalogue of Open Cluster Data (COCD; Kharchenko et al., 2005) is 4.3 pc.
4.3. Post-Main Sequence Stars
Post-main sequence stars, such as hot horizontal branch and p-AGB stars, contribute much of the UV light from galaxies (O’Connell, 1999). Typical p-AGB stars detected in M32 and modeled from stellar evolutionary tracks by Brown et al. (2008) are too faint by several magnitudes relative to our data to contaminate our sample. Theoretical considerations also make it unlikely that the sources we detect are old p-AGB stars. The p-AGB evolutionary tracks of Vassiliadis & Wood (1994) have been overlaid on our deepest CMD in Figure 8, where the bolometric correction has been computed assuming a blackbody spectrum. Although the colors of our sources are consistent with being p-AGB stars, the magnitudes are not: only stars with initial masses M⊙ could be bright enough to be the sources we detect, which implies that they would have to belong to a reasonably young ( Gyr) population. Moreover, such massive stars live very short lifetimes as p-AGB stars, as seen by the length between 100 yr tick marks on Figure 8. As these stars spend more time blueward of the main sequence than redward of it, the complete absence of sources blueward of the main sequence is inexplicable if they are p-AGB stars, but is a natural consequence if they are star clusters that evolve redward from locations slightly to the red of the main sequence. Horizontal branch stars are similar in temperature to p-AGB stars, but significantly fainter, and so cannot be the sources we detect.
Helium burning stars on the blue loop are expected to have colors redder than the main sequence, though that number should be low based on the grayscale probability distribution derived from stellar evolutionary tracks, i.e., the blue loops are the regions seen in Figure 3 between at the magnitudes we are detecting. The grayscale probability distribution clearly illustrates that few stars are expected in this region, i.e., only the helium burners on the blue loop would be in these color ranges, and even then they are so short-lived that they would be very unlikely. Also, if these were blue loop stars, many more stars on the main sequence would be expected based on the Hess diagram, i.e., at magnitudes brighter than , we would expect to see 19 times more stars on the main sequence than on the blue loop, though we only detect a few sources on the main sequence while detecting many sources redward of this.
4.4. Point-like Background Galaxies and AGNs
Contamination from point-like background galaxies and AGNs is unavoidable. However, the amount of contamination can easily be estimated by using a blank control field to get an estimate of the colors, magnitudes, and number of sources expected in such a field. In section 2.4 we described eight blank fields observed with WFC3 using the same filters as our observations, which we photometered to derive a background sample. After scaling the total area of the combined blank fields to the area of one WFC3 field, we determined how many background sources would be expected on our CMDs and in what position on the CMD they would be in. We then matched these background sources to the most likely counterpart in our CMDs based on their magnitudes and colors, and then subtracted them to determine what the CMD corrected for background contamination would be. The resulting CMDs of this process can be see in Figure 7, which demonstrates that although a background sample has been removed from the CMD, there are still numerous sources within the CMD that are unaccounted for, in each of our galaxies. Although galaxy clustering can change the magnitude of the background counts, the radial dependence of the source distribution clearly demonstrates that the majority of detected sources are contained in the target galaxy and are therefore not point-like background galaxies or AGNs. An estimate of the variance in the background can be obtained by looking at the field-to-field dispersion in the eight blank fields; the mean number of sources is 11.6, with a standard deviation of 5.8. In contrast, the number of sources detected within the color range of our study in NGC 3379, NGC 4636, NGC 4697, and NGC 4374 are 98, 31, 87, and 41, respectively.
4.5. Surface Brightness Fluctuations
It is important to address the likelihood of false detections due to surface brightness fluctuations (SBFs), which will not only result in an increased number of detections, but can also mimic a radially concentrated population. Models by Worthey (1993) determine the characteristic SBF magnitude in F284W and the optical U band for a variety of old stellar populations. In the case where there is both an extended/blue horizontal branch and a low-mass p-AGB star population contributing to the SBFs, the characteristic SBF magnitude will be the luminosity-weighted mean luminosity of the populations. Using their low-mass p-AGB case as a worst case scenario, , which, when converted to the filters we are interested in, implies . As the deepest limit in our data is -4.5, this corresponds to nearly a fluctuation, which is extremely unlikely, particularly over the WFC3 field of view. We therefore rule out the possibility that these sources are surface brightness fluctuations.
5. Results
As the detected sources are most likely individual main sequence stars and star clusters, we can deduce their individual ages and masses from evolutionary tracks. The properties of our sample of UV-bright sources for each galaxy are presented in Table 2, where the galaxy ID is in column 1, right ascension () and declination () are in columns 2 and 3, apparent F225W and F336W magnitudes are in columns 4 and 5, and color (F225WF336W) is in column 6. The derived cluster ages and masses are also presented in Table 2 in columns 7 and 8. Errors for the cluster properties were determined by Monte Carlo sampling the error ellipse in the CMD around each cluster, and represent the 16th and 84th percentiles of the Monte Carlo distribution (). Because the clusters evolve faster at younger ages, the errors are asymmetric and there is expected to be a net bias in the age and mass determinations. We estimate the effect of this by examining the mean of the Monte Carlo error distribution. We find that the mean age after accounting for the photometric error is Myr older than the input age for clusters younger than Gyr (the method is not well defined for older clusters because the Monte Carlo points run off of the calculated evolutionary tracks), and the recovered mean mass is larger than the input mass by a factor falling from 3 at M⊙ to at M⊙ and is negligible at M⊙. This systematic error should be kept in mind when interpreting the cluster properties.
| Galaxy | F225W | F336W | F225WF336W | Mass | Age | ||
|---|---|---|---|---|---|---|---|
| () | (yr) | ||||||
| NGC 3379 | 10:47:43.078 | +12:35:20.59 | |||||
| 10:47:44.170 | +12:34:42.50 | ||||||
| 10:47:44.325 | +12:34:34.47 | ||||||
| 10:47:44.539 | +12:34:48.99 | ||||||
| 10:47:44.621 | +12:34:21.47 | ||||||
| 10:47:45.475 | +12:35:01.37 |
Note. — Table 2 is published in its entirety in the electronic edition of the Astrophysical Journal. A portion is shown here for guidance regarding its form and content. Sources that lie outside the cluster evolution tracks do not have mass or age listed. Sources where the upper age error lies outside the cluster evolution tracks are listed as lower limits.
Assuming that all star formation results in an extant cluster, we can add together the mass of clusters within a given age range to estimate the star formation rate at that time. Star formation rate as a function of cluster age is shown in Figure 9, where the individual points represent the star formation rate contributed by clusters as a function of mass and the solid line represents the total star formation rate per bin. The cluster age errors are typically Myr for ages Myr, rising to Myr for older clusters. We have therefore adjusted the bin sizes in Figure 9 to be similar to the typical errors. There is ongoing star formation in all four of the observed galaxies, and there is variation between galaxies. As the data get shallower, there is a bias that lower mass clusters are lost first. We have applied a completeness correction, which assumes that the cluster catalog is complete to the mass where the cluster age tracks cross the typical magnitude limit for each galaxy, using a cluster initial mass function that is a power law of slope from to M⊙ 222The total mass has a very mild logarithmic dependence on the upper and lower limits of the mass function, so the choice of these particular values does not introduce a large uncertainty.. As can be seen in Figure 9, applying the completeness correction does not have a dramatic effect on the implied star formation rates, and we are therefore directly constraining the star formation rate with the observed clusters.
The derived SFRs take background contamination into account by subtracting those sources that best match the distribution of the scaled control background field. At ages yr, the colors of star clusters become more sensitive to cluster metallicity than to cluster age — changes of dex in metallicity become enough to move the clusters into different age bins — and therefore the ages of clusters we list as older than this should be considered with care. Similarly, the details of the star formation histories beyond 1 Gyr are very uncertain. As noted above, photometric errors cause a mean overestimate in cluster masses at the low mass end, resulting in a tendency to overestimate the star formation rate contribution by those clusters. However, only for the lowest-age bin in NGC 4636 do the lowest-mass clusters contribute a significant amount to the total estimated star formation, so this should have a minimal effect on the derived star formation rates. The mean age overestimate due to photometric errors is significantly smaller than the size of the age bins, so it should not have a significant effect.
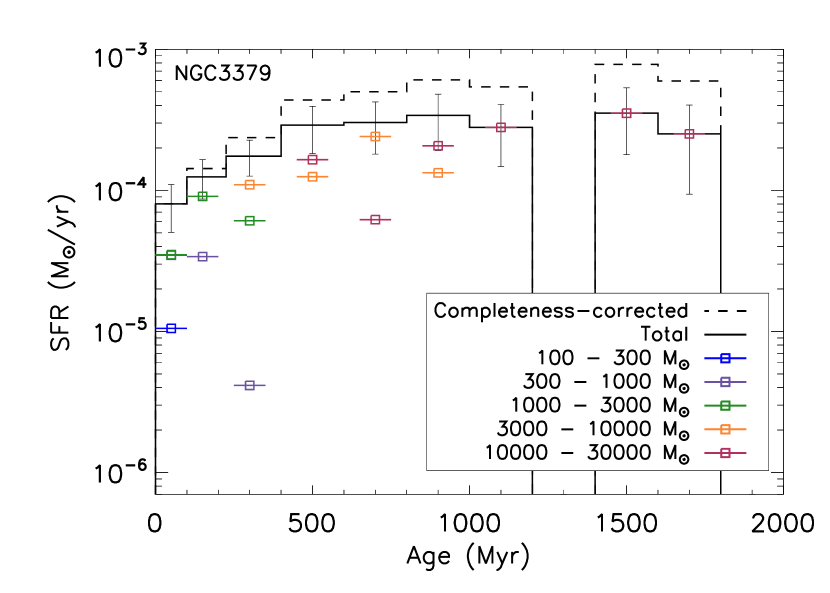
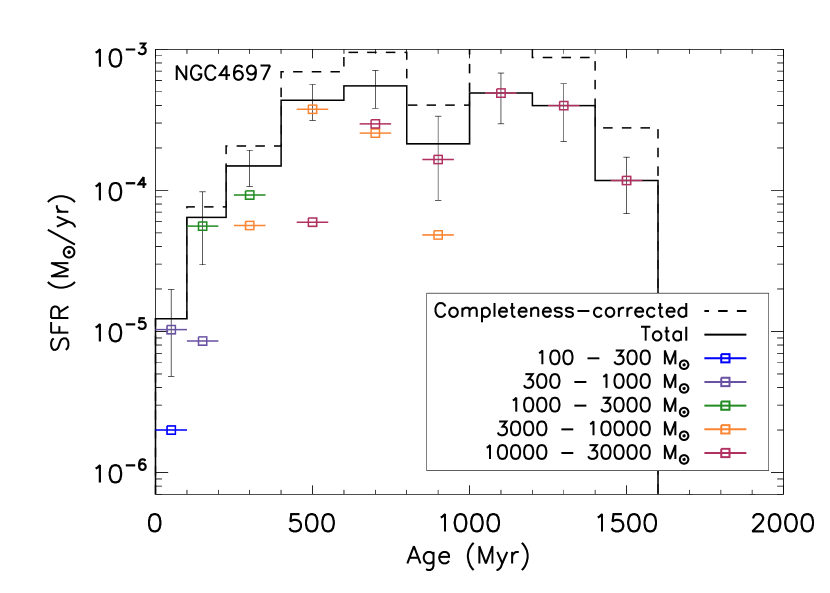
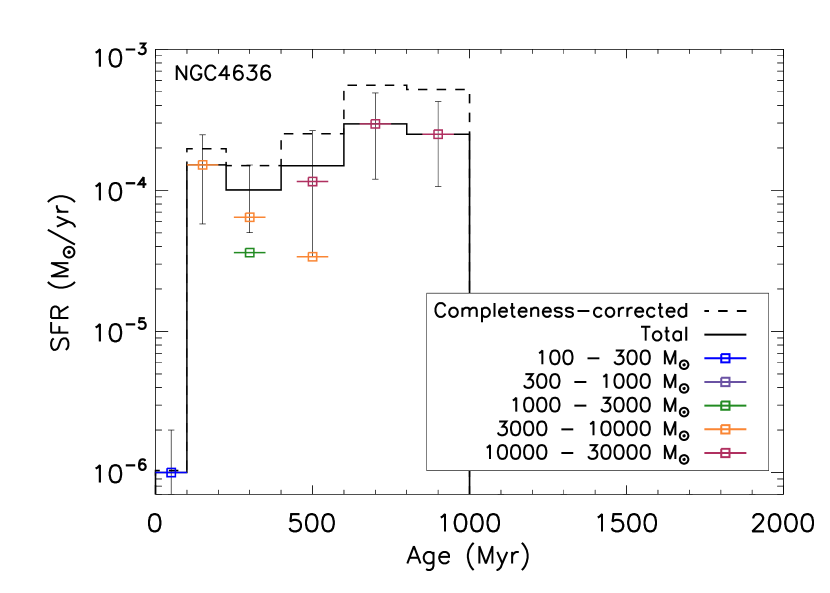
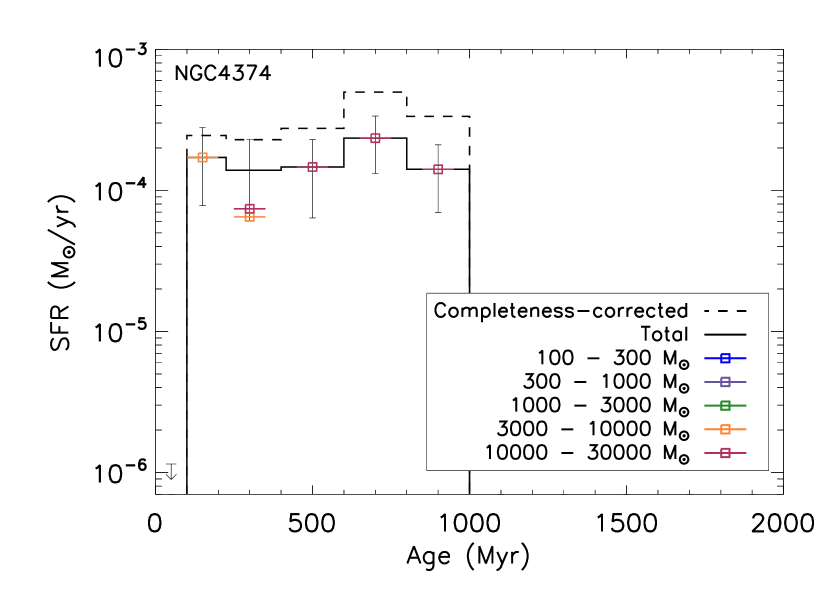
In three of the four galaxies, we detect current star formation at rates that range from M⊙ yr-1 for NGC 4636 to M⊙ yr-1 for NGC 3379 (note that because the completeness is different between galaxies, we quote completeness-corrected values here, although the difference is minimal for the present-day SFR); in NGC 4374, the lack of detected Myr clusters corresponds to an upper limit of M⊙ yr-1. Star formation within the past Gyr is detected in all four galaxies, with average rates somewhat larger, ranging from M⊙ yr-1 for NGC 4374 up to M⊙ yr-1 for NGC 4697. Encouragingly, these numbers are of the same order as the average star formation rates found by Donovan Meyer et al. (2010) for early-type galaxies that had no other evidence for star formation, based on total GALEX NUV emission. It therefore seems likely that the emission they see is the unresolved sum of the sources we detect with HST.
The cluster mass function presents another projection of the cluster data and is shown in Figure 10 for the nearest galaxy in our sample, NGC 3379. The data for the remaining galaxies are too shallow to draw strong conclusions on the mass function, but they are consistent with what is seen in NGC 3379. Because the mass function is complete to different masses at different ages, we have plotted the mass function for clusters in three different age ranges, with the completeness limit shown in each case as the vertical dotted line. The black diagonal line shows a power law of slope for reference.
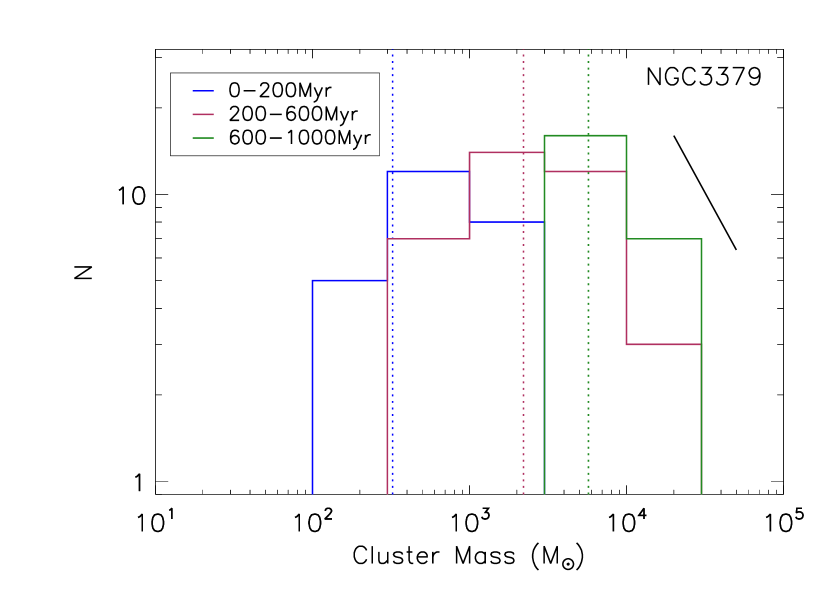
One notable feature in Figures 9 and 10 is the lack of very massive ( M⊙), very young ( Myr) clusters. Such clusters would not be too faint to be detected, and they should not have been disrupted. We can imagine several potential explanations for this, however most are not viable upon further examination. For instance, particularly luminous sources could have diffraction spikes that are artificially broken up by the source finding algorithm; however, the successful detection of more luminous sources at redder colors refutes this explanation. Moreover, visual inspection of those few detections that dolphot removed for being extended revealed all to be truly extended objects rather than diffraction spikes. The systematic age overestimate from photometric errors also cannot be the explanation, as this would be more important for low mass clusters than high mass clusters. Another potential explanation is that there are no high mass clusters at any age and the apparent old high mass clusters are actually blue loop stars. However, as argued in Section 4.3, the lack of observed main sequence stars precludes a large population of blue loop contaminants. Furthermore, such a population would produce a peak in Figure 10 in the M⊙, Myr bin, where no such feature is seen. While it is true that the cluster evolution tracks are based on stellar models that are poorly constrained in the UV, and could potentially be systematically too blue resulting in systematically high age estimates, this also cannot be the explanation because it would require the highest mass stars to be significantly bluer than the lower mass stars.
The most likely explanation is that there is a physical reason why galaxies in this sample have star formation that is not vigorous enough to generate clusters more massive than M⊙. Given that the galaxies are all very red ellipticals, this is entirely possible, particularly as they have current star formation rates that are extremely low even relative to their average over the past Gyr. This is augmented by small number statistics – at these low star formation rates, only one very massive very young cluster per galaxy would be expected.
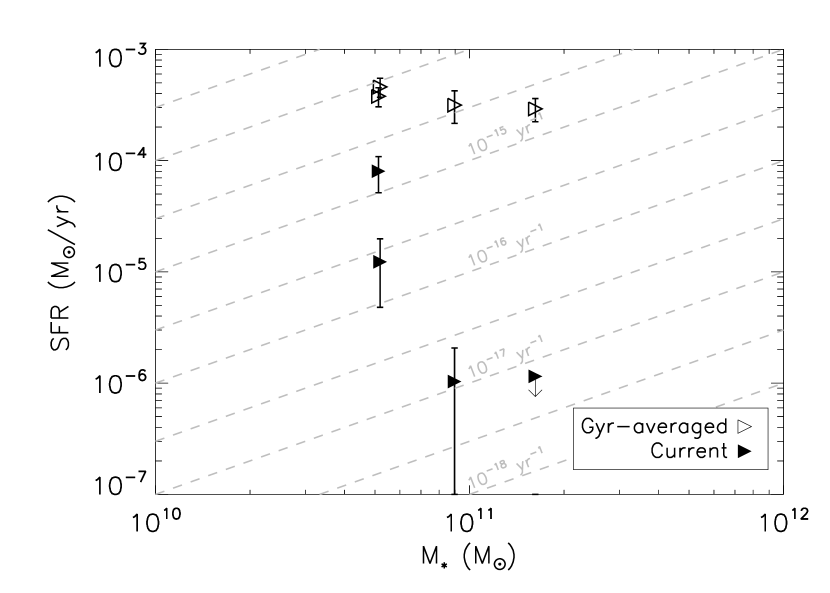
Figure 11 shows how the current and recent star formation of the galaxies vary as a function of their stellar mass, where the stellar masses were calculated from 2MASS LGA (Jarrett et al., 2003) magnitudes and the calibration of Bell & de Jong (2001) using the color from the RC3 magnitudes. The Gyr-averaged SFRs are more or less independent of stellar mass, while the current star formation appears to decline with mass. Lines of constant specific star formation rate (SSFR) are overplotted. The SSFR values range from yr-1 to yr-1 at the present day, and yr-1 to yr-1 averaged over the past Gyr.
6. Discussion
This work presents the first derivation of star formation rates of true “red and dead” ellipticals via direct detection of point sources in the UV using the WFC3 on HST. Our targets have distances ranging from 10.6 Mpc to the Virgo Cluster at 18.4 Mpc, and three were chosen because they demonstrated physical evidence of possibly harboring young stars, in the form of PAH emission, OVI emission, and AGN activity, while the fourth was selected as the control galaxy with no star formation indicator. The detected sources are best explained as being individual star clusters with masses between and M⊙ and ages less than Gyr: they are radially concentrated about the center of each galaxy, ruling out background contamination; they are too bright to be p-AGB stars from the dominant old population and too red as a population to be p-AGB stars from an intermediate-age population; and the absence of a large number of bright main sequence turnoff stars precludes a large enough population of blue loop stars to account for any but a tiny fraction of the observed sources. Our detections of young stars and star clusters in all four of our targeted ellipticals confirms that low-level star formation is ongoing in these “red and dead” galaxies.
All of the observed galaxies have line index ages (Kuntschner et al., 2010; Sánchez-Blázquez et al., 2006; Trager et al., 2000) that are uniformly very old. To estimate whether the very small amount of star formation we detect is consistent with these ages, we compared the total F336W light coming from our detected sources to the total U-band flux from RC3. For NGC 3379, where we go deepest down the young cluster mass function, only of the U-band light within the effective radius is coming from our sources. It is therefore consistent with the old ages determined spectroscopically. A current SFR that is – orders of magnitude larger, which would still be immeasurable by other techniques but is easily ruled out for the galaxies in this sample, would be required to provide enough frosting to begin to contribute enough light at the age-sensitive wavelengths to alter the derived ages. Our data are also consistent with the models of Rogers et al. (2010), which were performed to study the star formation history of NGC 4697 (amongst other ellipticals). Their results show that a simple stellar population model has an equally good fit to the data as their best fit frosting model, meaning that up to of the stellar mass in a younger component can be added without changing the fit. Our derived value is consistent with this result, as the young population we detect makes up a much smaller percentage than this.
The typical star formation rates of these galaxies are M⊙ yr-1. The two closest galaxies, NGC 3379 and NGC 4697, where we have the best measurements of the SFR, both show current SFR at a similar level, despite the presence of PAH emission from one and not the other. The errors are much larger for the more distant galaxies with OVI emission, NGC 4636 and NGC 4374, but they also show consistent results. This perhaps indicates that such emission is a poor tracer of the small-scale minute amounts of cold gas that must be present to form stars.
Comparison to the current stellar mass of the galaxies gives specific star formation rates of at the present day, which implies that stars younger than Myr provide a frosting that consists of of the total stellar mass. The Gyr-averaged specific star formation rate is somewhat higher, , corresponding to of the stellar mass.
There is no obvious structure to the spatial distribution of clusters beyond their general concentration towards the center of each galaxy, or any obvious correlation between the locations of the clusters and any other feature in the galaxy.
The star formation histories of the galaxies reveal a drop in the star formation within the past 300 Myr, particularly in NGC 3379 and NGC 4697 where the data are the deepest and the sources are most obviously physically associated with the galaxy. There are several possible origins for this, such as a contaminant that we have not properly accounted for that pollutes the region of the diagram where older clusters lie, though this explanation is highly unlikely. Another possibility is that the cluster evolution tracks evolve too slowly in this region of the CMD. More sophisticated population synthesis models in the WFC3 UVIS bands would be required to test this hypothesis, which are not presently available. Or perhaps our selection of galaxies, which was not random but specifically targeted old red galaxies with no known star formation, picked out galaxies that are unusual quiescent at the present day. The youngest clusters are the easiest to see, easier than old clusters, but they are completely absent in 2 of the 4 galaxies. One of these galaxies, NGC 4374, hosts an AGN, which may have recently heated the gas and made it unavailable for star formation. This hypothesis can be tested with a larger and more representative sample of elliptical galaxies, which we hope to obtain.
These results provide a key observable for the amount of residual star formation in quenched early-type galaxies. By comparing the rate at which stellar mass transitions across the “green valley” to the stellar mass function of the red and blue galaxy populations, Martin et al. (2007) inferred a quenching timescale on the order of hundreds of Myr. However, because these small levels of star formation have minimal impact on the global galaxy color, the residual star formation had been unconstrained. These results will therefore provide useful input for models that attempt to measure the ages of the stellar populations of galaxies based on their spectral features. In particular, it would be interesting to see whether frosting models such as those of Trager et al. (2000), when using these SFHs, are able to reconcile the apparent discrepancy between the young ages inferred by the spectra compared to the old ages at which the majority of stars must have been formed.
Future work includes a similar study of other nearby ellipticals and also lenticular galaxies, searching for individual UV-bright young stars and open star clusters, to not only place tight constraints on their low-level star formation rates and histories, but to also address the role of environment and galaxy properties on star formation.
References
- Bell & de Jong (2001) Bell, E. F., & de Jong, R. S. 2001, ApJ, 550, 212
- Bregman et al. (2006a) Bregman, J. D., Bregman, J. N., & Temi, P. 2006a, arXiv:astro-ph/0604369
- Bregman et al. (2005) Bregman, J. N., Miller, E. D., Athey, A. E., & Irwin, J. A. 2005, ApJ, 635, 1031
- Bregman et al. (2001) Bregman, J. N., Miller, E. D., & Irwin, J. A. 2001, ApJ, 553, L125
- Bregman et al. (1998) Bregman, J. N., Snider, B. A., Grego, L., & Cox, C. V. 1998, ApJ, 499, 670
- Bregman et al. (2006b) Bregman, J. N., Temi, P., & Bregman, J. D. 2006b, ApJ, 647, 265
- Brown et al. (2000) Brown, T. M., Bowers, C. W., Kimble, R. A., Sweigart, A. V., & Ferguson, H. C. 2000, ApJ, 532, 308
- Brown et al. (2008) Brown, T. M. et al. 2008, ApJ, 682, 319
- Caon et al. (2000) Caon, N., Macchetto, D., & Pastoriza, M. 2000, ApJs, 127, 39
- Chabrier (2003) Chabrier, G. 2003, PASP, 115, 763
- Crockett et al. (2011) Crockett, R. M. et al. 2011, ApJ, 727, 115
- Daddi et al. (2005) Daddi, E. et al. 2005, ApJL, 631, L13
- de Vaucouleurs (1948) de Vaucouleurs, G. 1948, Annales d’Astrophysique, 11, 247
- de Vaucouleurs et al. (1991) de Vaucouleurs, G. et al. 1991, Third Reference Catalogue of Bright Galaxies (Springer-Verlag)
- Deharveng et al. (1997) Deharveng, J., Jedrzejewski, R., Crane, P., Disney, M. J., & Rocca-Volmerange, B. 1997, A&A, 326, 528
- Denicoló et al. (2005) Denicoló, G. et al. 2005, MNRAS, 356, 1440
- di Serego Alighieri et al. (2007) di Serego Alighieri, S. et al. 2007, A&A, 474, 851
- Dirsch et al. (2005) Dirsch, B., Schuberth, Y., & Richtler, T. 2005, A&A, 433, 43
- Dolphin (2000) Dolphin, A. E. 2000, PASP, 112, 1383
- Donovan Meyer et al. (2010) Donovan Meyer, J., van Gorkom, J. H., & Schiminovich, D. 2010, arXiv:1012.2161
- Ferreras & Silk (2000) Ferreras, I., & Silk, J. 2000, ApJ, 541, L37
- Gieles (2009) Gieles, M. 2009, MNRAS, 394, 2113
- Heckman et al. (2004) Heckman, T. M. et al. 2004, ApJ, 613, 109
- Jaffe (1983) Jaffe, W. 1983, MNRAS, 202, 995
- Jarrett et al. (2003) Jarrett, T. H., Chester, T., Cutri, R., Schneider, S. E., & Huchra, J. P. 2003, AJ, 125, 525
- Kaviraj et al. (2007) Kaviraj, S. et al. 2007, ApJS, 173, 619
- Kharchenko et al. (2005) Kharchenko, N. V., Piskunov, A. E., Röser, S., Schilbach, E., & Scholz, R.-D. 2005, A&A, 438, 1163
- Koekemoer et al. (2002) Koekemoer, A. M., Fruchter, A. S., Hook, R. N., & Hack, W. 2002, in The 2002 HST Calibration Workshop : Hubble after the Installation of the ACS and the NICMOS Cooling System, ed. S. Arribas, A. Koekemoer, & B. Whitmore, 337
- Krist et al. (2011) Krist, J. E., Hook, R. N., & Stoehr, F. 2011, in Optical Modeling and Performance Predictions V, Proc. of SPIE Vol. 8127, ed. M. A. Kahan, 81270J
- Kuntschner et al. (2010) Kuntschner, H. et al. 2010, MNRAS, 408, 97
- Labbé et al. (2005) Labbé, I. et al. 2005, ApJL, 624, L81
- Lada & Lada (2003) Lada, C. J., & Lada, E. A. 2003, ARA&A, 41, 57
- Lamers et al. (2005) Lamers, H. J. G. L. M., Gieles, M., & Portegies Zwart, S. F. 2005, A&A, 429, 173
- Lauer et al. (2005) Lauer, T. R. et al. 2005, AJ, 129, 2138
- Martin et al. (2007) Martin, D. C. et al. 2007, ApJS, 173, 342
- Mathews (1990) Mathews, W. G. 1990, ApJ, 354, 468
- Mathews & Brighenti (2003) Mathews, W. G., & Brighenti, F. 2003, ARA&A, 41, 191
- O’Connell (1999) O’Connell, R. W. 1999, ARA&A, 37, 603
- Parriott & Bregman (2008) Parriott, J. R., & Bregman, J. N. 2008, ApJ, 681, 1215
- Pietrinferni et al. (2004) Pietrinferni, A., Cassisi, S., Salaris, M., & Castelli, F. 2004, ApJ, 612, 168
- Roberts et al. (1991) Roberts, M. S., Hogg, D. E., Bregman, J. N., Forman, W. R., & Jones, C. 1991, ApJs, 75, 751
- Rogers et al. (2010) Rogers, B., Ferreras, I., Peletier, R., & Silk, J. 2010, MNRAS, 402, 447
- Sánchez-Blázquez et al. (2006) Sánchez-Blázquez, P., Gorgas, J., Cardiel, N., & González, J. J. 2006, A&A, 457, 809
- Schaller et al. (1992) Schaller, G., Schaerer, D., Meynet, G., & Maeder, A. 1992, A&AS, 96, 269
- Schlegel et al. (1998) Schlegel, D. J., Finkbeiner, D. P., & Davis, M. 1998, ApJ, 500, 525
- Tonry et al. (2001) Tonry, J. L. et al. 2001, ApJ, 546, 681
- Trager et al. (2000) Trager, S. C., Faber, S. M., Worthey, G., & González, J. J. 2000, AJ, 120, 165
- Vassiliadis & Wood (1994) Vassiliadis, E., & Wood, P. R. 1994, ApJS, 92, 125
- Vega et al. (2010) Vega, O. et al. 2010, ApJ, 721, 1090
- Worthey (1993) Worthey, G. 1993, ApJL, 415, L91
- Yi et al. (2005) Yi, S. K., Yoon, S.-J. et al. 2005, ApJ, 619, L111