Electron Number Dependence of Spin Triplet-Singlet Relaxation Time
Abstract
In a GaAs single quantum dot, the relaxation time between spin triplet and singlet states has been measured for the last few even number of electrons. The singlet-triplet energy separation is tuned as a control parameter for the comparison of between different electron numbers. shows a steady decrease from 2-electrons, 4-electrons, to 6-electrons, and we found this implies an enhancement of the spin-orbital coupling strength in a multi-electron quantum dot.
The spin singlet-triplet states of an electron pair in a quantum dot have been demonstrated as potential solid-state qubits Spin-Qubits-Kouwenhoven ; Spin-Qubits-Petta ; Spin-Qubit-Tarucha . Principally, any even number of electrons would form the singlet-triplet configuration. Experimentally, spin blockade effect for a variety of even number of electrons have been observed Spin-Blockade-Multi-Electrons and the coherent manipulation of multi-electron singlet-triplet-based qubits has been recently studied Spin-Qubit-Electrons-APS . A question that naturally arises is whether the multi-electron interaction interferes with the singlet-triplet coherence, such as enhancing relaxing or dephasing.
Here we study the singlet-triplet relaxation time in a single quantum dot for different even number of electrons. Since strongly depends on the singlet-triplet energy separation , we control by tuning the quantum dot shape with confinement gates. For a given electron number, is measured with the pump-and probe technique T1-Pump-and-Probe in a tunable range of . shows large decrease (roughly 3 times) when the electron number increases from to . An increase in the spin-orbit coupling strength with larger electron number is found to explain the observed decrease in .
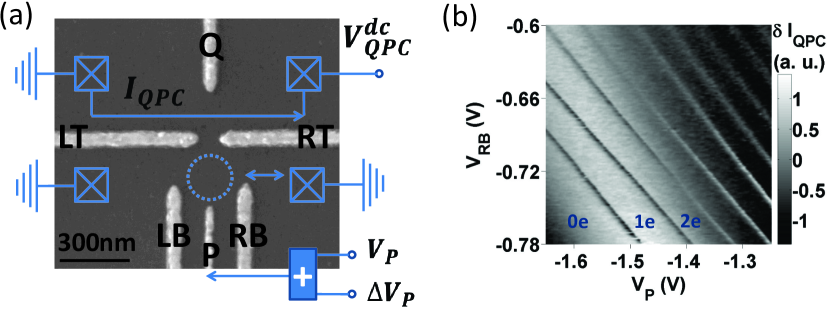
Fig. 1(a) shows a scanning electron microscopy (SEM) image of the gate-defined single GaAs quantum dot. The left barrier of the dot is closed and the electrons only tunnel through the right barrier. The dc current through the quantum point contact (QPC) is recorded to count the charge number on the dot. A gap between the QPC and the dot is created to maximize the charge counting sensitivity. In this experiment the gap is closed tightly and the QPC dc bias voltage is small to minimize the back-action effect Backaction-Kouwenhoven ; Ming-Backaction-RTS . Fig. 1(b) shows the charge stability diagram measured by the QPC while gate and are biased at dc voltages. We will measure of the spin singlet-triplet states for , , and , respectively.
As shown in Fig. 2(a), a sequence of square-wave voltage pulses is applied on the plunger gate to explore the energy spectroscopy of the quantum dot by pumping the electrons to excited states Spectroscopy-Two-Pulse . The gray-scale plot shows the QPC response averaged over many duty cycles with a lock-in amplifier, in the 1e 2e transition region. During each duty cycle, the low-level pulse and high-level pulse bring the QD electrons into the spin ground state twice, and correspondingly produce two charge transition lines, denoted as and . When the pulse amplitude is large enough, the high-level pulse pumps the electrons into the spin excited state as well. In fact, we see an additional line denoted as between and when 12.3 mV. Using the energy-voltage conversion factor 0.07 meV/mV, we determined as 0.86 meV in this example.
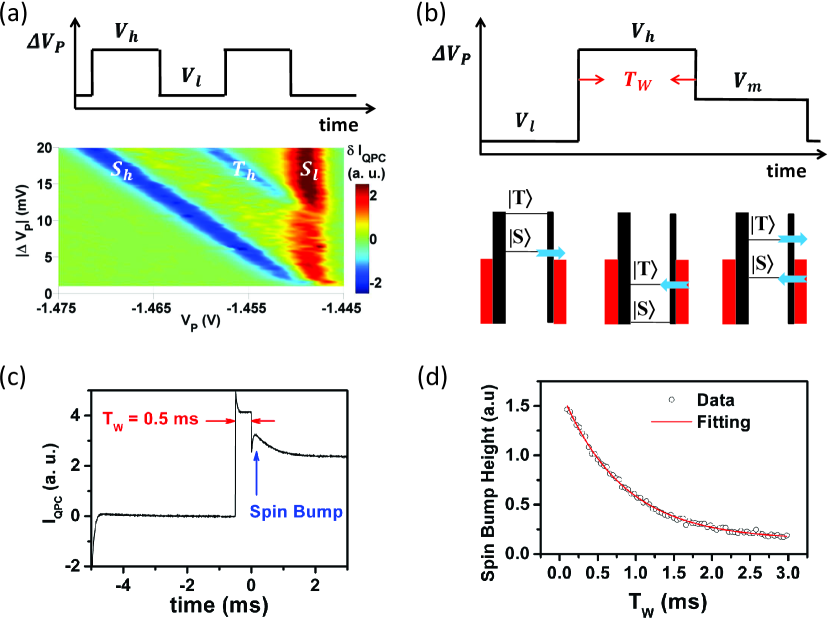
In order to detect the relaxation process from to , we applied a sequence of three-step pulses T1-Pump-and-Probe ; T1-Three-Pulse , as illustrated in Fig. 2(b). At the low voltage level , the energy of both and lie above the Fermi level of the electron reservoir. This resets the quantum dot by emptying out the state. Then at the high voltage level , the energy of both and drop below . Therefore the electrons are pumped into the spin excited state with a certain probability. sustains for a waiting time , during which period relaxes to . Finally at the medium voltage level , is brought between the energy of and . If the electrons have already relaxed into , no electron jumping will occur in such an energy configuration. On the other hand, if the relaxation has not completed and the electrons still have a probability of occupying state , one electron will jump out of the dot and another electron will jump in to fill state . As a consequence, the QPC current shows a ”up” and ”down” switching. So the occurrence probability of the QPC current switching at the level, as a function of , can tell us the speed of the relaxation process.
Repeating the above process many times, the ”up” and ”down” switchings of the QPC current at the level average out as Gaussian distributions, called a ”spin bump”. The dependence of the spin bump height on contains the information of . Fig. 2(c) shows a typical trace of the gate-averaged QPC current recorded by a high-bandwidth oscilloscope. The spin bump occurs when the pulse time is from 0 ms to 3 ms. We increase the waiting time and see that the spin bump height rapidly decays. Fig. 2(d) shows the extracted dependence of the spin bump height on , which can be described by an exponential decay with a rate . The fitting in Fig. 2(d) gives ms.
It is well known that strongly depends on the energy splitting , because of the energy dependence of the phonon emission rate and the electron-phonon interaction T1-Phonons-DLoss ; T1-EST-B-Vt-Delft ; T1-ST-Mso ; T1-Quantitative-Model . keeps increasing when we sweep down to squeeze the electron number from 6 to 2, because the dot size shrinks and the exchange interaction energy increases. During this process, a longer is observed for a smaller electron number. But in this situation we can not tell if the change in comes from the difference in or in the electron number. A meaningful comparison can only be made at the same value of while the electron number is varied.
The control experiment on can be done with tuning some of the confinement gates, mainly gate LB. When increasing (and slightly compensating ), we found that continuously decreases, as shown in Fig. 3(a) for the case of . This control on is most likely fulfilled by changing the quantum dot shape T1-EST-B-Vt-Delft ; Zeeman-Vshape-Kastner . A more positive voltage on gate LB pulls the electron wave functions on one side of the dot and makes the dot less circular. This gives rise to smaller . In this experiment, we can tune from 0.93 to 0.75 meV for 2e by increasing over 460 mV.
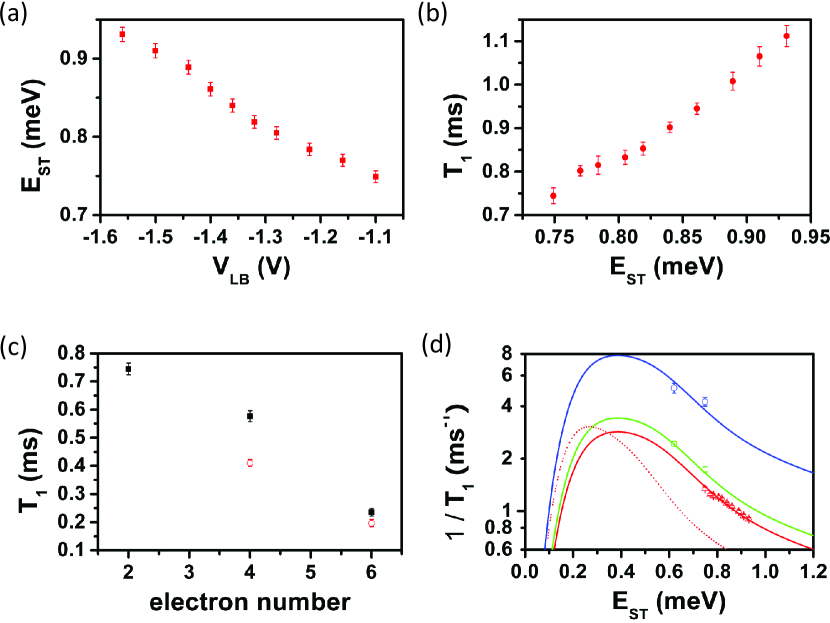
When goes up, monotonically increases, as can be seen in Fig. 3(b) for . For and , we also observed a monotonically increase of with . However it becomes more and more difficult to collect enough data points for larger electron numbers. When is the same, for and is usually about one half of for . It is therefore not easy for to reach the same magnitude for different electron numbers. An exhaust tuning of one confinement gate at relatively large dot size turns out to result in double or multiple dots. Nonetheless, we managed to bring up for and to reach the lower limit of for . In Fig. 3(c) we present for , , and for two fixed values of , 0.75 meV and 0.62 meV, respectively. We see that at each fixed value of , substantially decreases with increasing electron number. For example, when = 0.75 meV, drops from 0.75 ms for to only 0.23 ms for , which is a change of more than 3 times.
To quantitatively evaluate the change in , we use the simplified model T1-EST-B-Vt-Delft ; T1-Quantitative-Model :
Here the first integral comes from the deformation potential electron-phonon coupling and is nonzero only for the longitudinal phonons. The second integral is from the piezoelectric coupling and contains contributions from both the longitudinal and transverse phonons. The piezoelectric constants are as following: , , and . The coupling strength for the deformation potential and piezoelectric interactions is = 6.7 eV and eV/m, respectively T1-Phonons-DLoss ; T1-EST-B-Vt-Delft . The mass density is 5300 kg/m3, and the sound speed for the longitudinal and transverse phonons is = 4730 m/s and = 3350 m/s, respectively T1-EST-B-Vt-Delft .
The dot radius is estimated as about 16 nm using transport experiments. The characteristic energy, where the phonon wavelength matches the dot size and the relaxation rate reaches a maximum, is therefore 0.19 or 0.14 meV. This is much smaller than the energy range in our experiment, and we see from Fig. 3(d) that our data points lie to the right side of the peak points in the simulated curves.
The spin-orbit strength is an independent factor in our simulation. A value 0.33 eV gives a good match to our data for , shown as the red curve and red symbols in Fig. 3(d). This is consistent with the reported 0.37 eV in the literature T1-EST-B-Vt-Delft . also shows a dependence on the electron number. The green (blue) curve in Fig. 3(d) tells us that for 4e (6e) is 0.36 (0.55) eV, which is about 1.1 (1.7) times of for 2e. These changes result in measurable increase in the relaxation rate due to its quadratic dependence on . The dot radius may also increase with larger electron number. In Fig. 3(d) the red dotted curve is the predicted for with larger (20 nm) and same (0.33 eV) as the red solid curve. The peak position shifts to the left and the magnitude decreases on the right side of the peak. So the enlargement of dot size seems unable to explain the observed increase of .
It has been pointed out that the Coulomb interaction between electrons has large influence on a number of factors in the singlet-triplet relaxation process, and most likely induces stronger spin to charge coupling T1-ST-Mso . So the multi-electron Coulomb interaction may be responsible for the enhancement of the spin-orbit coupling strength in a multi-electron quantum dot. The inclusion of more orbital states could possibly strengthen the spin-orbital coupling too.
In conclusion, we studied the relaxation time of spin singlet-triplet states for the last few even electron numbers. With increasing electron number, even only from 2 to 6, was found to substantially decrease, possibly due to the enhanced spin-orbital coupling strength. Therefore the exact electron number may be a matter when we choose a singlet-triplet as the basis of a qubit.
This work was supported by the NFRP 2011CBA00200 and 2011CB921200, and NNSF 10934006, 11074243, 11174267, 91121014, and 60921091.
References
- (1) J. M. Elzerman, R. Hanson, L. H. Willems van Beveren, B. Witkamp, L. M. K. Vandersypen, and L. P. Kouwenhoven, Nature 430, 432 (2004).
- (2) J. R. Petta, A. C. Johnson, J. M. Taylor, E. A. Laird, A. Yacoby, M. D. Lukin, C. M. Marcus, M. P. Hanson, and A. C. Gossard, Science 309, 2180 (2005).
- (3) Yasuhiro Tokura, Wilfred G. van der Wiel, Toshiaki Obata, and Seigo Tarucha, Phys. Rev. Lett. 96, 047202 (2006).
- (4) A. C. Johnson, J. R. Petta, C. M. Marcus, M. P. Hanson and A. C. Gossard, Phys. Rev. B 72, 165308 (2005).
- (5) A. P. Higginbotham, F. Kuemmeth, C. Barthel, C. M. Marcus, M. P. Hanson, and A. C. Gossard, APS March Meeting, Session L29 (2012).
- (6) S. Tarucha, K. Ono, T. Fujisawa, W. G. van der Wiel, and L. P. Kouwenhoven, ”Interactions, Spins and the Kondo Effect in Quantum-Dot Systems” in ”Electron Transport in Quantum Dots”, Edited by J. P. Bird, Springer (2003).
- (7) Ramón Aguado and Leo P. Kouwenhoven, Phys. Rev. Lett. 84, 1986 (2000).
- (8) H. O. Li, M. Xiao, G. Cao, C. Zhou, R. N. Shang, T. Tu, G. C. Guo, G. P. Guo, and H. W. Jiang, Appl. Phys. Lett. 100, 092112 (2012).
- (9) J. M. Elzerman, R. Hanson, L. H. Willems van Beveren, L. M. K. Vandersypen, and L. P. Kouwenhoven, Appl. Phys. Lett. 84, 4617 (2004).
- (10) S. Sasaki, T. Fujisawa, T. Hayashi, and Y. Hirayama, Phys. Rev. Lett. 95, 056803 (2005).
- (11) V. N. Golovach, A.V. Khaetskii, and D. Loss, Phys. Rev. Lett. 93, 016601 (2004).
- (12) T. Meunier, I. T. Vink, L. H. Willems van Beveren, K-J. Tielrooij, R. Hanson, F. H. L. Koppens, H. P. Tranitz, W. Wegscheider, L. P. Kouwenhoven, and L. M. K. Vandersypen, Phys. Rev. Lett. 98, 126601 (2007).
- (13) V. N. Golovach, A.V. Khaetskii, and D. Loss, Phys. Rev. B 77, 045328 (2008).
- (14) J. P. Hansen, S. A. Sorngard, M. Forre, and E. Rasanen, Phys. Rev. B 85, 035326 (2012).
- (15) S. Amasha, K. MacLean, Iuliana P. Radu, D. M. Zumbuhl, M. A. Kastner, M. P. Hanson, and A. C. Gossard, Phys. Rev. Lett. 100, 046803 (2008).