Simulation of descending multiple supra–arcade
reconnection outflows in solar flares
Abstract
After recent AIA observations by Savage, McKenzie and Reeves we revisit the scenario proposed by us in previous papers. We have shown that sunward, generally dark plasma features originated above posteruption flare arcades are consistent with a scenario where plasma voids (which we identify as supra–arcade reconnection outflows, SAROs) generate the bouncing and interfering of shocks and expansion waves upstream of an initial localized deposition of energy which is collimated in the magnetic field direction. In this paper we analyze the multiple production and interaction of SAROs and their individual structure that make them relatively stable features while moving. We compare our results with observations and with the scenarios proposed by other authors.
1 Introduction
Sunward dark moving trails with origin []Mm above posteruption flare arcades and decelerating speed in the range km s-1 were first detected with the Yohkoh Soft X–ray Telescope (SXT). Since then, they have been extensively reported using other instruments such as TRACE (Innes et al., 2003a, ; Innes et al., 2003b, ), SOHO/SUMER (Innes et al., 2003b, ) and SDO/AIA (Savage et al.,, 2012), (Warren et al.,, 2011). The lack of X–ray and extreme–ultraviolet (EUV) signatures in images and spectra has lead to consensus that these downward moving structures are likely voided flows generated by reconnection processes in a current sheet above the flare arcade. Besides the dark moving structures, bright supra–arcade downflowing features have also been reported during flares (McKenzie,, 2000).
McKenzie and Savage, (2009), Savage and McKenzie, (2011) suggested that supra–arcade downflows (SADs) are the cross–sections of thin and empty flux tubes retracting from a reconnection site high in the corona. According to these authors, the high enough inner magnetic pressure could be the reason the voids are able to resist being filled in immediately by the surrounding denser plasma. Linton et al., (2009) proposed a scenario where the dynamic of retracting magnetic fields is triggered by a localized reconnection event that produces up and down flowing reconnected flux tubes, which are slowed down by underlying magnetic arcade loops. The observed SAD speeds are lower than expected for reconnection outflows in regions of typically assumed Alfvén speeds of km s-1. Linton et al., (2009) suggested that drag forces could work against the reconnection outflow.
Verwichte et al., (2005) analyzed TRACE downflow oscillations transverse to the magnetic field. They found that the initial speeds and the displacement amplitudes, of kink–like type in the observational dark lanes of variable sizes (between []Mm), decrease as they propagate downwards, while the period remains fairly constant with height.
Recently, after AIA observations with high resolution and cadence, Savage et al., (2012) re–interpreted SADs as wakes created by the retraction of thin loops (SADLs) instead of the previous interpretation as flux tube cross–sections. SADLs are features of sizes []Mm observed during the early phase of the eruptive event and SADs as features of sizes Mm that become apparent afterwards, in contrast to bright, high–temperature plasma associated with current sheets. They proposed that deceleration is expected due to the buildup of downstream magnetic pressure and/or drag mechanisms.
In Costa et al., (2009), Schulz et al., (2010) and Maglione et al., (2011) (hereafter Paper 1–3, respectively) we showed, by means of 1 and 2D MHD simulations, that the dark tracks are consistent with plasma voids generated by the bouncing and interfering of shocks and expansion waves upstream of the initial localized deposition of energy. The composition of both, a resulting sunward directed hydrodynamic shock pattern and a perpendicular magnetic shock, produce an overall transversely shaking void that propagates towards the surface of the sun, resembling the kink–like mode described in Verwichte et al., (2005). Contrary to the 1D results –where the sunwards dynamic is independent of the magnetic field intensity owing to its exclusive waveguide role– in the 2D simulation the sunwards speed is higher for higher values of the magnetic field. This can be interpreted as the capability of the low coronal plasma to collimate the deposition of energy in the magnetic field direction.
As the obtained values were larger than those outside the voided cavity (see Fig. 2 of Paper 2), with the contour in total pressure equilibrium, we concluded that the internal magnetic pressure cannot be responsible of preventing the collapse of the vacuum zone. Instead, we found that the higher values of inside the dark lanes are due to hotter plasma –with low inner values of density ( cm-3)– concentrated in regions of MK (Warren et al.,, 1999). Actual observations do not show significant emission values of the voided plasma in any of the instrumental wavelengths (e.g., high–temperature AIA bandpasses). Hence, the observations could be consistent with these plasma parameters.
According to Savage et al., (2012) shrinking loops or SADLs are always leading SAD features. Both SADs and SADLs are interpreted as the outflows created during the re–organization of the magnetic field during the reconnection process. However, descending SADs are only seen trailing loops once the current sheet has become noticeably filled with plasma. In this paper, in light of the new AIA observations we revisit the scenario proposed in Papers 1–3. We simply reinterpret our previous 1D and 2D resulting voided features as supra–arcade reconnection outflows (SAROs) to differentiate them from the SAD description as stated by Savage et al., (2012). In our 2D model we are not simulating the arcade loops nor the possible interaction of the SAROs with the loops, and will come back to the SAD and SADL features later. Hence, reconnection is modelled as a pressure pulse representing the energy deposition that triggers the phenomenon that creates the dark track which we call SAROs.
With the aim of testing the scopes of our model, we first focus on reproducing the dynamic and oscillating interaction between several of these SARO voided structures. In Paper 1–3 we found that to reproduce the oscillating pattern we required closed boundary conditions. However, in Paper 2 we found that the oscillating pattern was robust under a broad variation of the boundary conditions –contemplating different density values at the extremes and allowing total or partial boundary rebounds. Thus, the question arises about the role played by the boundary conditions. The observations show that the outflows sustain their individual configuration all the way down into the arcade structure. Thus, the simulation of multiple outflows triggered by different pressure pulses must maintain these individualities while they evolve decelerating sunwardly. However, can we consider the dynamic of a multiple outflow structure as the superposition of individual ones (as described in Paper 1–3)? If this is the case, what produces the wavy features described in Verwichte et al., (2005)?
2 Numerical code and initial conditions
We carried out the 2D-MHD simulations with the Mezcal code, which has been extensively tested in several scenarios (see for instance De Colle and Raga, (2006) or De Colle et al., (2008)). All calculations were performed with a numerical grid of grid–points and a physical size of Mm, corresponding to a resolution of km. The coordinate represents the sunwards direction and the coordinate the transverse to the magnetic field one. We assumed a constant radial initial magnetic field structure, and typical background temperature of K. Simultaneous (sec) spherical pulses ( is the triggering pressure pulse and is the background gas pressure of the corona) of a radius Mm were localized in positions and corresponding to Mm, Mm and Mm, respectively.
Several simulations were carried out, varying the magnetic field, and the density . Also, we added a localized deposition of energy -modeled as a new triggering pressure pulse, - resembling a new reconnection event (at sec) occurring in the scenario modified by the later ones. Table 1 shows the models that we use to discuss our results. We employed open and closed conditions for the lateral boundaries, whereas, initially, only a fix rebound condition was used at the upper radial direction, to simulate the outflows resembling the action of the reconnection site, and transmission condition for the bottom boundary, assuming that the perturbations are absorbed in the sunwards direction. Finally, we also used open boundary conditions for the upper radial direction with a non–homogeneous initial background density (, , in Mm) to emulates the passage of previous SARO structures and to explore other plasma configurations. The characteristic boundary parameters were chosen in accordance with typical observed dark lane structures, as in Verwichte et al., (2005) and McKenzie and Hudson, (1999).
| Model | |||
|---|---|---|---|
3 Results and Discussion
3.1 SAROs plasma parameters
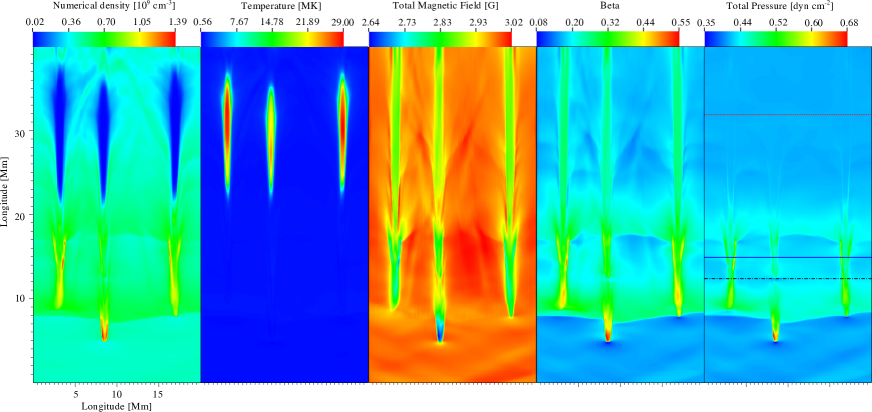
Figure 1 shows, the evolution of the three voided outflows at sec, it simulates, respectively, the voided density tracks left by three simultaneous reconnection bursts, the temperature, the magnetic field, the –parameter and the total pressure for open boundary conditions. From Fig. 1a we see that, as expected (e.g. McKenzie and Hudson,, 1999) the vacuum density values are less than the environment ones in more than one order of magnitude (see the features above Mm); the temperature (Fig. 1b) is more than one order of magnitude higher in the voided cavities than outside (as in Longcope et al., (2009) and Warren et al., (1999)); the inner magnetic field is lower than its external value (G) (Fig. 1c), thus, the inner magnetic pressure cannot be responsible for preventing the collapse of the vacuum zone. The –parameter (Fig. 1d) is larger inside than outside. Furthermore, from the upper part of Fig. 1e we can see that the total pressure of the region is almost constant, i.e., the features that characterize the vacuum outflows have disappeared, meaning that the contour of the lanes are, on average, in total pressure equilibrium, as in Paper 3.
The Fig. 1 features are consistent with the dynamical features described by Verwichte et al., (2005) except for the lack of oscillations in the 2D pattern and the homogeneity of the background medium. The multiple outflow dynamics reproduces the individual dynamic; i.e., in accordance with observational data, the temporal evolution analysis gave us decelerating speeds of the order of km s The freezing–in of the plasma to the magnetic field induces the collimation of most of the kinetic energy towards the longitudinal direction, which is enhanced with the increase of the magnetic field. In accordance with Paper 3 (see Table 1 of the paper) –where we obtained a slow increase in the initial speed with the increase of the background magnetic field– for a run of sec, varying the magnetic field from G to G (models and ) the distance evacuated by the perturbation increases Mm; while varying the background numerical density from cm-3 to cm-3 (models and ) the distance evacuated by the perturbation diminishes in Mm.
At the initial stages of the flare event, before the formation of fan rays, the supra–arcade zone can be assumed as an almost homogeneous medium. Figure 1 intends to describe the initial dynamic of SAROs that descend from an apparent homogeneous background medium towards the arcades. Different background density give dynamical results consistent with the parameter range variations described by Verwichte et al., (2005). Thus, in the scenario proposed, the SARO dynamics of several events is sustained by the interaction of localized (confined to the individual dark tracks) nonlinear waves and shocks acting in times comparable to the observations (see Paper 3).
In the bottom region of Fig. 1, e.g., Mm, we note an increase of the density (Fig. 1a), the –parameter (Fig. 1d) and the total pressure (Fig. 1e) with respect to their corresponding background values; correspondingly we note a decrease of the magnetic field (Fig. 1c). These bottom overdense features can be associated with the bright downward features described by McKenzie, (2000). In our scenario, they are shock fronts that open the way towards the sun surface. They modify the background medium producing, among other effects, a mass pile up in front of the flow. A future 3D simulation could help to understand the relation and interaction of these reconnection outflows with the observational bright leading loops.
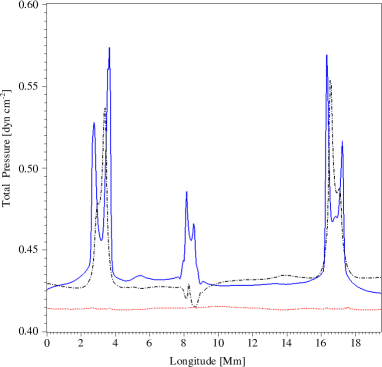
The multiple shock dynamic structures produce temporal patterns which are reminiscent of observational constrictions (Innes et al., 2003a, ), (Innes et al., 2003b, ), see the knots in the SARO traces of Fig. 1. Figure 2 shows the total pressure at the heights indicated with cuts in Fig. 1e: Mm, Mm and Mm. Note that the total pressure is fairly constant in the upper region, near the triggering site at Mm (dotted line). At Mm, (solid line) the total pressure is higher inside the tracks. The constrictions or knots (e.g see the second outflow trace at Mm, dashed–dotted line) correspond to regions of total internal pressure lower than the outside values.
As shown in Fig. 1, in accordance with what is expected from observations, it appears that the SARO lanes are not distorted by the fact that they are multiple. There is not an appreciable evidence of the interaction between outflows. Savage et al., (2012), in the frame of the scenario proposed by Linton et al., (2009), interpreted the discreteness of outflows as an indication that the reconnection is highly localized. In our scenario, as in the one proposed by Linton et al., (2009), the production of plasma outflows is associated with reconnection bursts, but we do not assume a 2D configuration nor a particular magnetic topology of the current sheet (Priest and Démoulin,, 1995). The scenario proposed by Linton et al., (2009) relates inherently the plasma voids to reconnections that occur within the current sheet. In our case reconnection is not modeled but simulated as a pressure pulse that triggers the outflow production in an initially homogeneous media. Thus, we can still be concerned about the extent of the independent behavior between different outflows.
3.2 Structure and wavy appearance
An indication of the interaction between SAROs seems to be the wavy appearance that can be seen in some observations, e.g. Verwichte et al., (2005). There is an important difference between 1D and 2D simulations in relation with the ability to generate the wavy appearance of the reconnection outflows. In Papers 1-2 (1D simulations) these features are simply obtained due to lateral rebounds that emulate a neighbor denser medium (see Fig. 2 and Fig. 1 of Paper 1 and 2 respectively). The oscillatory pattern is sustained over time and the wave structure does not lose energy. In Paper 3 (2D), the wavy appearance of a lateral cut is damped in few periods (see Fig. 1a of that paper), but if we focus in the 2D slides (see Fig. 2 of Paper 3) it is not possible to recognize the wavy character. It seems that the spatial distribution of energy of the 2D lateral rebounds (with closed boundary conditions) leads to a rapid damping of the oscillations and would not give account of the wavy appearance of the observations.
Meanwhile, comparing the evolution of nonlinear waves produced by a triggering pressure pulse in the 1D and 2D cases we recognize a similar dynamic behavior that prevails during time and could explain the robustness of the voided patterns. Figure 3a shows the spontaneous 1D non–dimensional density evolution due to the action of a pressure pulse over a medium with static initial condition (Fernández et al.,, 2009). In Figure 3b the triggering pulse is asymmetrically located, as in our runs.
A detailed description of the evolution of the voided features can be obtained from these figures and from the wave analysis provided by the numerical techniques used. Figure 3a displays nondimensional time step numbers and Time step corresponds to In the figure we see two shock wave fronts for each time step, e.g., for step the shocks are located at Mm. Also, for the same time step two contact discontinuities are found at Mm and two expansion waves are found starting at Mm. Initially two shock fronts moving away from the triggering pressure pulse location are formed (see e.g. time step in Fig. 3a and Fig. 3b). As the shocks travel along the magnetic field direction, the temperature and the density are increased making the energy rise, e.g. Mm in time step of Fig. 3a. The density is abruptly diminished (e.g. Mm in time step ) by contact discontinuities that go behind the shocks and can be recognized because the pressure and the velocity of the flow are not changed while the waves pass. The temperature increases to maintain a constant pressure across the contact discontinuities. Also, two expansion waves –that are recognized because they diminish the density while they pass– are initially produced and travel towards the triggering position, contrary to the shock fronts (e.g. Mm at time step in Fig. 3a). These waves collide, rebound at the triggering location (see Fig. 3a–b, center part for time steps ), and then travel in the opposite direction towards the contact discontinuities (e.g. Mm of time step in Fig. 3a). From the comparison of time step and time step we see that the expansion waves have a larger speed than the contact discontinuity. At time step the position of the shock fronts in Fig. 3a are ()Mm, the expansion waves have interacted with the contact discontinuities and lowered the density and pressure leaving behind a coupled nonlinear system of waves, e.g., the ranges Mm in Fig. 3a and Mm in Fig. 3b. As a result of this dynamic a central voided cavity is formed.
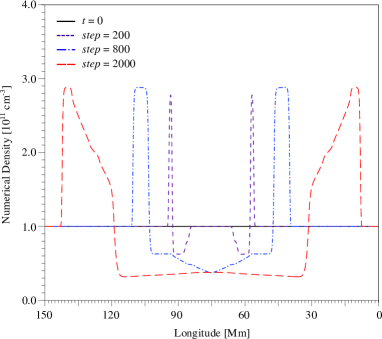
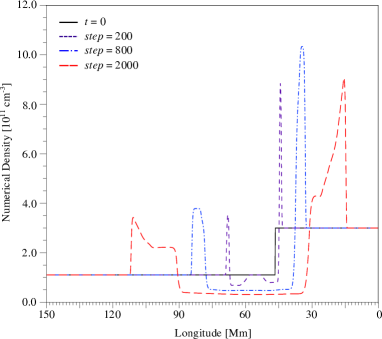
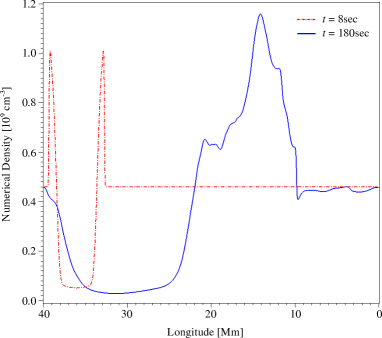
Figure 3c, shows a 2D density cut taken along the SARO located at Mm in Fig. 1a. The similarity between Fig. 3a–b and Fig. 3c (compare sec in Fig. 3c with time step in Fig. 3a–b and sec in Fig. 3c with time step in Fig. 3a–b) expresses the likeness between the dynamic behavior of the 1D and 2D descriptions. There are, however, small differences in the shape of Fig. 3c at sec from the ones in Fig. 3a–b, time step Comparing the features ranging from Mm in Fig. 3c with the corresponding features in Fig. 3a–b, we note than even when the patterns are similar the more irregular shape in Fig. 3c can be attributed to perturbations produced by the other SAROs.
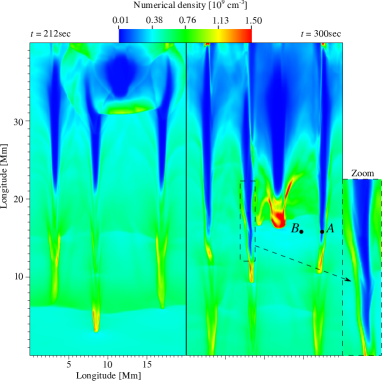
However, we found cases where the interaction between SAROs is evident and has the observational consequence that it reproduces the wavy character registered by Verwichte et al., (2005). Figure 5a-b shows the SARO evolution for after a new pressure pulse, triggered at sec, has developed a wavefront over the discrete tracks left by the three initial SAROs that have traveled decelerating a distance of Mm (Fig. 5a). In the upper part of Fig. 5b at sec it appears that the initial SAROs have lost their discreteness. We have stated that when the magnetic field is uniform the energy produced by the pressure pulse is distributed in a non–homogeneous way due to the collimation generated by the magnetic field. While the SAROs propagate further a new trace left by the new burst can be seen sunwards (Fig. 5b). Also, the new reconnection pulse injects energy most of which is distributed in a non–uniform way between the wakes left by the previous SAROs i.e., the initially spherical pressure pulse (Fig. 5a) at sec is later collimated by the magnetic field configuration at sec (Fig. 5b). As in the other cases, the sunward elongation of the fourth lane is due to the interaction of upper rebounds and downward absorptions along the magnetic field that collimates the flow.
A remarkable effect which has observational implications is the distribution of kinetic energy. As can be seen from Fig. 5a, part of the new SARO kinetic energy is distributed along the wakes left by the previous SAROs. In accordance with the observations, when the sequence is seen as a movie the wakes exhibit a wavy motion (e.g. (Verwichte et al.,, 2005), (McKenzie,, 2000), (Khan et al.,, 2007)). This can be explained due to the tendency of the wavefront energy to deviate into lower density regions, i.e., the wakes left by the previous SAROs. The continuity Rankine–Hugoniot relation for hydrodynamic shocks, i.e., the shock in the longitudinal direction (Paper 1–3), and in the shock wave frame is
Initially, the energy of the pressure pulse is almost spherically distributed due to its larger pressure value with respect to the ambient one (Fig. 5a), so we can consider that and are almost the same all around the spherical boundary of the initial shock front. However, the corresponding upstream values will be different depending on the previous SARO distribution, i.e., is almost an order of magnitude lower in the wakes left by the previous SAROs. Thus, initially the upstream flow speed will be larger in the SARO wakes than in the neighbor ambient. Moreover, the previous SAROs have larger values of the flow speed than the ambient one and its value will be added to the upstream speed. This implies that two upstream shock front positions with initial values and thus will continue their motion with while the shock wave travels. Obviously, the same relation stands for the kinetic energy, i.e. ( the kinetic energy). Upstream, this relation is preserved as can be appreciated in Fig. 5a. Compare the kinetic energy of and in this figure with their corresponding densities () in Fig. 5b. Note the correspondence between the low–high density values in positions and in Fig. 5a with respect to the high–low kinetic energy values in the same positions in Fig. 5b. The energy of the fourth reconnection event is partly deviated from the new wake into the previous ones depending on the background plasma parameter. Figure 5b shows the kinetic density energy for at sec. When the magnetic field intensity is increased (or the intensity of the pressure pulse is diminished, model ) the wavy character is lost.

3.3 A possible SAD configuration
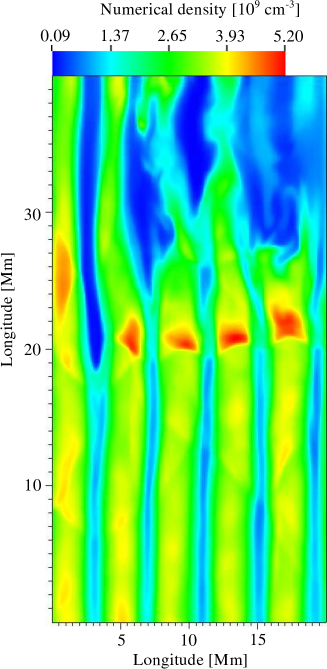
We performed a new simulation with a non–homogeneous background that emulates the modification of the medium due to the action of several evolved SAROs. The previously simulated thin dark tracks (of sizes Mm), emulate the action of reconnection pulses in a homogeneous medium. The bright overdense shockwave fronts seen at the bottom of Fig. 1 would lead to a mass pile up in front of the flow changing the background density. To analyze the effect of new reconnections triggered in a medium modified by the SAROs, and that resembles the fan ray features described by the observations, we use a sinusoidal initial background density conditions. Figure 6 shows the density variations obtained from the evolution of four pressure pulses located randomly in the medium distorted by previous SAROs. As shown in Fig. 5 the energy of new reconnection events is confined preferentially into the lanes left by previous reconnection events, i.e., thus the new dark voids are seen trailing brighter lanes (SAROs) once the medium is non–homogeneous. From Fig. 6 we note that the later pressure pulses, of a teardrop shape, are associated with different sizes (Mm) depending on the effect produced by the new wavefront in the medium. Note the density range variation and the occurrence of bright and dark lanes that resemble the features seen in Movie 2 provided by Savage et al., (2012) (see e.g. the 131 bandpass slice at UT). Also, the bottom slice at UT (Movie 2) exhibits a complex structure that resembles the action of evolved SAROs, where some loops are also recognized at the left bottom. If this scenario describes a possible plasma configuration, SADs could be late reconnection events that occur in a non–homogeneous medium distorted by the action of the previous localized SAROs and, the linking between SAROs and SADs would be related with the fact that energy of later reconnections is confined into the lanes left by the formers. This new burst of kinetic energy, suddenly confined into the older lanes, renews the accelerated motion of the SAROs and deforms their extremes until they acquire a teardrop–shape with an oscillating tail. Thus, these SADs would be seen trailing SAROs. This scenario does not exclude the possible presence and interaction between loops and SAROs as a result of the magnetic field reorganization, however, this needs of a 3D simulation that is beyond the scopes of this paper. An important difference with the scenario proposed by Savage et al., (2012) is that all the obtained simulated voids, some of them resembling SADs, are not wakes but reconnection outflows formed by shocks and nonlinear interactions that could also be preceded by loops. In summary, our interpretation implies that SAROs and SADs are both reconnection outflows of the same type, excepting that SAROs are previous, and they modify the medium. Later reconnection outflows will give the appearance that they are preceded by brighter lanes. What is lacking is to understand the interaction between SAROs and probable nearby loops.
4 Conclusions
We analyze the dynamic of multiple dark supra–arcade lanes that move decelerating towards the sun surface. In the scenario we proposed, dark lanes are explained as reconnection outflows (SAROs) resulting from the evolution of shocks and expansion waves that form confined voided cavities –of high temperature and values– collimated in the direction of the ambient magnetic field. These features sustain their morphology over time behaving as a whole pattern (almost independently from boundary conditions and other perturbations) with a sunward and decelerating motion triggered by upward reconnection events.
When multiple SARO configurations are analyzed we note that the structure of each SARO is similar to the individual pattern reinforcing the non–interacting hypothesis. However, we found that the wavy character that can be seen in observations can be interpreted as an indication of interaction between SAROs. This interaction is significant when the bursts that trigger the phenomenon act over the lanes left by previous SAROs. This wavy character is enhanced with the strength of the reconnection and/or with lower values of the magnetic field intensity.
The fact that in a non–homogeneous medium i.e., modified by reconnection outflows (SAROs), the energy of new reconnection events is collimated into the voided lanes left by the previous SAROs implies a linking between the previous and later reconnection events that can be consistent with the observations.
5 Acknowledgments
We are thankful to an unknown referee who helped us to improve the paper. These paper was supported by the CONICET grants PIP N° 112-200801-00754 and PIP N° 200801-02773.
References
- Costa et al., (2009) Costa, A., Elaskar, S., Fernández, C. A., and Martínez, G. (2009). MNRAS, 400:L85–L89.
- De Colle and Raga, (2006) De Colle, F. and Raga, A. C. (2006). A&A, 449:1061–1066.
- De Colle et al., (2008) De Colle, F., Raga, A. C., and Esquivel, A. (2008). ApJ, 689:302–307.
- Fernández et al., (2009) Fernández, C. A., Costa, A., Elaskar, S., and Schulz, W. (2009). MNRAS, 400:1821–1828.
- (5) Innes, D. E., McKenzie, D. E., and Wang, T. (2003a). Sol. Phys., 217:267–279.
- (6) Innes, D. E., McKenzie, D. E., and Wang, T. (2003b). Sol. Phys., 217:247–265.
- Khan et al., (2007) Khan, J. I., Bain, H. M., and Fletcher, L. (2007). A&A, 475:333–340.
- Linton et al., (2009) Linton, M. G., Devore, C. R., and Longcope, D. W. (2009). Earth, Planets, and Space, 61:573–576.
- Longcope et al., (2009) Longcope, D. W., Guidoni, S. E., and Linton, M. G. (2009). ApJ, 690:L18–L22.
- Maglione et al., (2011) Maglione, L. S., Schneiter, E. M., Costa, A., and Elaskar, S. (2011). A&A, 527:L5.
- McKenzie, (2000) McKenzie, D. E. (2000). Sol. Phys., 195:381–399.
- McKenzie and Hudson, (1999) McKenzie, D. E. and Hudson, H. S. (1999). ApJ, 519:L93–L96.
- McKenzie and Savage, (2009) McKenzie, D. E. and Savage, S. L. (2009). ApJ, 697:1569–1577.
- Priest and Démoulin, (1995) Priest, E. R. and Démoulin, P. (1995). J. Geophys. Res., 100:23443–23464.
- Savage and McKenzie, (2011) Savage, S. L. and McKenzie, D. E. (2011). ApJ, 730:98.
- Savage et al., (2012) Savage, S. L., McKenzie, D. E., and Reeves, K. K. (2012). ApJ, 747:L40.
- Schulz et al., (2010) Schulz, W., Costa, A., Elaskar, S., and Cid, G. (2010). MNRAS, 407:L89–L93.
- Verwichte et al., (2005) Verwichte, E., Nakariakov, V. M., and Cooper, F. C. (2005). A&A, 430:L65–L68.
- Warren et al., (1999) Warren, H. P., Bookbinder, J. A., Forbes, T. G., Golub, L., Hudson, H. S., Reeves, K., and Warshall, A. (1999). ApJ, 527:L121–L124.
- Warren et al., (2011) Warren, H. P., O’Brien, C. M., and Sheeley, Jr., N. R. (2011). ApJ, 742:92.