ATCA monitoring of gamma-ray loud AGN
Abstract
As a critical part of the Tracking Active Galactic Nuclei with Austral Milliarcsecond Interferometry (TANAMI) program ojha2010 , in November 2007 the Australia Telescope Compact Array (ATCA) started monitoring the radio spectra of a sample of southern hemisphere active galactic nuclei (AGN) that were selected as likely candidates for detection (as well as a control sample) by the Large Area Telescope (LAT) aboard the Fermi Gamma Ray Space Observatory. The initial sample was chosen based on properties determined from AGN detections by the Energetic Gamma Ray Experiment Telescope (EGRET). Most of the initial sample has been detected by Fermi/LAT and with the addition of new detections the sample has grown to include 226 AGN, 133 of which have data for more than one epoch. For the majority of these AGN, our monitoring program provides the only dynamic radio spectra available. The ATCA receiver suite makes it possible to observe several sources at frequencies between 4.5 and 41 GHz in a few hours, resulting in an excellent measure of spectral index at each epoch. By examining how the spectral index changes over time, we aim to investigate the mechanics of radio and -ray emission from AGN jets.
I INTRODUCTION
Results from EGRET revealed a very strong link between -ray emission in AGN and core-dominated radio emission from relativistic jets, which may originate from super-massive black hole and accretion disk systems hartman1999 . Recent Fermi data have confirmed this ackermann2011 . Observations at radio wavelengths were critically important for the understanding of the -ray emission mechanism in these AGN. In particular, the relative timing of -ray flares and radio outbursts provides constraints on the mechanisms and location of the flare origin jorstad2001 . The main models for -ray emission entail inverse Compton scattering of low energy photons to high energies by the relativistic electron population in the AGN jets. The low energy photons could have their origin external to the jet, perhaps in the broad line region of the AGN dermer1993 or could originate internal to the jet, being the synchrotron radio/IR/optical emission from the electrons themselves interacting with the jet magnetic field bloom1996 .
Radio flux density monitoring observations, which allow for the evolution of the radio emission to be followed as a function of time, may indirectly reveal when relativistic electrons are being injected into the AGN jet. Observations at high frequencies, in the optically-thin part of the radio spectrum, may allow us to probe deep into the structure of the radio jet, to where the -ray emission is likely generated lahteenmaki2003 .
II ATCA OBSERVATIONS
Since late 2007, the ATCA has undertaken a project (designated C1730) to regularly observe a number of southern AGN that have been detected in -rays. For many sources, particularly those south of declination, this is the only project providing flux density monitoring data. It measures flux densities for these AGN at frequencies between 4.5 to 41 GHz, making it ideal for investigating the physics involved in -ray emission.
The ATCA is ideally suited for a program such as C1730. It is a six-element interferometer located near the town of Narrabri in New South Wales. Each antenna has a 22-m diameter, with a Cassegrain focus. Each antenna has a suite of cryogenically-cooled receivers, which cover 67% of the frequency range between 1.1 - 50 GHz. The telescope can quickly change between these receivers to make observations at a range of different frequencies within a short timespan. The C1730 project uses this ability to measure the spectral index of each source it monitors, by obtaining flux densities at 5.5, 9, 17, 19, 38 and 40 GHz almost simultaneously. A typical C1730 epoch will observe 5 closely-spaced sources at two simultaneous frequencies in 30 minutes, before switching frequencies and reobserving them again, resulting in full spectral coverage within 2 hours.
Between the start of the C1730 project in November 2007 and February 2009, observations were made with the original ATCA correlator, which provided 256 MHz of bandwidth, with 128 MHz at each of two simultaneously measured frequencies. In March 2009, the ATCA correlator was upgraded to the Compact Array Broadband Backend (CABB, wilson2011 ), which provides 4 GHz of bandwidth, with 2 GHz at each of two simultaneous frequencies.
The ATCA changes the locations of its antenna several times each year. Five of the six antenna are set on a 3 km long East-West track, while the sixth is held stationary 3 km west of the western end of this track. This allows for configurations with baseline lengths between 31m and 6 km. Antenna can also be placed on a short (214m) North-South track placed roughly half-way along the East-West track, and this is done when high brightness-sensitivity is required. The C1730 project has been scheduled in various array configurations, as the sources that it observes are usually point-like.
Details of the C1730 observing epochs to-date are listed in Table 1. The project commenced with a pilot study before Fermi was launched, to trial monitoring of 16 southern AGN detected by EGRET. This successful pilot study paved the way for continued observations, and with the emergence of the first results from Fermi in early 2009, the source list was quadrupled.
In 2011, the source list was revised based on the first and second Fermi catalogs of detected AGN, and the expanded list of TANAMI targets. The original declination limit of was changed to better match the TANAMI range () and reflect the larger number of southern sources now identified by Fermi. The most recent epochs included 150 2LAC sources with , including proposed counterparts (primarily X-ray associations) that had not previously been detected at radio frequencies.
| Dates | Array | No. sources |
|---|---|---|
| 2007 Nov 01/02 | 1.5A | 17 |
| 2008 Jan 11/12 | 6A | 20 |
| 2008 Mar 14/15 | 1.5D | 20 |
| 2008 Oct 13/14 | 6A | 17 |
| 2008 Dec 17/18 | 750B | 20 |
| 2009 Feb 22/23 | EW352 | 45 |
| 2009 Apr 24/25 | H168 | 73 |
| 2009 May 18/19 | H214 | 73 |
| 2009 Jun 26/27 | H75 | 73 |
| 2011 May 17/18 | 1.5B | 50 |
| 2011 Aug 31 | 6B | 36 |
| 2011 Sep 13 | 6B | 34 |
| 2011 Oct 15 | H75 | 44 |
| 2011 Nov 02 | 750C | 36 |
| 2011 Nov 08/09 | EW367 | 53 |
| 2011 Nov 27/28 | 1.5D | 158 |
| 2011 Dec 03/04 | 1.5D | 42 |
Our C1730 observations will contribute significantly toward the identification of the physics of extragalactic Fermi sources, along with monitoring programs at other frequencies, for example:
-
•
“Fermi Large Area Telescope Observations of the Active Galaxy 4C +55.17: Steady, Hard Gamma-Ray Emission and its Implications” mcconville2011
-
•
“Fermi Large Area Telescope Observations of Markarian 421: The Missing Piece of its Spectral Energy Distribution” abdo2011d
-
•
“The First Fermi Multifrequency Campaign on BL Lacertae: Characterizing the Low-activity State of the Eponymous Blazar” abdo2011c
-
•
“Insights into the High-Energy Gamma-ray Emission of Markarian 501 from Extensive Multifrequency Observations in the Fermi Era” abdo2011b
C1730 observations are also occassionally made to rapidly follow-up sources that are reported to be flaring by Fermi, for example ATels 3788, 3734, 3713, 3703, 3579 and 3394. In this way, we have a higher probability of observing “interesting” AGN, and thus examining their temporal behaviour during flare events. With the sensitivity that CABB provides with its 4 GHz of bandwidth, accurate flux density measurements are possible even for objects that are not normally very bright. For example, in 20 minutes of on-source integration time, the ATCA with CABB reaches an RMS noise level of 30 uJy at 5.5 GHz, 40 uJy at 9, 17 and 19 GHz, and 70 uJy at 38 and 40 GHz. It is therefore possible to follow-up interesting flare events during periods of unscheduled time as small as 2 hours.
III BLAZAR VARIABILITY
All data from C1730 is reduced through the same custom pipeline, ensuring consistency over multiple epochs. Flux density calibration is achieved via the ATCA primary flux density calibrators PKS B1934-638 – for frequencies lower than 25 GHz – and the planet Uranus for higher frequencies.
Early analysis has focussed on determining which of the AGN monitored by this program have varied, and how. Using the method described in angelakis2010 , we have found 107 sources that have varied between 2007 and now. The spectral curves for these sources are shown in Figure 1. The variability is characterised by a change in the spectral turnover frequency. For sources that vary in brightness achromatically, the spectral turnover frequency will remain constant, but if, for example, the source becomes disproportionately brighter at higher frequencies, the spectral turnover may shift toward the higher frequency end.
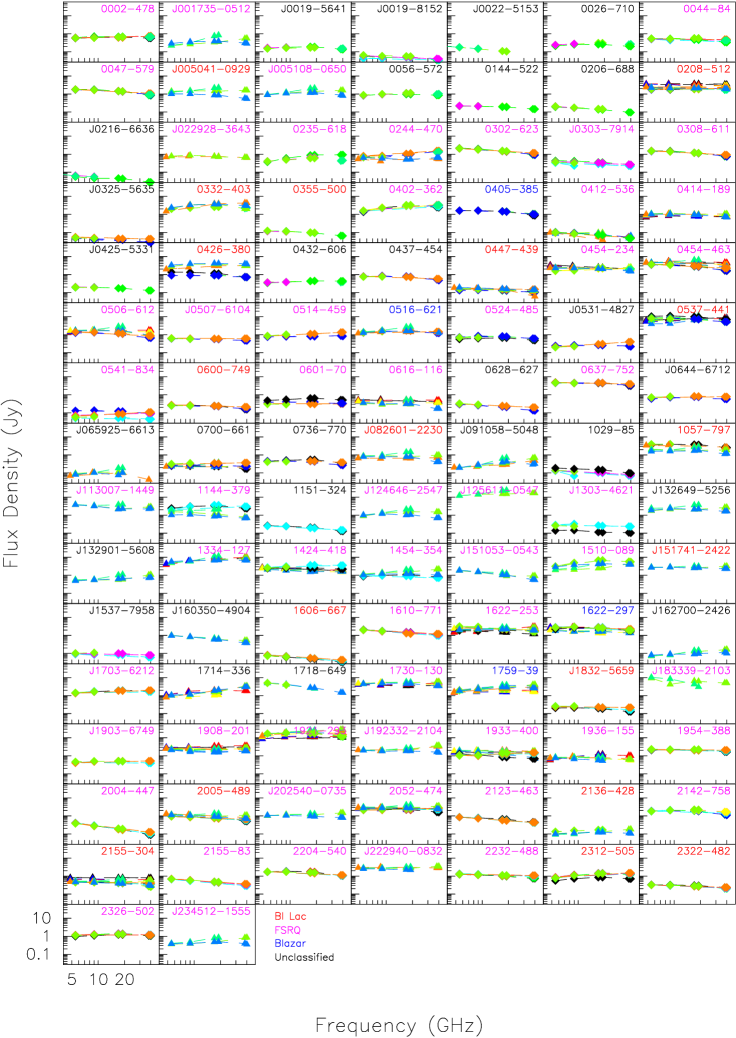
We used the Roma-BZCAT massaro2009 , CGRaBS healey2008 and 1LAC abdo2010 catalogues of blazars to separate the AGN in this survey into BL Lacs, flat-spectrum radio quasars (FSRQ) and unclassified blazars. Sources that do not appear in any of these catalogues are listed here as “Unclassified”. Fifty-nine percent of our sources are blazars, while most others are flat-spectrum radio sources (FSRS, healey2007 ).
From our survey, 72% of the BL Lacs have shown spectral-index variability, along with 87% of the FSRQs and 80% of the unclassified blazars, while 89% of the unclassified sources also show spectral variation. Of these variable sources, 97% are seen to have a spectral turnover frequency at the very highest observed frequencies in at least one epoch. This indicates that the vast majority of our variable sources become periodically brighter at high frequencies, but do not always stay that way. Further work is required to determine whether these high-frequency flux increases are associated with -ray activity.
IV ONGOING WORK
Observations at the ATCA continue on a regular basis, and analysis of the bulk of the data has yet to be completed. This section describes some of the analysis we plan to do in the near future.
The ATCA receivers are capable of measuring polarisation accurately at all the frequencies observed by this project. It will therefore be possible to examine the polarisation position angle variability for these blazars, and determine if the magnetic field direction is changing when the spectral index varies.
The ATCA monitoring data provides information crucial in constructing the spectral energy distributions (SEDs) of AGN both in their flaring and quiescent states. Quasi-simultaneous broadband SEDs are necessary to distinguish between competing models for the high-energy emission from AGN boettcher2007 ; abdo2011 . The ATCA data are also being used to look for changes in spectral index associated with the ejection of VLBI components from the AGN cores.
V SUMMARY
The ATCA has monitored a set of 133 AGN over multiple epochs for four years, and will continue to monitor even more in the future. Through a combination of regular monitoring and target-of-opportunity observations of flaring AGN, we will investigate the mechanisms responsible for both radio and -ray emission in their jets.
More information can be found on the project website: http://goo.gl/WHxmf
References
- (1) A.A. Abdo et al. 2010, ApJ, 715, p429
- (2) A.A. Abdo et al. 2011, ApJ, 719, p1433
- (3) A.A. Abdo et al. 2011, ApJ, 727, p129
- (4) A.A. Abdo et al. 2011, ApJ, 730, p101
- (5) A.A. Abdo et al. 2011, ApJ, 736, p131
- (6) M. Ackermann et al. 2011, ApJ, 743, p171
- (7) E. Angelakis et al. 2010, in “Fermi meets Jansky”, T. Savolainen (ed)
- (8) S.D. Bloom & A.P. Marscher 1996, ApJ, 461, p657
- (9) M. Boettcher 2007, Ap&SS, 309, p95
- (10) C.D. Dermer & R. Schlickeiser 1993, ApJ, 416, p458
- (11) M. Gaylard et al. 2011, ATel #3713
- (12) R.C. Hartman et al. 1999, ApJ, 123, p79
- (13) S.E. Healey et al. 2007, ApJSS, 171, p61
- (14) S.E. Healey et al. 2008, ApJSS, 175, p97
- (15) S.G. Jorstad et al. 2001, ApJ, 556, p738
- (16) A. Lahteenmaki & E. Valtaoja 2003, ApJ, 590, p95
- (17) E. Massaro et al. 2009, A&A, 495, p691
- (18) W. McConville et al. 2011, ApJ, 738, p148
- (19) R. Ojha et al. 2010, A&A, 519, A45
- (20) E. Valtaoja & H. Terasranta 1995, A&A, 297, L13
- (21) W.E. Wilson et al. 2011, MNRAS, 416, p832