Public Data Integration with WebSmatch
Abstract
Integrating open data sources can yield high value information but raises major problems in terms of metadata extraction, data source integration and visualization of integrated data. In this paper, we describe WebSmatch, a flexible environment for Web data integration, based on a real, end-to-end data integration scenario over public data from Data Publica111http://www.data-publica.com. WebSmatch supports the full process of importing, refining and integrating data sources and uses third party tools for high quality visualization. We use a typical scenario of public data integration which involves problems not solved by currents tools: poorly structured input data sources (XLS files) and rich visualization of integrated data.
1 Introduction
Recent open data government initiatives, such as data.gov, data.gov.uk, data.gouv.fr promote the idea that certain data produced by public organizations should be freely available to everyone to use and republish as they wish. As a result, a lot of open data sources are now available on public organization’s web sites, in various formats.
Integrating open data sources from different organizations can yield high value information. For instance, matching gas emission data with climatic data for a given country or city can be valuable to better understand pollution. This rich local and targeted pool of information can also be leveraged to build new innovative services or, as a new source of business intelligence, to put in perspective business information with data such as weather, traffic, density of economic activities or touristic information in order to better understand current market dynamics and adapt product and services.
A large share of the available open data comes from large institutions (such as Eurostat, World bank, UN….) using structured data formats such as SDMX for statistical datasets or RDF for linked open data. However, the majority of the data that can be found on open data portals is available as unstructured data (such as spreadsheets). To integrate these sources or deliver data that web applications or mobile services can leverage, raw open data files must be structured through a processing workflow and delivered through APIs (Application Programming Interfaces). This workflow will ultimately transform “human usable information” such as spreadsheets into “computer usable data”, drastically increasing the value of the open data published.
Based on this observation, Data Publica, a french company, provides added value over the public data sources they crawl, such as visualization of data sources or production of integrated data. Achieving this goal raises the followings problems:
Metadata extraction. Although structured formats exist to share and publish data, most of the public data available on the Web are Excel spreadsheets, with no difference between data and metadata. Detecting the metadata in such data sources is a mandatory step before performing data integration. To address this problem, we exploit computer vision techniques to deal with complex tabular representations of spreadsheets and machine learning techniques that take advantage of past human effort to automatically detect metadata in the next spreadsheets.
Data sources integration. In order to produce added value information over the public data sources, it is necessary to integrate data sources together. For this purpose, we need to perform schema matching, in order to match metadata structures [2]. In the context of open data, schema matching is harder than in traditional data integration in distributed database systems [12], mainly because important metadata which are considered as implicit by document’s authors, are simply missing. In terms of matching capabilities, we rely on YAM++ [4], a powerful tool for schema matching and ontology alignment222YAM++ was recently ranked first at the Conference track of the OAEI competition over 15 participants. See the results at http://oaei.ontologymatching.org/2011/ for more details..
Visualization. To ease users’s access to public data requires visualizing with high quality graphical representation. In Data Publica, the visualization task is delegated to Google Data Explorer, a powerful collection of visualization tools. However, Google Data Explorer imposes strict restrictions on input formats, such as separating data and metadata into different files and labeling metadata with some Google predefined concepts. Therefore, using Google Data Explorer requires metadata extraction and integration as preliminary steps.
To perform these tasks, Data Publica uses WebSmatch http://websmatch.gforge.inria.fr/ , an environment for Web data integration with a service-oriented architecture with much flexibility for users and developers. Most tools for metadata integration are implemented as heavy clients and hard-coded with their own graphical interfaces. They need to be downloaded and installed, which make them hard to use with other independent tools (even if sources are provided) and reduce their dissemination. In contrast, WebSmatch is an open environment to be used as a Rich Internet Application (RIA).
In this paper, we describe the architecture of WebSmatch based on a real-life, end-to-end data integration scenario over public data from Data Publica.
The paper is organized as follows. Section 2 introduces the motivating example in terms of inputs (poorly structured files) and outputs (rich visualization of integrated data). Section 3 describes the data integration process with WebSmatch. Section 4 presents WebSmatch metadata detection and integration services through the motiving example. Section 5 discusses related work. Section 6 concludes.
2 Motivating example
In this section, we describe a real example by giving the inputs and outputs of the data integration process with WebSmatch.
Data Publica provides more than 12 000 files of public data. [1] However, even though data formats become richer and richer in terms of semantics and expressivity (e.g. RDF), most data producers do not use them much in practice, because they require too much upfront work, and keep using simpler tools like Excel. As an example, Data Publica has started to crawl public data available from the French administration, and found only 369 RDF files, compared with 148.509 .xls files. Unfortunately, no integration tool is able to deal in an effective way with spreadsheets. As far as we know, only two recent initiatives, OpenII [14] and Google Refine 333http://code.google.com/p/google-refine/ deal with Excel files. However, their importers are very simple and make some strict restrictions over the input spreadsheets. For instance, they require to have exactly one table per sheet and all the attributes have to be in columns, at the first line of the sheet. Unfortunately, people do not use Excel in such proper way. And these importers proved to be useless on real spreadsheets from Data Publica. Thus, extracting metadata from such sources remains an open problem [6]. To illustrate this problem in the remaining part of the paper, we use the following spreadsheet files as input.
Input files
For simplicity purposes, the scenario of this example involves only 2 data sources. To be representative of real-life public data, we choose two spreadsheet files:
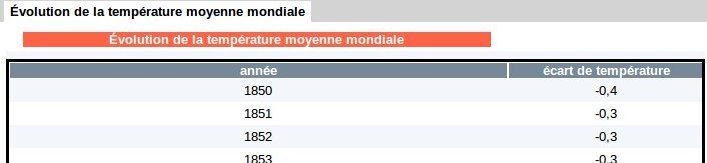
http://www.data-publica.com/publication/1341 is an Excel file. It contains data from the Climatic Research Unit (http://www.cru.uea.ac.uk/ ) about the temperature evolution in the world over the last decades. This file is quite well formed, it only contains some blank lines and comments.
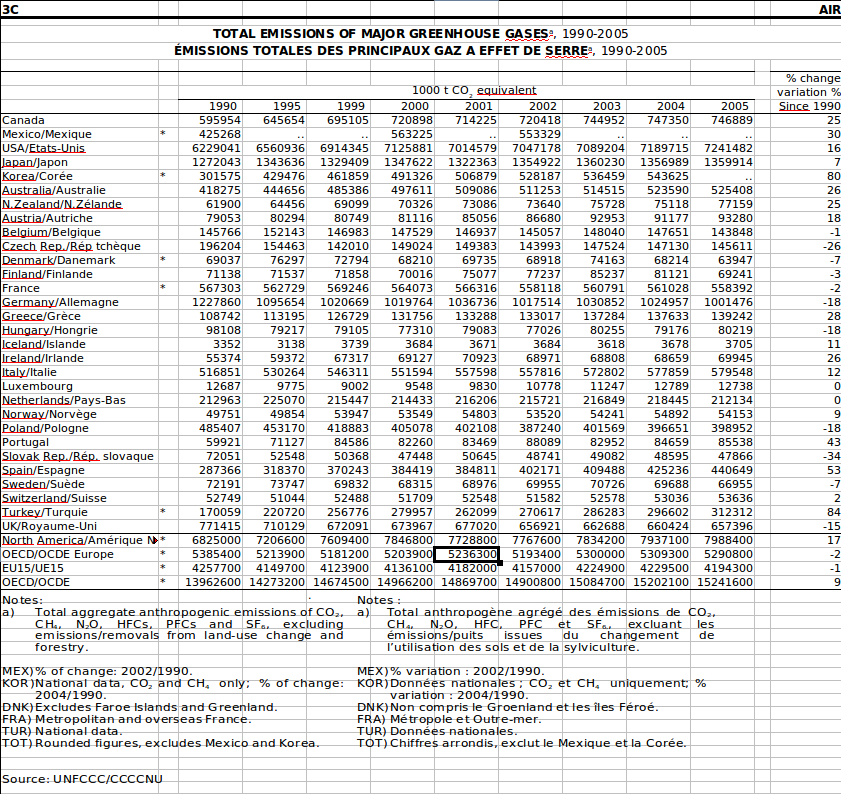
http://www.data-publica.com/publication/4736 is the Excel file depicted in Figure 1. It contains data from OECD ( http://www.oecd.org/ ) about gas emissions in the world. The file contains the evolution on the last 20 years on several countries and 4 OECD geographic zones444See http://stats.oecd.org/glossary/ for more details about these zones.. This spreadsheet is much more complex: it involves several sheets, with several tables per sheet. It contains several blank lines and comments, making it hard to automatically detect the table. In addition, it involves bi-dimensional tabular structures (Figure 1) and some column names are missing. For instance, the author of this file probably has in mind that the line containing should be labelled by "year", which is not obvious in the context of automatic integration.
Expected results
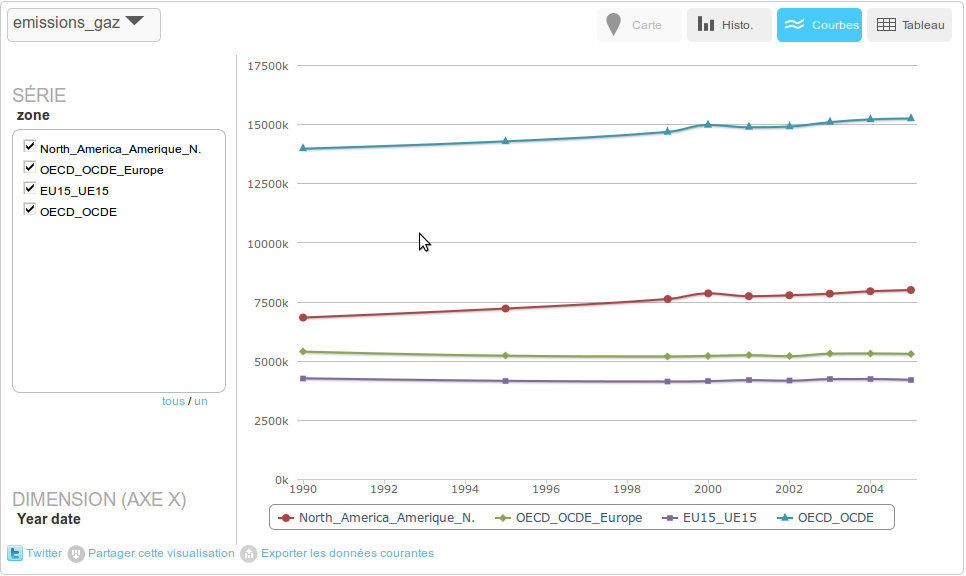
Charts (Figures 2 and 5), maps (Figure 4) and additional animations with timelines are visualizations obtained after extraction of metadata and integration of the inputs described above.
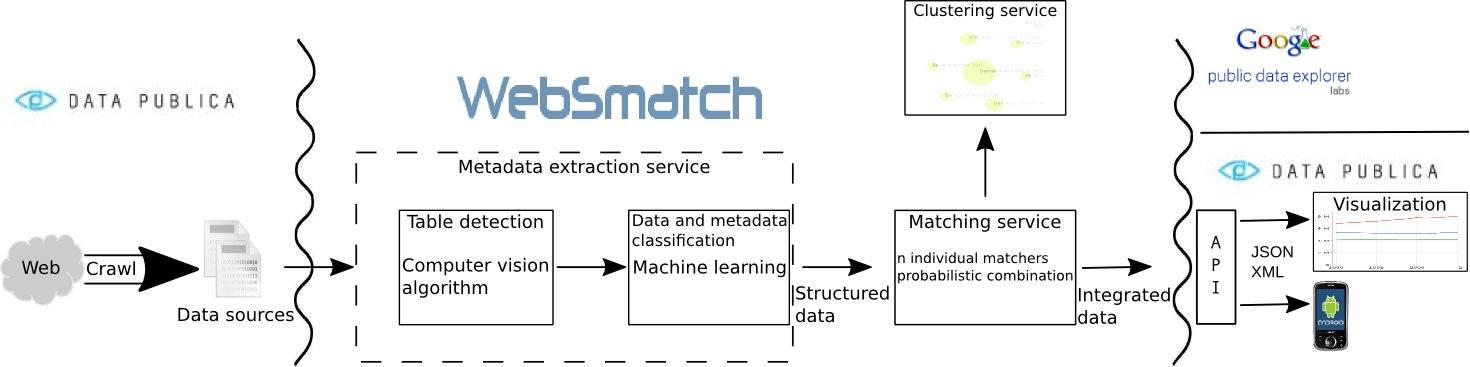
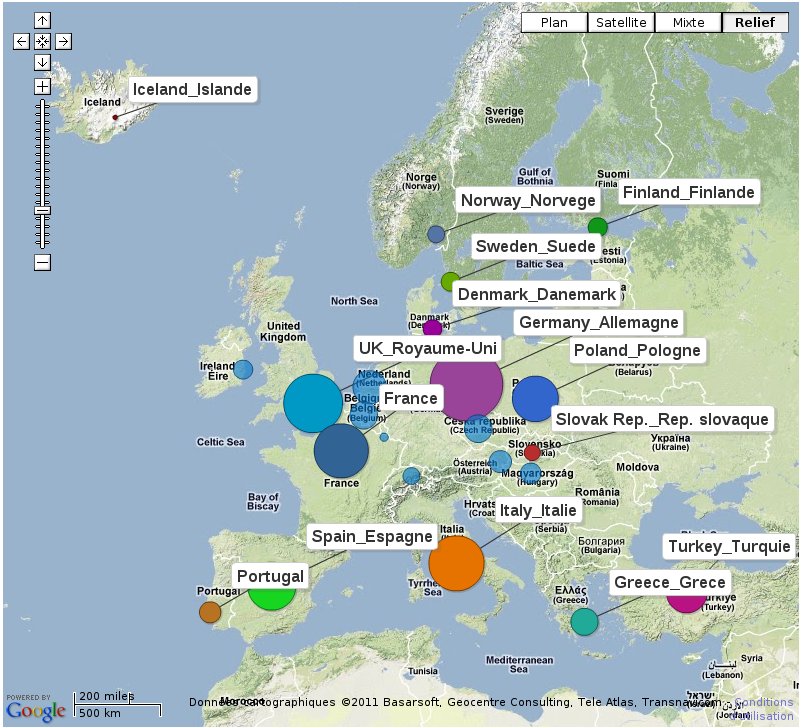
Figure 2 shows clearly that the emission of gas grows up significantly since 2000 in North America. Since then, EU15 countries stabilized their emissions, which corresponds to the Kyoto agreement. Figure 4 is a screenshot of an animation of the same data on a map.
Figure 5 is a diagram involving both data sources. It correlates the evolution of temperature in the world with gas emission. Thus, it requires to integrate both data sources together. The result shows clearly that the acceleration of the augmentation of temperature at the world level increases significantly since 2000 with gas emission.
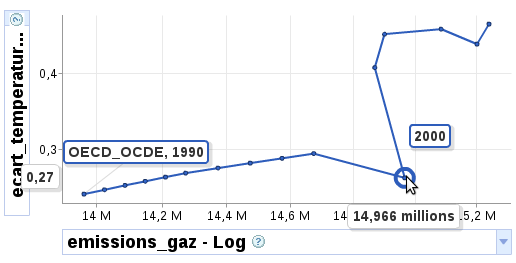
To perform visualization, Websmatch exports the integrated data in Data Set Publishing Language (DSPL) format https://developers.google.com/public-data/) . DSPL is used by Google Public Data Explorer and Data Publica’s own API and visualisation engine. Such format assumes the input data source to be precisely described. In particular, data and metadata need be distinguished. The metadata (source, title, author, header) are described in an XML file whereas the data are in Comma-Separated Values (CSV) files. In addition, metadata need to be tagged by some DSPL predefined concepts (hierarchy including times or geographical entities). Such format is too strict to be usable by a large public, and quite difficult to manipulate, even for computer scientists. Thus, although Google Data Explorer provides a powerful collection of visualization tools, it requires much upfront work from the user, in particular, with public spreadsheets like the ones described above.
3 Data Integration process
WebSmatch is a Rich Internet Application (RIA), meaning that Data
Publica is able to use it remotely, as a Web service, without any installation.
To use all the WebSmatch components (integration, matching, clustering and export),
Data Publica simply needs to put some redirection from their back office.
The integration of WebSmatch and Data Publica is depicted in Figure 3.
It involves the following flow:
Crawling. Data Publica has developed a crawler dedicated to public data sources. It extracts data sources in various formats (such as Excel spreadsheets, ontologies, and XML files).
Data sources that are already well structured are directly transformed into DSPL and loaded into Data Publica’s database.
The other sources are sent to Websmatch (about 64% of the volume)
Metadata extraction.
The metadata extraction service takes as input raw files and extracts metadata to distinguish
data from metadata.
In the case of spreadsheets (more than 95 % of public data), since
spreadsheet users often put several tables per sheet in their
document, the first task is to identify the different tables. This is achieved by a computer vision algorithm.
Then the different tables that have been identified are sent to the metadata classification service, which relies on Machine Learning techniques.
Matching.
As soon as the data sources have been cleaned, and data and metadata distinguished, the data sources are ready to be matched. This matching task achieves two goals. First, matching data sources together allows discovering the overlaping between sources, which can be exploited to generate integrated data. Second, concepts are identified in order to generate the appropriate data description based on shared DSPL concepts defined with Data Publica.
Clustering.
To deal with high numbers of data sources, as in Data Publica,
the usual 2-way matching approach (which makes visualization easy) becomes irrelevant.
Instead, we propose a schema clustering approach to visualize semantic similarities between sources.
Furthermore, clustering is a very intuitive way to perform recommendation to a user, who is looking for
related data sources.
Visualization.
Once data is extracted from the source file, metadata is identified and concepts are matched, the information is structured as DSPL and exported.
The DSPL file is then loaded in Data Publica’s database and served
through a generic API. This API supports different output formats such
as XML, CSV or Java Script Object Notation (JSON) and has filtering capabilities with standard functions (such as equals, greater than, in…) or geographic filters. This API is currently used by mobile applications and by Data Publica’s own data visualization tool to display graphs, maps and compare datasets.
Alternatively, the DSPL file can be visualized in Google Data Public Explorer.
4 Running the complete workflow
We now illustrate the complete workflow of using WebSmatch by Data Publica on the scenario described in Section 2. In order to couple the Data Publica back office and the WebSmatch application, Data Publica uses WebSmatch services via its Crawl application. Using the option "Publish (WS)" on its application redirects the crawled document to WebSmatch and the Data Publica user is also redirected to the WebSmatch editor main frame.
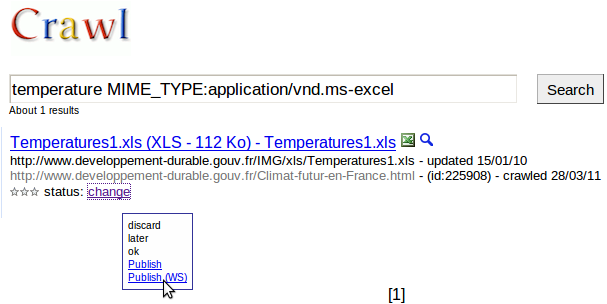
Metadata Detection
After the Crawl (see Figure 6), the user is redirected to the WebSmatch RIA. It is important to note that Excel files (such as .xls, for which there is no XML version) are not structured at all. As can be seen in Figure 1, they can contain lots of artifacts such as blank lines, blank columns, titles, comments, and not only a simple table.
To get all the metadata and data, the chosen file is parsed and then, two processes are applied to it. The first process relies on a combination of computer vision algorithms.
Using the jexcelapi555http://jexcelapi.sourceforge.net/ library as a wrapper, the spreadsheet is first translated into a 0/1 bitmap (0 for void cell / 1 for non empty cell).
In this bitmap, we run a connected component detection algorithm. Algorithm 1 takes as input a function indicating the color of a point in a bitmap (in our case, a datatype of a cell) and within a one step linear parse of the matrix, assigns a connected component to each cell.
Algorithm 1 allows us to partition the spreadsheet into regions. We then use more sophisticated computer vision approaches, such as morphologic transformation [5] and erode / dilate functions [8] to refine the result of the connected component detection: remove too small connected components, merge connected components that have been splitted due to a single void line, etc…
In the graphical interface (see Figure 7), the detected tables are drawn within a frame.
To decide whether data are line- or column-oriented, we exploit the following idea: if data are presented in lines, the datatypes of cells for each line are homogeneous, but the datatypes of cells for each column may be heterogeneous. We then compute the discrepancy in terms of cell datatypes for each line (1) and for each column (2). If (1) > (2), then the metadata are probably on the first lines, or on the first columns otherwise.
| (1) |
| (2) |
The end of the process relies on machine learning [9]. Using past experience and based on several criterions: the discrepancy measures, the datatype of a cell, the data type of the neighborhood of a cell, WebSmatch detects each important component in the spreadsheet file such as: titles, comments, table data, table header (see Figure 7). Machine learning is able to capture several spreadsheet users habits, such as: “cells on the very first line of a connected component, having the string datatype and bellow cells having a numeric datatype are often metadata” or “cells having the string datatype and void neighborhood and behind a table often are a title”. The important feature is that such rules have not been designed by the user, but observed on several documents. They can be updated when new spreadsheets are performed by the user.
Matching
WebSmatch relies on YAM++ [4] to perform the matching task. YAM++ combines 14 different matching techniques, divided in 3 main groups: string matchers, dictionary and thesaurus matchers based on Wordnet666http://wordnet.princeton.edu/ and instance-based matchers. Instance-based matcher is the generic name for matchers, which deals both with metadata and data. Such matchers are very useful when the column names are not informational enough, which is often the case in public data. The instance-based matcher implemented in YAM++ is very powerful and one of the main reasons for YAM++ excellent results at the 2011 competition of the Ontology Alignment Evaluation Initiative (http://oaei.ontologymatching.org: first position at the Conference track and second position at the Benchmark track [10].
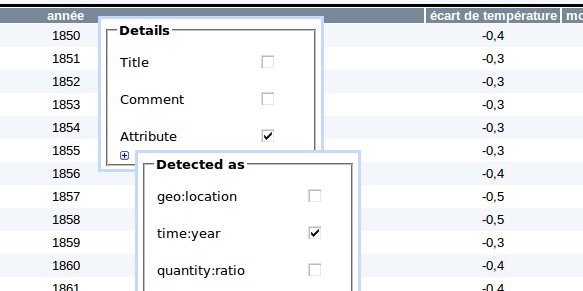
Figure 8 is a zoom of Figure 7 on the cell “année” (i.e. year in french), which has been previously detected as metadata. This cell is detected as "time:year" concept by applying the instance-based matcher on its data collection . Figure 9 depicts all the discovered matches over the two files of the scenario and the DSPL concepts we previously imported into the tool.
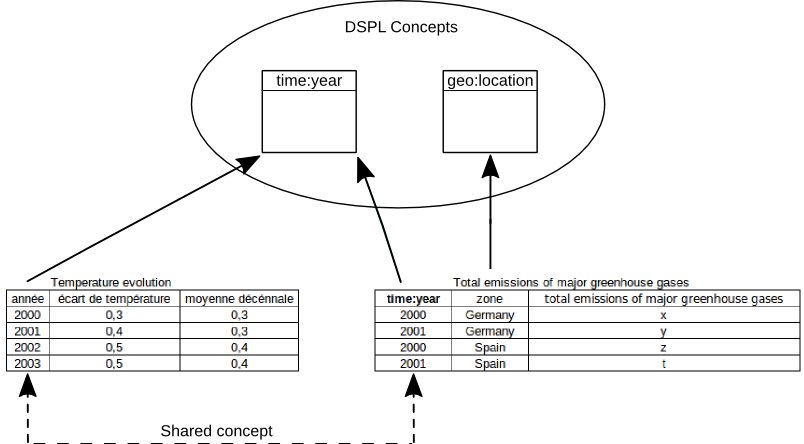
Notice that the line of the second spreadsheet (Figure 1) contains a line within a collection of years but with a void cell as first column. Despite it is void, this cell is detected by WebSmatch to be a metadata. Indeed, it is at the first line and first column of the detected table and our machine learning algorithm detects the metadata to be placed in the first column. By applying the instance-based matcher, WebSmatch suggests this cell to be labelled with the "time:year" concept.
Clustering
Based on the semantic links discovered by the matchers between documents, WebSmatch automatically clusters the set of documents. It first computes a distance between each pair of documents. More formally, we build a bipartite graph, where nodes are attributes from the documents and edges are the matches discovered by the matching services, the weights over edges are labelled by the confidence value of the discovered matches. From this weighted bipartite graph, we compute the maximum matching and normalize it by dividing it by the minimum numbers of attributes between the two documents.
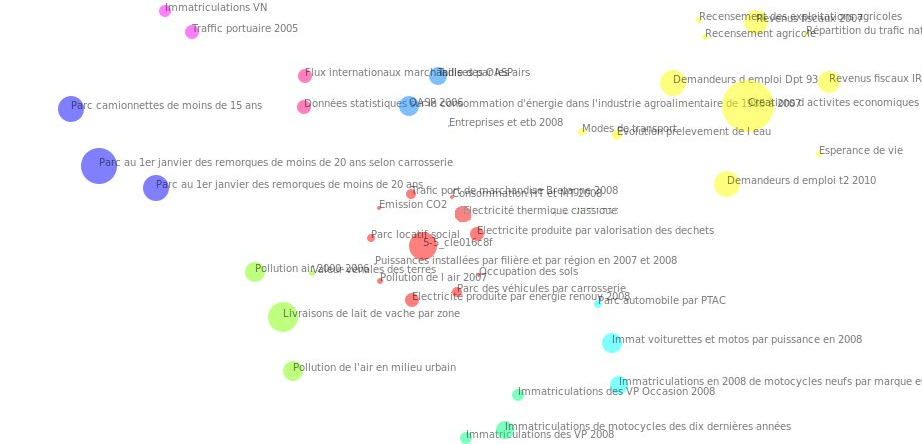
From these distances between documents, we propose a minimum energy graph model (adapted from [11]), which represents the cluster structure based on repulsion between documents. Figure 10 illustrates the result of the clustering service after adding a given number of documents: each cluster is drawn in a different color, documents are in the same cluster if and only if they share some semantics links. Documents have different diameters: the larger is the diameter, the more representative of the cluster is the document.
The clustering service provides an automatic way to classify documents in several categories. This is a very interesting feature in the Data Publica application, where the number of sources is huge (). Finally, it is able to perform some recommendation, by suggesting to the user documents related to those she is currently interested in.
Visualization
By detecting the blank cell, we are able to convert the bi-dimensionnal table from the initial spreadsheet (Figure 1) into a classical (SQL-like) flat table (Figure 9). Thanks to the matching process, we are also able to identify concepts (from DSPL) over the data sources and to detect common attributes in order to produce integrated data.
At this step, we have distinguished data and metadata from the initial Excel files, and flatted bi-dimensionnal tables. We can easily generate an XML file describing the metadata (title, header, concepts) and the .csv files containing the data to fit the strict DSPL input format. As a result, we can take advantage of the powerful capabilities of Google Data Explorer in terms of visualization or load the structured data into Data Publica’s database as shown in Section 2.
5 Related Work
In terms of metadata extraction, the problem of identifying charts in documents using machine learning techniques has been widely studied over the last decade. In [7], the authors propose a method to automatically detect bar-charts and pie-charts, using computer vision techniques and instance-based learning. The approach developed in [13] relies on a multiclass Support Vector Machine, as machine learning classifier. It is able to identify more kinds of charts, namely bar-charts, curve-plots, pie-charts, scatter-plots and surface-plots. More generally, [3] presents a survey of extraction techniques of diagrams in complex documents, such as scanned documents.
All these techniques allow recognition of charts, thus much complex shapes than tables. But, in our case our problem
is not only to decide whether a table is present or not in the document, but to provide precise coordinates of all tables in
the document.
Google Refine (code.google.com/p/google-refine/) is a powerful tool to perform data cleaning. It helps the user to deal with messy data, by discovering inconsistencies. For instance, it allows string transformation to avoid the same entity, spelled in two different ways to be considered as two different entities. Google Refine also allows data augmentation using external web services or named-entity recognition based on the FreeBase social database (http://www.freebase.com). Using the “Add column based on a URL fetched on column”, the user can add extra columns to her document. Nevertheless, she needs to know precisely which service to call and its complete syntax.
The major drawback of Google Refine when dealing with Excel files is the strict assumptions made over the input spreadsheet. Excel files need to have exactly one table per sheet and all attributes have to be in column and at the first line of the sheet (or the number of header lines have to be explicitly mentioned). WebSmatch’s metadata extraction service is thus a mandatory step to use Google Refine on documents such as those published by french administrations and crawled by DataPublica.
Another cooperation between WebSmatch and Google Refine deals with data augmentation. Thanks to its matching capabilities, WebSmatch is able to tag the first column of a document (Figure 1) with DSPL concepts (namely geo:location). Geo-encoding such column may then be done automatically, without any involvement of the user.
6 Conclusion
In this paper, we described WebSmatch, a flexible environment for Web data integration, based on a real data integration scenario over public data from Data Publica. We chose a typical scenario that involves problems not solved by currents tools: poorly structured input data sources (XLS files) and rich visualization of integrated data. WebSmatch supports the full process of importing, refining and integrating data sources and uses third party tools for high quality visualization and data delivery. A video playing the whole motivation example is available at http://websmatch.gforge.inria.fr. Furthermore, it can be played with a test account at the same url. .
References
- [1] F. Bancilhon and B. Gans. Size and structure of the french public sector information. In gov.opendata.at, 2011.
- [2] Z. Bellahsene, A. Bonifati, and E. Rahm, editors. Schema Matching and Mapping. Springer, 2011.
- [3] D. Blostein, E. Lank, and R. Zanibbi. Treatment of diagrams in document image analysis. In Int. Conference on Theory and Application of Diagrams, pages 330–344, 2000.
- [4] N. Duyhoa, Z. Bellahsene, and R. Coletta. A generic and flexible approach ontology alignment task. In Int. Conf. Ontologies, DataBases, and Applications of Semantics, pages 800–807, 2011.
- [5] R. M. Haralick and L. G. Shapiro. Computer and Robot Vision. Addison-Wesley, 1992.
- [6] F. Hermans, M. Pinzger, and A. van Deursen. Automatically extracting class diagrams from spreadsheets. In European Conference on Object-Oriented Programming, pages 52–75, 2010.
- [7] W. Huang, S. Zong, and C. L. Tan. Chart image classification using multiple-instance learning. In IEEE Workshop on Applications of Computer Vision, pages 27–, 2007.
- [8] T. Y. Kong and A. Rosenfeld, editors. Topological Algorithms for Digital Image Processing. Elsevier, 1996.
- [9] T. M. Mitchell. Machine Learning. McGraw-Hill Series in Computer Science. WCB/McGraw-Hill, 1997.
- [10] D. Ngo, Z. Bellahsene, and R. Coletta. YAM++ results for OAEI 2011. In International Workshop on Ontology Matching, 2011.
- [11] A. Noack. Energy models for graph clustering. J. Graph Algorithms Appl., 11(2):453–480, 2007.
- [12] T. M. Özsu and P. Valduriez. Principles of Distributed Database Systems, third edition. Springer, 2011.
- [13] V. Prasad, B. Siddiquie, J. Golbeck, and L. Davis. Classifying computer generated charts. In Content-Based Multimedia Indexing Workshop, pages 85–92, 2007.
- [14] L. Seligman and al. OpenII: an open source information integration toolkit. In Int. SIGMOD Conference, pages 1057–1060, 2010.