First-principles study of bandgap effects in graphene due to hydrogen adsorption
Abstract
Hydrogen adsorption on graphene in commensurate periodic arrangements leads to bandgap opening at the Dirac point and the emergence of dispersionless midgap bands. We study these bandgap effects and their dependence on periodicity for a single hydrogen adsorbate on periodic graphene supercells using spin-polarized density-functional theory calculations. Our results show that for certain periodicities, marked by a scale factor of three, the bandgap is suppressed to a great extent, and has a special level structure around the neutrality point. We present explanations for the origin of the changes to the band structure in terms of the ab initio Hamiltonian matrix. This method may be used to obtain a more accurate tight-binding description of single hydrogen adsorption on graphene.
1 Introduction
The isolation/discovery of graphene [1], a single layer of graphite, and the demonstration of its unusual electronic properties [2, 3] has attracted a lot of attention in the condensed matter physics community. The origin of the novel phenomena which were observed in these works lies in the special band structure of graphene that was studied theoretically several decades ago [4]. The theoretical analysis showed that the valence and conduction bands in graphene touch at only the two inequivalent corners of the hexagonal Brillouin zone (BZ), known as the Dirac points. The energy dispersion in the neighbourhood of these points is linear, and the energy surfaces are in the shape of Dirac cones. The implication of all this is that the charge carriers would behave as two-dimensional (2D) massless chiral Dirac fermions [5], and possess their rich physical properties. Recently device engineers are also showing interest in graphene, because of its exceptional two-dimensional character and high-carrier mobility [6]. However, the zero-gap spectrum renders graphene a semimetal, which is a limitation for applications in logic circuits.
Hydrogen interaction with graphene is of diverse interest, and has been the subject of many theoretical and experimental investigations. As recent studies have shown, hydrogen functionalization may induce a metal-insulator transition in graphene [7] and open a bandgap in its electronic spectrum [8, 9, 10]. Another interesting property, with potential applications in spintronics, is the emergence of magnetism in graphene materials due to interaction with hydrogen [11]. In addition, hydrogen adsorbates are believed to be a dominant source of scattering in graphene that limits its electron mobility [12, 13]. These and other fascinating properties provide the motivation to study and understand hydrogen interaction with graphene.
Much of the understanding of hydrogen adsorption on graphene has come through density-functional theory (DFT) calculations [14, 15, 16, 17, 18, 19]. Thus it has been shown that hydrogen chemisorbs on graphene in an atop position, causing partial sp2 to sp3 rehybridization, and creating a pz orbital vacancy in the process (figure 1). This implies that hydrogen and vacancy defects have some common properties, such as magnetic moments and resonant scattering. The effect on the electronic structure, calculated by DFT on graphene supercells with a single hydrogen adsorbate, is the appearance of a pair of spin-polarized states within a bandgap opened around the Dirac point. Other changes include the appearance of spin densities in the graphene plane in a characteristic texture centred on the adsorption site which can be resolved by scanning tunneling microscopy (STM) [16]. The midgap state is a universal feature of resonant scatterers shared by other covalently-bonded adsorbates, including CH3, NH2, OH, and F [20], making H/graphene a prototype of a wider class of systems. DFT calculations have been supplemented by semiempirical tight-binding (TB) model to extend to larger number of atoms than can be handled in first-principles calculations. This model has been used in the study of an isolated hydrogen adsorbate [21] and random distributions of hydrogen adsorbates [22].
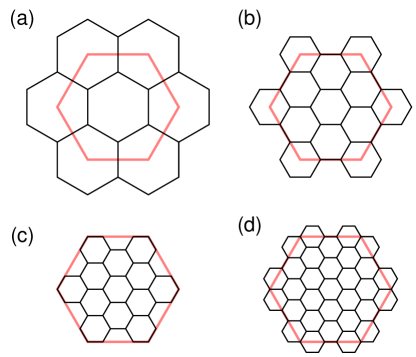
Recently, it was shown that bandgap opening has a strong dependence on the periodicity of the hydrogen arrangement on graphene [23], so that the bandgap is much smaller for certain periodicities than expected. The existence of different cases with respect to bandgap opening can be explained on the basis of the geometrical relationship between the Brillouin zones of graphene and its periodic superstructures (figure 2), although the precise changes to the band structures would require numerical calculations. In this paper, we focus on DFT calculations of the band structure of graphene with a single hydrogen adsorbate on periodically repeated unit cells in order to study the predicted dependence of bandgap effects on periodicity. We find that for the special periodicities the bandgap is suppressed to a great extent, particularly when spin polarization is neglected. Within spin-polarized calculation, the bandgap is somewhat wider, and has a distinct and notable structure, not predictable within the commonly used simple tight-binding model. We attempt to explain the origin of these effects based on tight-binding models extracted from ab initio Hamiltonian matrices. This approach is similar to the one used for an accurate tight-binding description of graphene [24]. We remark that the alternative semiempirical TB parameters, obtained by fitting to DFT derived band structures, turn out to be very different from the ab initio parameters. It seems, therefore, necessary to compare more closely the results obtained from semiempirical models and first-principles calculations wherever possible.
The rest of the paper is organized as follows. In section 2 we describe the computational details. In section 3 we present the results and discuss their salient features. In the final section we present a summary and our conclusions.
2 Computational method
For the choices of and unit cells of graphene with a hydrogen atom adsorbed on top of one of the carbon atoms, as shown in figure 1, we obtain the electronic structure using DFT calculations. For all the calculations we used the Siesta DFT code, an efficient code that allows us to study relatively low adsorbate coverages of H/graphene, with supercells of up to a few hundred carbon atoms. The calculations use a basis set of numerical atomic orbitals [25], norm-conserving pseudopotentials [26], and the generalized gradient approximation (GGA) of exchange-correlation density functional [27]. The use of localized atomic orbitals in Siesta makes it convenient to extract tight-binding matrix elements from the Hamiltonian matrix. Our calculations use the diagonalization-based method of solving the Kohn-Sham equations and include both restricted and unrestriced spins. We chose a separation of Å between repeated slabs, to represent the 2D systems, and for -point sampling we used various Monkhorst-Pack grids [28] typically corresponding to points in the graphene Brillouin zone ( included). The systems were fully relaxed, until the atomic forces were smaller than 0.01 eV/Å, before calculation of the band structure and density of states. We used basis sets of double- plus polarization (DZP) quality for most of the results reported, and also single- (SZ) quality, to reduce computing time, for some of the data involving larger systems.
3 Results
Our systems consist of periodically repeated supercells containing one hydrogen adsorbate and an integral number of graphene unit cells (figure 1). This configuration is commonly used to describe single hydrogen adsorption on an infinite graphene, under the assumption that if the supercell is large enough, say , H adsorbates may be considered as isolated from each other. Various properties, however, do depend on the scale of the supercell, as we demonstrate in this section.
Figure 1 shows two samples of hydrogenated graphenes, and , which show the periodic arrangement and also happen to represent special periodicities, to be explained below. Since it has been established that covalently bonded hydrogen chemisorbs on top of a carbon atom we simply used this placement in our calculations, and allowed our DFT code to perform structural relaxation to find the bond lengths and angles. We found results in agreement with previous calculations, where the H-C bond is 1.13 Å, and the C-C bond elongates from 1.42 Å to 1.51 Å as a result of sp2 to sp3 rehybridization. The bond angles do not form the perfect tetrahedral angles of 109.5∘, but have a mixed character between the two types of hybridization and, furthermore, they may depend on hydrogen concentration.
Our focus is on the changes made to the band structure as a result of hydrogen adsorption, and on the understanding of their underlying causes. Toward this end it is useful to compare with the simple spinless tight-binding model that describes hydrogen adsorption on graphene and includes only bands,
| (1) |
Typical values are eV for hopping between the carbon 2pz orbitals, eV for the hydrogen 1s orbital on-site energy relative to that of carbon 2pz, and eV for hopping between H and C orbitals [20]. This is a semiempirical model whose parameters were derived by fitting particular DFT band structure calculations, and it provides a useful description of the midgap resonance.
If we use the tight-binding model given by (1) to calculate the band structures for or hydrogenated graphenes we find bandgap openings at their respective K points and an almost dispersionless midgap band. On the other hand, if we use it to calculate the band structure for and coverages no bandgap opens, while the degeneracy point shifts to the point with the additional low-dispersion midgap band passing through it. These and structures, which have unit cells that contain and unit cells of graphene, respectively, are somewhat exceptional because the hydrogen adsorption fails to open an expected gap in their band structure. The difference between these and the ordinary cases can be deduced from the Brillouin zone structures drawn in figure 2. As shown in figures 2(a) and (b), related to and , respectively, both K points of graphene coincide with the point of the hydrogenated graphene for these structures. As a result there is a four-fold degeneracy at the point in the centre of the Brillouin zone. On the other hand, for the other structures, and , shown in figures 2(c) and (d), the K points of graphene coincide with the K points of hydrogenated graphene at the corner of the Brillouin zone. As bandgap opening due to periodic perturbations occur on the boundaries of the Brillouin zone, the above observation accounts for the dependence of bandgap opening on periodicity. Such a phenomenon can also be seen in alkali metal adsorption, which have different bonding properties and most notably adsorb on the hollow sites of graphene instead of the top sites [29]. For alkali metals, however, the situation is reversed in that band-gap opening is absent for the regular cases, and occurs instead for the periodicities that involve a multiple of 3.
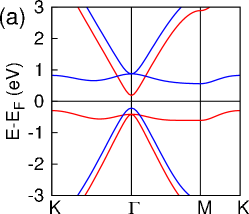
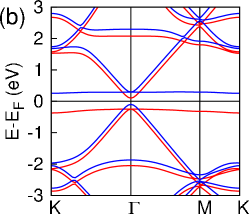
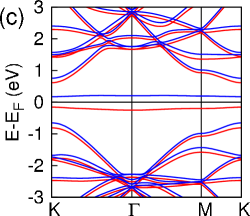
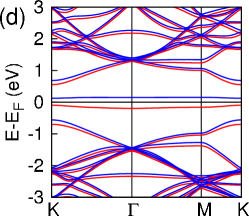
We can now examine band structures for the coverages discussed above calculated numerically using spin-polarized DFT. All four band structures, shown in figure 3, have spin-polarized bands indicating a magnetic moment of 1 per unit cell, with the exchange splittings that decrease as H concentration is reduced. Figures 3(a) and (b) for and coverages show small, but finite, bandgap openings at the point. The shift of the neutrality point and gap opening to the point is in agreement with the analysis in terms of the Brillouin zones. But in contrast with the simple TB model which gives zero bandgap, here there is a small bandgap due to additional symmetry breakings induced by H adsorption. Figures 3(c) and (d) show the regular cases of and coverages where graphene bands open a gap at the K point and there is a pair of spin-polarized midgap bands. The projected densities of states of corresponding to the band structure is also shown in figure 4(a). The energy bands around the gap in figures 3(a) and (b) have an intricate structure. The majority up-spin midgap state is degenerate with the top of the graphene band at point below the Fermi energy, and the same is mirrored for the minority down-spin midgap state and the bottom of band above the Fermi energy. The origin of this structure must be an additional symmetry breaking not accounted for in the TB model of (1).
An AB sublattice symmetry breaking can be expected on account of the formation of spin and charge textures due to hydrogen chemisorption [see figure 4(b) and reference 16]. We can uncover it by examining the ab initio Hamiltonian matrix [24], of which we list the most important elements in table 1 [30]. If we use a tight-binding model based on this table, we can reproduce the bandgap level structures of figures 3(a) and (b). The AB symmetry breaking is clearly seen in the spin-dependent on-site energies, which are tabulated for the 1s orbital of H, and a set of 2pz orbitals of C atoms, indexed with 0, 1, 2, and 3, which includes the adsorption site and its three nearest neighbours [they occupy the triangular shape in figure 4(b)]. Note that the even indices refer to the sublattice of the adsorption site, and the odd indices to the complementary sublattice. Setting aside the singular C0 for the time being, the AB sublattice symmetry breaking is manifested in the on-site energies for the three C1, the six C2, and the three C3 sites. In particular, for up-spin parameters the energy of C2 is higher than those of C1 and C3. For the down-spin parameters the sense of symmetry breaking is reversed with energy of C2 lower than those of C1 and C3. It is precisely this ordering that lifts the degeneracies of and coverages in the manner shown in figure 3.
Returning to the case of C0, we note that its on-site energy has been shifted down by more that 2 eV relative to the other carbon atoms. We also see that the C0-C1 hopping is suppressed by nearly 1 eV relative to its value for clean graphene, which is eV for the basis set used in our calculation. The usual description of the effect of hydrogen chemisorption on the electronic structure of graphene is that it removes a pz orbital from the system of graphene [11, 16]. As a consequence a quasi-localized state is formed which populates the complementary lattice. This in turn gives rise to a midgap energy level near the Fermi energy which makes the system unstable with respect to spin polarization. The shifted values of the on-site energy and the hoppings in table 1 that make C0 different from other C atoms provide quantitative parameters for this description.
Finally, from table 1 we note that the on-site energy of H is a few electron-volts below those of the carbon atoms, which is what we expect when we think in terms of atomic orbitals. This is another important difference with the semiempirical model of (1), where eV. The TB model (1), however, provides a better description of a dispersionless midgap band near the Fermi energy. The shortcoming of the present ab initio model is that next-neighbor hoppings and overlap matrices have been neglected. We may note that up to third nearest-neighbor hoppings and overlaps had to be included for an accurate TB description of graphene [24].
| Onsite energies | Hoppings | ||||||
|---|---|---|---|---|---|---|---|
| Equivalent | |||||||
| Atom | sites | (eV) | (eV) | Bond | (eV) | (eV) | |
| H | 1 | H-C0 | |||||
| C0 | 1 | C0-C1 | |||||
| C1 | 3 | C1-C2 | |||||
| C2 | 6 | C2-C3 | |||||
| C3 | 3 | ||||||
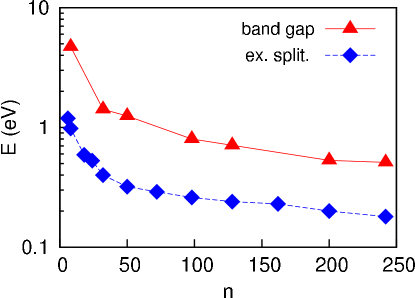
For periodic arrangement of defects it has been shown that the width of the bandgap is inversely proportional to defect concentration [31]. Our calculations provide the data to study this dependence. Thus we plot the bandgap, and exchange splittings, defined as the difference between the spin-polarized midgap bands measured between the peaks of the density of states [16], as a function of number of C atoms in the supercell, carbon atoms for coverage, and find a similar trend of for both quantities in figure 5. Our values of exchange splittings are in favorable agreement with the value of 0.23 eV for a hydrogen concentration of 0.5% given in other calculations [16].
4 Conclusions
We have made density-functional theory calculations of graphene with periodic arrangements of hydrogen adsorbates. Our focus was to explore and explain the changes made to the electronic band structure of graphene as a result of hydrogen adsorption. The important features include bandgap opening and the emergence of spin-polarized midgap bands, which we have collectively described as bandgap effects. Our primary purpose was to examine the dependence of bandgap effects on hydrogen periodicity, or coverage, within spin-polarized density-functional theory. We showed that for periodicities divisible by or bandgap opening has a different behaviour than for , , and, in general, for periodicities not divisible by 3. We illustrated that the existence of different classes has purely geometrical reasons. In addition, the changes to the band structures have special features, which we explained on the basis of the AB sublattice symmetry breaking that is caused by hydrogen adsorption. A secondary purpose was to gain a deeper understanding of bandgap effects by examining the ab initio Hamiltonian matrix elements. The tight-binding parameters obtained by this approach reveal the AB sublattice symmetry breaking, as well as the origins of the midgap bands. These parameters are physically more meaningful than those of the simple semiempirical model and may be developed into a more accurate tight-binding description of hydrogen adsorption on graphene.
References
References
- [1] Novoselov K S, Geim A K, Morozov S V, Jiang D, Zhang Y, Dubonos S V, Grigorieva I V, and Firsov A A 2004 Science 306 666
- [2] Novoselov K S, Geim A K, Morozov S V, Jiang D, Katsnelson M I, Grigorieva I V, Dubonos S V, and Firsov A A 2005 Nature 438 197
- [3] Zhang Y, Tan Y W, Stormer H L, and Kim P 2005 Nature 438 201
- [4] Wallace P R 1947 Phys. Rev. 71 622
- [5] Castro Neto A H, Guinea F, Peres N M R, Novoselov K S, and Geim A K 2009 Rev. Mod. Phys. 81 109
- [6] Schwierz F 2010 Nature Nanotech. 5 487
- [7] Elias D C et al 2009 Science 323 610
- [8] Balog R et al 2010 Nature Mater. 9 315
- [9] Haberer D et al 2010 Nano Lett. 10 3360
- [10] Haberer D et al 2011 Phys. Rev. B 83 165433
- [11] Yazyev O V 2010 Rep. Prog. Phys. 73 056501
- [12] Ni Z H et al 2010 Nano Lett. 10 3868
- [13] Katoch J, Chen J-H, Tsuchikawa R, Smith C W, Mucciolo E R, and Ishigami M 2010 Phys. Rev. B 82 081417
- [14] Jeloaica L and Sidis V 1999 Chem. Phys. Lett. 300 157
- [15] Duplock E J, Scheffler M, and Lindan P J D 2004 Phys. Rev. Lett. 92 225502
- [16] Yazyev O V and Helm L 2007 Phys. Rev. B 75 125408
- [17] Boukhvalov D W, Katsnelson M I, and Lichtenstein A I 2008 Phys. Rev. B 77 035427
- [18] Casolo S, Løvvik O M, Martinazzo R, and Tantardini G. F. 2009 J. Chem. Phys. 130 054704
- [19] Vergés J A and de Andres P L 2010 Phys. Rev. B 81 075423
- [20] Wehling T O, Yuan S, Lichtenstein A I, Geim A K, and Katsnelson M I 2010 Phys. Rev. Lett. 105 056802
- [21] Farjam M, Haberer D, and Grüneis A 2011 Phys. Rev. B 83 193411
- [22] Yuan S, De Raedt H, and Katsnelson M I 2010 Phys. Rev. B 82 115448
- [23] García-Lastra J M 2010 Phys. Rev. B 82 235418
- [24] Reich S, Maultzsch J, Thomsen C, and Ordejón P 2002 Phys. Rev. B 66 035412
- [25] Soler J M, Artacho E, Gale J D, García A, Junquera J, Ordejón P, and Sánchez-Portal D S 2002 J. Phys.: Condens. Matter. 14 2745
- [26] Troullier N and Martins J L 1991 Phys. Rev. B 43 1993
- [27] Perdew J P, Burke K, and Ernzerhof M 1996 Phys. Rev. Lett. 77 3865
- [28] Monkhorst H J and Pack J D 1976 Phys. Rev. B 13 5188
- [29] Farjam M and Rafii-Tabar H 2009 Phys. Rev. B 79 045417
- [30] Obtaining the ab initio tight-binding parameters does not need any extra calculations, because the Hamiltonian, overlap matrices, etc., are printed by Siesta to special files, SystemLabel.HSX in binary format, and DMHS.nc in NetCDF format. Our task is only to open either of these files with appropriate tools and read the selected elements.
- [31] Martinazzo R, Casolo S, and Tantardini G F 2010 Phys. Rev. B 81 245420