The analysis of the hydrogen broad Balmer line ratios: possible
implications to the physical properties of the BLR of AGN
Abstract
Aims. We analyze the ratios of the broad hydrogen Balmer emission lines (from H to H) in the context of estimating the physical conditions in the broad line region (BLR) of active galactic nuclei (AGN).
Methods. The Balmer emission lines are obtained in three ways: i) using photoionization models obtained by a spectral synthesis code CLOUDY; ii) calculated using the recombination theory for hydrogenic ions; iii) measured from the sample of observed spectra taken from the Sloan Digital Sky Survey database. We investigate the Balmer line ratios in the frame of the so called Boltzmann-plot (BP), analyzing physical conditions of the emitting plasma for which we could use the BP method. The BP considers the ratio of Balmer lines normalized to the atomic data of the corresponding line transition, and is in that way different from the Balmer decrement.
Results. We found that for a certain range of thermodynamic parameters, there are objects that follow the BP. These AGN may have a BLR consisting of mostly high density plasma.
Key Words.:
galaxies: active – (galaxies:) quasars: emission lines – line: formation – plasmas1 Introduction
The investigations of the broad line region (BLR) structure (size, geometry, physics, etc.) of active galactic nuclei (AGN) are nowadays still important. One of the main implications is the accurate estimate of the mass of the super-massive black hole (SMBH) in the center of an AGN, since it can be derived from the dynamics of BLR gas, gravitationally bound to the SMBH (see e.g. McGill et al., 2008; Bentz et al., 2010). After several decades of research, our view of the physics and structure of the BLR is improving, but we still lack a full understanding of its properties (see e.g. Baldwin, 1997; Sulentic et al., 2000; Gaskell, 2009, for a review). It is obvious from the broad emission line (BEL) fluxes and profiles that the BLR physics and kinematics are more complicated than in the narrow line region (NLR) or other nebular environments (see e.g. Krolik, 1999; Sulentic et al., 2000; Osterbrock & Ferland, 2006, and references therein), and they are even closer to the conditions in stellar atmospheres than in gaseous nebulae (Osterbrock & Ferland, 2006).
Most of the BLR gas is photoionized. This was first inferred by the approximately constant value of the H equivalent width in several AGN (Osterbrock, 1978) and then confirmed by reverberation studies showing a direct response of the BEL fluxes to the continuum flux changes (see e.g. Peterson, 1994). So far there have been numerous attempts to describe the BLR physics and to explain the emission-line spectrum by means of photoionization models (see e.g. Netzer, 1975; Davidson & Netzer, 1979; Kwan & Krolik, 1981; Collin-Souffrin, Dumont & Tully, 1982; Rees, Netzer & Ferland, 1989; Baldwin et al., 1995, 1996; Dumont, Collin-Souffrin & Nazarova, 1998; Ferland et al., 1998; Krolik, 1999; Marziani et al., 2001; Ferland, 2003; Korista & Goad, 2004; Leighly & Casebeer, 2007; Snedden & Gaskell, 2007; Marziani et al., 2010). Today there are roughly half a dozen major codes, that were continuously developed since the 1970s (see e.g. Ferland & Savin, 2001, for a review). Although such numerical simulations largely improved in the course of years, the investigations of the BLR still contain some important unresolved problems (see e.g. Ferland, 1999). One of the most interesting concerns the observed small ratio among the Ly and H lines (usually in the range of 5 - 15), while models predict much higher values (30 - 50) (see e.g. Netzer et al., 1995, and references therein). Another important finding is that there are indications for a physical complexity of the BLR, which could result from the combination of distinct components, as suggested, for instance, by the origin of “high” and “low ionization lines” (see e.g. Collin-Souffrin & Lasota, 1988; Baldwin, 1997; Sulentic et al., 2000), but also according to the complex profiles of single lines, that cannot be explained in terms of a simple single-region model (see e.g. Popović et al., 2004; Popović, 2006b; Bon et al., 2009; Gaskell, 2009).
Different BELs are originated at various distances from the central continuum source and under a wide range of physical conditions (see e.g. Sulentic et al., 2000). The BLR is of high density, thus the collisional excitation, self-absorption, dust obscuration and complicated coupling of line and continuum radiation transfer should be taken into account in the calculation of the resulting spectrum (see e.g. Baldwin, 1997). In such circumstances, the general spectroscopic techniques, commonly adopted to estimate physical conditions in nebular environments, cannot be applied. Some clues, such as the observed Fe II emission, suggest that K, since at higher temperatures it would be effectively suppressed by collisional ionization to Fe III (Osterbrock & Ferland, 2006). However it is very likely that the Fe II emission only affects a fraction of the BLR (see e.g. Marziani et al., 2001; Ilić et al., 2009; Popović et al., 2009; Kovačević et al., 2010, and references therein). The electron density is estimated to be in the range , in order to suppress the emission of broad forbidden lines, while still allowing for the presence of permitted and semi-forbidden ones (Osterbrock & Ferland, 2006). For example, for the upper limit the CIII] 1909 emission line implies that the densities cannot be higher than 1011-13 cm-3, though strong UV lines like Fe II or Al III 1860 suggest somewhat higher density, at least in the low ionization region (Baldwin et al., 1996; Laor et al., 1997; Negrete et al., 2011).
There are not many proposed methods in the literature that include observations of the BELs to determine the BLR physical properties (Marziani et al., 2001; Laor, 2006). Marziani et al. (2001) found, using the CLOUDY photoionization computation, that the ratio of Si III] 1892 and C III] 1909 UV emission lines is a good density diagnostic in the density range . And since that ratio is correlated with the width of the broad H line, they gave a relationship for the estimates of the electron density in the BLR using either the ratio of these semi-forbidden lines or the width of the broad component of the H line (Marziani et al., 2001). The same authors extended their analysis and analyzed the physical conditions using other line ratios (e.g. Al III 1860/Si III]1892, Si III]1892/C IV1549, Mg II2800/Ly, etc.) trying to exploit the CLOUDY simulations to deduce constraints on ionization parameter, density and column density (Marziani et al., 2010). Also, Laor (2006) proposed a method that considers the electron scattering influence on the line profiles and determines the physical parameters of the BLR in the case of low luminosity AGN with the emission-line profiles having exponential wings (e.g. the case of galaxy NGC 4395). The method assumes that the exponential wings are produced by the optically thin, isotropic, thermal electron scattering. In that case, by fitting the line wings with an electron-scattering model, one can estimate the electron density and optical depth of the region (Laor, 2006). Both described methods are observationally constrained for either needing the UV observations or detecting BEL with strong exponential line wings to extract a direct estimate.
On the other hand, Popović et al. (2002); Popović (2003, 2006a) suggested that the Boltzmann-plot (BP) method (see §2 for more details), already well known to laboratory diagnostics of high density plasma (Griem, 1997), might be exploited to probe the BLR of some AGN (see also Ilić et al., 2006; La Mura et al., 2007; Popović et al., 2008). By measuring the flux of emission lines belonging to a specific transition series, such as the hydrogen Balmer line series in the optical domain (Popović, 2003), and using the corresponding atomic parameters, the technique provides an estimate of the plasma temperature. For example, in case of NGC 5548 the BLR temperature was estimated using the BP applied to the Balmer lines observed from 1996 to 2004 (Popović et al., 2008). A high correlation between the variation of the optical AGN continuum and the BP temperature is found (Popović et al., 2008).
The main motivation of this paper is to investigate under which particular circumstances the Balmer line ratios and BP method may, or may not, be used to explore the physical conditions of the BLR, given that photoionization is expected to control the plasma physical properties. To clarify this, we compare the hydrogen Balmer lines (from H up to H), that we obtained in three different ways: i) from a grid of several numerical models, computed using the CLOUDY spectral synthesis code (Ferland et al., 1998) and analyzing the properties of the resulting spectra; ii) by considering the calculated emission line intensities predicted in the framework of the recombination theory (Storey & Hummer, 1995a), and iii) analyzing a set of observed spectra taken from the Sloan Digital Sky Survey (SDSS) database (La Mura et al., 2007).
The paper is organized as follows: in §2 we present the application of the Balmer line ratios through the Balmer decrement and BP method, in §3 we describe the grids of models generated with the CLOUDY code and report the results of the models, and we describe and analyze the theoretical recombination emission line, in §4 we report on the observed SDSS spectra, in §5 we provide discussion and finally, in §6 our conclusions are given.
2 The ratios of the hydrogen Balmer lines - indications of the BLR physical properties
The hydrogen Balmer lines are the brightest recombination lines in the optical spectra of AGN. They are usually showing complex line profiles, composed from the narrow and broad component. Here we discuss only the broad component, coming from the BLR.
2.1 The Balmer decrement
The hydrogen Balmer decrement - H/H - ratio can be used to probe the physics of the line-emitting plasma (Kwan & Krolik, 1979, 1981; Mathews, Blumenthal & Grandi, 1980; Canfield & Puetter, 1981; Dong et al., 2008; Jin et al., 2012). It is most frequently used to determine the amount of dust extinction for the low-density gas, such as the narrow line region (NLR) in AGN Osterbrock & Ferland (2006), where a value of 3.1 for H/H ratio is generally adopted. This is slightly higher than the standard case B recombination value as the H emission is enhanced due to collisional effects and harder ionizing continuum Gaskell & Ferland (1984); Osterbrock & Ferland (2006).
The densities in the BLR are far higher, as discussed above, so that the H/H ratio might be affected by high-density effects or wavelength-dependent extinction by dust (see e.g. Osterbrock, 1984; Goodrich, 1995). The observed broad-line H/H ratio of most broad-line AGN is usually larger (steeper) than the Case B recombination value (see e.g. Osterbrock, 1977; Rafanelli, 1985; Dong et al., 2005), sometimes even as steep as 10 or higher (Osterbrock, 1981; Crenshaw, Peterson & Wagner, 1988). Dong et al. (2008) obtained the averaged value of the broad-line Balmer decrement of 3.06, for a large, homogeneous sample of 446 low-redshift (z0.35) blue type 1 AGN with the minimal dust extinction effects. They argue that the broad-line H/H ratio can be used as dust extinction estimator, even for the BLR, especially for the radio-quiet AGN (Dong et al., 2008).
On the other hand, in several monitoring campaigns, the Balmer decrement is found to vary, usually anti-correlated with the continuum flux, in a single object (Shapovalova et al., 2004, 2010; Popović et al., 2011), but often exhibiting complicated behavior depending on the state of the activity in the AGN. In case of NGC 4151, it varied from 2 to 8 during 11 years (Shapovalova et al., 2008), usually decreasing when the continuum increases, but staying constant in case of high continuum flux. A similar effect was detected in the case of 3C 390.3: for the low activity period the Balmer decrement is anti-correlating with the continuum, while in the outbursting phase with higher values of the continuum flux, it stays almost constant with the value of 4.5 (Popović et al., 2011). Thus the changes in the Balmer decrement might indicate that sometimes the line production is not fully governed by the input ionizing continuum coming from the accretion disk, i.e., the main cause of the Balmer decrement variations is not related to the active nucleus and the shock initiated emission is probably dominant (Shapovalova et al., 2010). Or in addition to the physical conditions across the emitting region or input ionizing flux, the size of the emitting regions could play an important role (Popović et al., 2011). Concerning the intrinsic host galaxy reddening in these galaxies, we might expect that during the considered time interval, the intrinsic reddening can be neglected, because it should not vary too much for such a relatively short period (10 years). Of course, the effects of dust within the BLR might still be present.
As we noted above, the Balmer decrement (only the H/H ratio) may indicate some physical processes in the BLR, but it is better to take into account the ratios of more lines from the Balmer series. One way to consider ratios of several lines is to use the Boltzmann-plot. We give a short outline of the BP method in the next Section.
2.2 The Boltzmann-plot
If a plasma extending over a region of length emits along the line of sight, assuming that the temperature and emitter density do not vary too much, the flux of a transition from an upper level to the lower can be calculated as (Griem, 1997; Konjević, 1999; Popović, 2003, 2006a; Popović et al., 2008):
where is the transition wavelength, is the statistical weight of the upper level, is transition probability, is the averaged total number density of radiating species which effectively contribute to the line flux without being absorbed, is the partition function, is the energy of the upper level, is the averaged excitation temperature, and , , and are the Planck constant, the speed of light, and the Boltzmann constant, respectively. Eq. (1) additionally assumes that the occupation number of the upper level in the transition follows the Saha-Boltzmann distribution, the lines are optically thin, and the line series originates in the same emitting region (for more detailed derivation and discussion on these assumptions see Popović, 2003, 2006b; Popović et al., 2008).
Introducing a “normalized” line-flux , with respect to the atomic constants which characterize the transition:
we see from Eq. (1) that it is possible to write:
where, considering lines that belong to a specific transition series, and represent the Boltzmann-plot parameters, with being a characteristic constant of the transition series and is called the temperature parameter.
Therefore, taking into account a specific line series, such as the Balmer lines, if the populations of the upper energy states ()111Since the emission deexcitation goes as it is not necessary that level has the Saha-Boltzmann distribution. follow a Saha-Boltzmann distribution, Eq. (3) provides an estimate of the average excitation temperature in the region where the lines are formed. In the case of a low density environment, where the narrow lines come from, the above assumptions do not apply (see Popović, 2003), but for higher densities in the BLR plasma, the approximation might be reasonable. The Balmer line ratios are less sensitive to temperature changes at higher temperatures (Griem, 1997). For further analysis we adopt the maximal value of the BP temperature to be 30,000 K, as the BLR temperature should be lower than that (Osterbrock & Ferland, 2006).


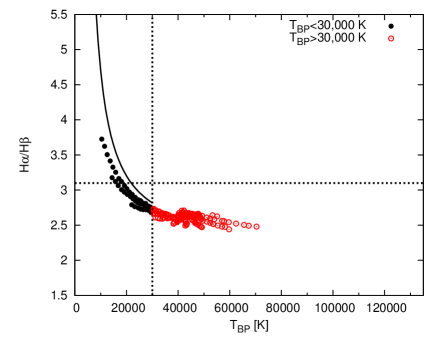
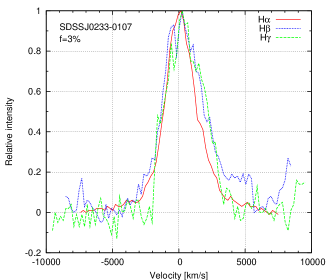
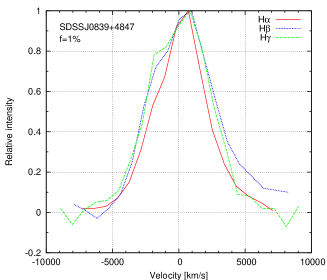
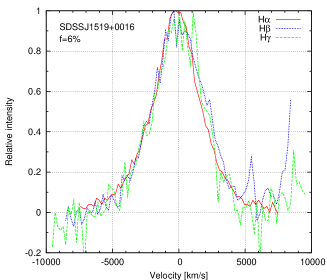
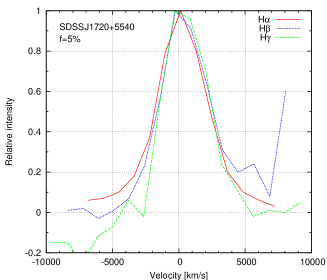
The Boltzmann-plot should not be confused with the Balmer decrement, as it considers line-ratio normalized using the atomic parameters of the specific line transitions. However, all discussion presented for the Balmer decrement in the previous section, applies for the BP since the line ratios could be highly influenced by the dust effects. On the other hand, the BP method has the clear advantage to require only the measured Balmer line fluxes to estimate the excitation temperature. But one has to consider some possible drawbacks, concerning the use of emission lines to infer the BLR physical properties, which in general appear in all methods that use BEL parameters for plasma diagnostics. Since the BEL profiles are complex, the estimate of their fluxes should deal with the possibility of a multiple-component structure in the BLR, as stated in previous section. Furthermore, there are some indications suggesting that the Balmer lines do not necessarily have to arise strictly from the same region, as it is pointed out by some differences in the profiles of H and H (see e.g Shapovalova et al., 2008; Popović et al., 2011). Finally, different mechanisms may contribute to the formation of the emission lines and, though photoionization is the main heating source, other processes might be relevant. The combination of these effects implies that the actual properties of the BLR may or may not fit in the fundamental assumptions of the BP method, as it is illustrated in the examples plotted in Fig. 1.


3 Simulated and theoretical Balmer line ratios
3.1 Simulation of photoionized region and modeled Balmer lines
Numerical simulations make it possible to understand complex physical environments starting from fundamental principles of physics. This is particularly applicable in the case of the BLR where due to different physical conditions in the plasma (especially high density), many physical processes should be taken into account. To model such a complex physical scenario, our choice was to use CLOUDY222All details related to this code can be found at: http://www.nublado.org/ (Ferland et al., 1998). Collisional effects, including excitation and de-excitation, continuum fluorescence, recombination, etc., are all accounted for in this code (Ferland et al., 1998; Ferland, 2006).
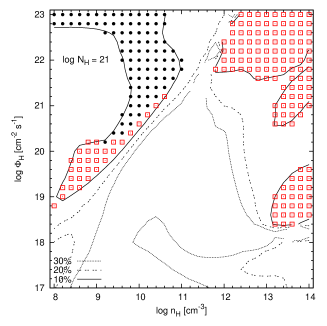

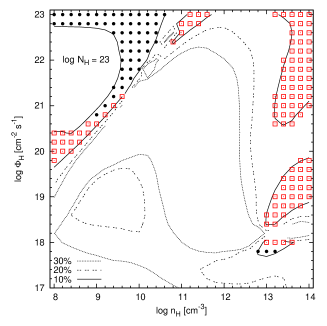
In order to investigate the Balmer lines, we generate grids of photoionization models of the BLR using the version C08.00 of CLOUDY (Ferland et al., 1998; Ferland, 2006). This version is roughly a factor of 2 slower than C07.02, due to a major expansion in the physics of the H-like iso-sequence. The l-levels of the H-like sequence are now fully resolved, making these atoms formally correct, thus the predicted H I emission line spectrum is changed with respect to the C07.02. Input parameters for the simulations are chosen to match the standard conditions in the BLR (Ferland, 2006; Korista & Goad, 2000, 2004). Assuming to have solar chemical abundances and constant hydrogen density, and using the code’s AGN template for the incident continuum shape (a continuum similar to the typical radio quiet active galaxies), we compute an emission line spectrum for the coordinate pair of hydrogen gas density and hydrogen-ionizing photon flux .
The grid dimensions span 6 orders of magnitude in each direction and, with an origin in , and a step of 0.2 dex increments, produced a total of 961 simulations per grid. The column density is kept constant in producing the grid of simulations. Many authors claim that the most probable value of the column density in the BLR is (Dumont, Collin-Souffrin & Nazarova, 1998; Korista & Goad, 2000, 2004). Since the column density defines the optical thickness of the region, here we produce 3 grids of models changing the column density between . Therefore, the total number of simulations is 2883.
The output of the code includes all lines333By default, the code gives line fluxes normalized to the H flux. Since it has no influence in the BP analysis, we have used the normalized values. formed in the emitting region, with a given chemical composition, hydrogen density, and hydrogen-ionizing photon flux. We consider in our analysis the strongest hydrogen Balmer lines (H to H).
3.1.1 Modeled line ratios
For every grid of CLOUDY models, we analyze the emission line fluxes by applying the BP method to the Balmer lines. In particular, using Eq. (3), we estimate the parameter , from which we then calculate the BP temperature (hereinafter denoted as ) of the emitting region and the error associated to the best fit in the BP, which we denote as .
A few examples of the BP applied on the simulated Balmer lines for a column density of are presented in Fig. 2. In most of the cases a satisfactory fit of the Eq. (3) is not obtained and has pretty large values. This is more noticeable in the plots of in the hydrogen density and ionizing flux plane for all 3 grids of models, illustrated in Fig. 3. It can be seen in Fig. 3 that the input parameters , for which was smaller than 10% are well constrained (open squares in Fig. 3), and in a similar range for different column densities. The realistic models for which K (denoted with full circles in Fig. 3) have a very high ionization parameter (low density and high input ionization flux), except for a couple of cases with high densities appearing at higher column densities.
3.2 Theoretical line ratios
We consider also theoretical recombination Balmer lines calculated by Hummer & Storey (1987, 1992); Storey & Hummer (1988, 1995a). We want to analyze the hydrogen Balmer lines obtained only by using the recombination theory, and compare them to the line ratios obtained by CLOUDY code, which, on the other hand, treats simultaneously millions of lines and physical processes, so that the behavior of the hydrogen lines might be hidden.
Storey & Hummer (1995a) calculated line emissivities, together with other line transition parameters for hydrogenic atoms, assuming both Case A and Case B recombination, and including full collisional effects for a considerably large range of temperature, density, and principal quantum numbers. Their calculated data are given in tables available in an online catalogue444http://vizier.cfa.harvard.edu/viz-bin/VizieR?-source=VI/64 (see Storey & Hummer, 1995a, b, for details)
Here we use their theoretical hydrogen Balmer lines (H to H), calculated for the Case B recombination with the density in the range (8.2–14, 0.2 dex increment), and the electron temperature lying within the range 1000 to 30,000 K (step 1,000 K). Online data provide line emissivities within this range, but only for a small number of values of density and temperature (Storey & Hummer, 1995a), for others we interpolated line emissivities using the interpolation code provided by Storey & Hummer (1995a). For the BP method we use the ratios of Balmer lines, which we could directly derive from line emissivities.
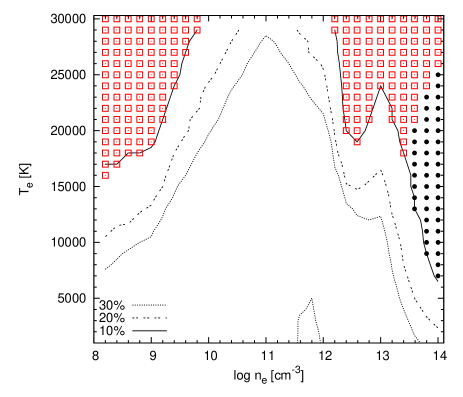
We plot the error of the BP fit for theoretical Balmer line ratios in the electron temperature and electron density plane (Fig. 4). Here we do not have the input ionizing flux which is used as an input parameter for modeled line ratios. But we can say that basically the electron temperature gives some indications about the input ionizing flux. For the theoretical line ratios, we obtain that the area is also covering a constrained area of parameter space (open squares in Fig. 4), which is resembling the one obtained from the simulated line ratios. Here the cases with K (denoted with full circles in Fig. 4) appear for high densities .
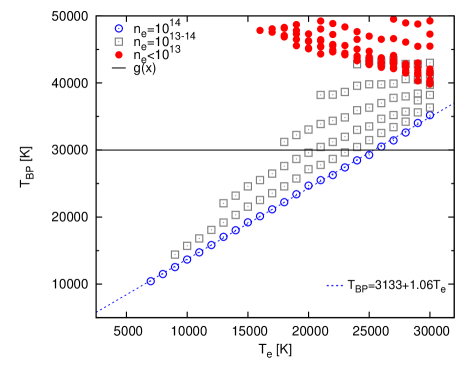
The BP temperature as a function of the electron temperature is plotted in Fig. 5, for cases when the BP fit error is less than 10%. Clearly there is a relation between these two temperatures, especially for the electron density of (open circles in Fig. 5). The BP temperature, that represents the excitation temperature is higher than the electron temperature. The linear best-fitting gives the following relation .
The Balmer decrement when follows the behavior of the Boltzmann-plot (solid line in Fig. 6). For these cases in Fig. 6 the H/H ratio is shown against the BP temperature. The solid line represents the Balmer decrement calculated for different temperatures using Eq.(1), and it is shown only for temperatures smaller than 30,000 K. The averaged H/H is 2.96 for cases when K (full circles in Fig. 6).
4 Observed line ratios
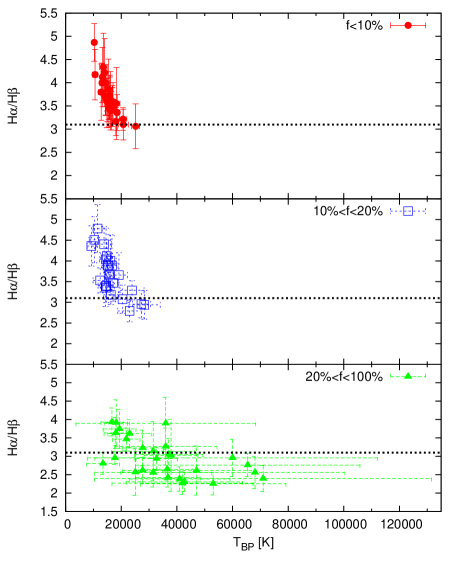
We explore the usage of the BP method on the observed data. For that we consider measurements performed on a sample of 90 broad-line-emitting AGN, taken from the SDSS spectral database. For this sample the Balmer line parameters were accurately estimated considering the complexity of BEL (see La Mura et al., 2007, for details). We repeat here that the line fluxes are corrected for the Galactic extinction, as well as for the host galaxy contribution, which is to some extent correcting for the internal dust extinction, but not for the dust effects within the BLR. The BP method, applied to the broad component of Balmer lines of this sample (Fig. 1), produces reasonably good fit uncertainties, with , in approximately 35% of cases. The BP temperatures are in the range K. We used these cases for which to calculate assuming that the electron density is and using the linear relation from Fig. 5. We obtain the electron temperature in the range K. The obtained values for both temperatures are in a good agreement with the values considered to be typical for the BLR plasma.
We plot the H/H ratio against the BP temperature for this sample of 90 SDSS galaxies (Fig. 7) denoting differently objects with different . Objects for which the BP method is working (full circles, upper panel Fig. 7) tend to have higher H/H ratio (averaged value is 3.68), in contrast to objects with high fitting error (full triangles, bottom panel 7) that mostly show low Balmer decrements, below 3.1 (dashed line, Fig. 7).
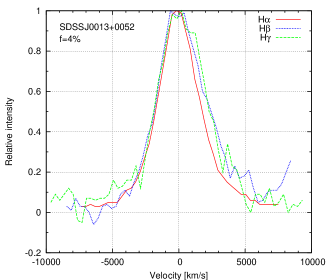
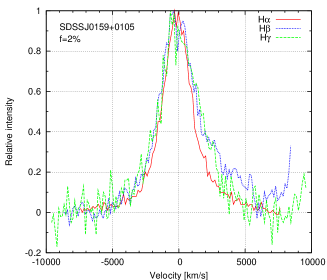
One indication of the Balmer lines optical depths can be seen if we compare their normalized-line profiles. Some examples of the line-profiles comparison from the SDSS sample of galaxies for which is plotted in Fig. 8. The H, H and H line profiles (only the broad component) are compared after being smoothed according to their spectral S/N ratio and normalized to unity. From the sample of 90 objects, objects with small BP error contain H, H and H lines which are showing similar line profiles (Fig. 8), indicating that these lines may be optically thin. One should have in mind the relatively low resolution of the SDSS, which is especially seen in the case of lines with low FWHM, whose line profiles are significantly affected by this.
5 Discussion
According to the simulation results there is a constrained parameter space, at different column densities , where the BP produces reasonable results with small fit uncertainties (). Here the cases with K (denoted with full circles, Fig. 3) that represent less than 9% of total number of simulations, are mostly falling within an area with higher ionizing fluxes and lower hydrogen densities, indicating high ionization parameters. These situations are extreme ones, thus the most favorable cases for the BP should happen for higher density, as it is seen in the case of higher column densities (Fig. 3).
A similar trend is seen in case of the theoretical line profiles (Fig. 4). Here the parameter range where the BP method is working is constrained and higher densities are preferred (Fig. 5). In these situations, even if photoionization still acts as the main heating source for the BLR, a contribution of the collisional processes may become relevant (especially for such high densities) and significantly affect the distribution of the excited energy configuration of the ions. The BP method reveals the occurrence of such circumstances and it provides an estimate of the excitation temperature, which basically describes the Boltzmann equation of the hydrogen energy levels.
In the sample of 90 broad-line-emitting sources from SDSS, there are more than 30% cases for which the BP can be applied and it gives reasonably good fit uncertainties (), we denote these object as the “BP objects”. From the observations we see that the BP objects have higher Balmer decrement (Fig. 7), with the average value of H/H=3.68. This value is higher than the averaged value of 3.06 of the broad-line Balmer decrement of Dong et al. (2008) obtained for blue type 1 AGN. Our measured Balmer decrement can indicate two situations: (i) either there is higher contribution of collisional processes, i.e. we have high density plasma in the BLR (that is also supported by the recombination theory and modeled line ratios) which has been suggested in some earlier works (van Groningen, 1987; Sivron & Tsuruta, 1993; Brotherton et al., 1994), (ii) or that such high H/H ratio is caused by the intrinsic dust extinction effects (see discussion in §2.1). On the other hand, the obtained Balmer decrements and the temperature parameter (see Eq.1) of the SDSS objects that follow the BP are not preferring high continuum luminosities (see Fig. 11 in La Mura et al., 2007). If we put this in the context of the modeling and theory findings, we can say that these objects then tend to have higher density in the BLR.
We further discuss the possible mechanism of line production in such BLR plasma, especially the requirements to have optically thin Balmer lines. We start from the basic assumption that we have higher opacities in the Lyman line series while the Balmer line series is optically thin. In such a case, the Ly line is scattered, while the Ly is almost completely suppressed. Therefore, we constantly have atoms excited to the energy level n=2. Since the energy gap between the n=2 and n=3 level is 1.9 eV, corresponding to an electron temperature of approximately 23,000 K, we have collisional excitation to the n=3 level, but also to n=4. The life-times of the levels n=3,4 are shorter than n=2, so we have the production of H and H line. Even if the life-time of the level n=2 can be also short, this level is constantly populated by Ly scattering. Therefore, the population of the energy levels in the Balmer line series may be described with the Boltzmann distribution, defined by the excitation temperature.
The line profiles of the Balmer lines in the observed “BP objects” are similar (Fig. 8), indicating that these lines are close to being optically thin. Therefore, we can state that the objects that follow the BP, the so-called “BP objects” have broad-line hydrogen Balmer lines that may originate from the BLR clouds of high density , in case the broad lines are not influenced by the intrinsic dust effects. Moreover, these so-called “BP objects” tend to have broader BEL indicating that the regions where the BP fit works should have higher emitter-velocities and be closer to the central engine (see Fig. 9 in La Mura et al., 2007).
Finally, it must be noted that the BLR plasma cannot be generally considered to be in the equilibrium regime for which the Boltzmann distribution can be used, since the density of emitters is probably not uniform across the region. The density can be expressed as (Osterbrock & Ferland, 2006): , where represents the deviation from thermodynamical equilibrium. In general, photoionization models predict that , but, taking into account the ratio of emission lines belonging to the same series, the deviation from thermodynamical equilibrium might be overtaken if the condition is met, which should be possible at least for higher energy levels (Osterbrock & Ferland, 2006).
6 Conclusions
In this paper we present a study of the Balmer line ratios of AGN and their usage as a tool to investigate physical properties of the broad line region in AGN. The main results are based on the analysis of the broad hydrogen Balmer lines (H to H). The lines are obtained from the photoionization models generated by the spectral synthesis code CLOUDY (version C08.00), calculated using the recombination theory for hydrogenic ions, and measured from the sample of observed spectra of 90 broad-line AGN from SDSS. The Boltzmann-plot is applied on all samples and the is obtained. The properties of spectra with the BP error and plasma conditions for their formation are further explored. From our analysis, we come to these conclusions:
-
i)
from the CLOUDY photoionization models we obtain that for a limited space of physical parameter (, ) the physical processes in plasma are such, that the Balmer lines follow the BP. This is the case for either very high ionization parameter (low density and high input ionization flux) or for high densities at higher column densities;
-
ii)
the recombination theory for hydrogenic ions predicts that the BP may be applicable for higher densities ;
-
iii)
from the analysis of the sample of broad line AGN from the SDSS database, it follows that the BP can be applied in 35% of cases, and the obtained BLR temperatures are in the range K.
There is a fraction of objects that follow the BP (“BP objects”) indicating that in their BLR the physical conditions provide that the populations of the hydrogen upper energy states () follow the Saha-Boltzmann distribution. These objects are thus interesting and should be further investigated (e.g. what are their UV or X-ray spectral characteristics, or what is the connection with other AGN types) and that will be the subject of our future work.
Acknowledgements.
D.I. would like to thank to the Department of Physics and Astronomy of the University of Padova, Italy for their hospitality. Also, we thank the anonymous referee for useful comments. This work was supported by the Ministry of Education and Science of the Republic of Serbia through the project Astrophysical Spectroscopy of Extragalactic Objects (#176001). Funding for the SDSS and SDSS-II has been provided by the Alfred P. Sloan Foundation, the Participating Institutions, the National Science Foundation, the U.S. Department of Energy, the National Aeronautics and Space Administration, the Japanese Monbukagakusho, the Max Planck Society, and the Higher Education Funding Council for England. The SDSS is managed by the Astrophysical Research Consortium (ARC) for the Participating Institutions. The SDSS Web Site is http://www.sdss.org/. This research has made use of NASA’s Astrophysics Data System.References
- Baldwin (1997) Baldwin, J. A. 1997, in Peterson B. M., Cheng F., Wilson A. S., eds, IAU Colloq. 159, Emission Lines in Active Galaxies: New Methods and Techniques, ASP Conf. Ser., Vol. 113. Astron. Soc. Pac., San Francisco, p. 80
- Baldwin et al. (1995) Baldwin, J. A., Ferland, G. J., Korista, K. T., Verner, D. A. 1995, ApJL, 455, 119
- Baldwin et al. (1996) Baldwin, J. A., Ferland, G. J., Korista, K. T., Carswell, R. F., Hamann, F., Phillips, M. M., Verner, D., Wilkes, B. J., Williams, R. E. 1996, ApJ, 461, 664
- Bentz et al. (2010) Bentz, M. C., Walsh, J. L., Barth, A. J. et al. 2010, ApJ, 716, 993
- Bon et al. (2009) Bon, E., Popović, L. Č., Gavrilović, N., Mura, G. La, Mediavilla, E. 2009, MNRAS, 400, 924
- Brotherton et al. (1994) Brotherton, M. S., Wills, B. J., Steidel, R., Sargent, W. L. W. 1994, ApJ, 423, 131
- Canfield & Puetter (1981) Canfield, R. C., Puetter, R. C. 1981, ApJ, 243, 390
- Collin-Souffrin & Lasota (1988) Collin-Souffrin, S., Lasota, J.-P. 1988, PASP, 100, 1041
- Collin-Souffrin, Dumont & Tully (1982) Collin-Souffrin, S., Dumont, S., Tully, J. 1982, A&A, 106, 362
- Crenshaw, Peterson & Wagner (1988) Crenshaw, D. M., Peterson, B. M., Wagner, R. M. 1988, AJ, 96, 1208
- Davidson & Netzer (1979) Davidson, K., Netzer, H. 1979, RvMP, 51, 715
- Dumont, Collin-Souffrin & Nazarova (1998) Dumont, A.-M., Collin-Souffrin, S., Nazarova, L. 1998, A&A, 331, 11
- Dong et al. (2005) Dong, X.-B., Zhou, H.-Y., Wang, T.-G., Wang, J.-X., Li, C., Zhou, Y.-Y. 2005, ApJ, 620, 629
- Dong et al. (2008) Dong, X., Wang, T., Wang, J., Yuan, W., Zhou, H., Dai, H., Zhang, K. 2008, MNRAS, 383, 581
- Ferland (1999) Ferland, G. J. 1999, in Quasars and Cosmology, ASP Conference Series, eds. G. Ferland and J. Baldwin, 162, 147
- Ferland (2003) Ferland, G. J. 2003, ARA&A, 41, 517
- Ferland (2006) Ferland, G. J. 2006, Hazy, A Brief Introduction to Cloudy 06.02, University of Kentucky Internal Report
- Ferland et al. (1998) Ferland, G. J., Korista, K. T., Verner, D. A., Ferguson, J. W., Kingdon, J. B., Verner, E. M. 1998, PASP, 110, 761
- Ferland & Savin (2001) Ferland, G. J., Savin, D. W., eds. 2001. Spectroscopic Challenges of Photoionized Plasmas, ASP Conf. Ser. 247. San Francisco: Astron. Soc. Pac.
- Gaskell (2009) Gaskell, C. M. 2009, New Astronomy Review, 53, 140
- Gaskell & Ferland (1984) Gaskell, C. M., Ferland, G. J. 1984, PASP, 96, 393
- Goodrich (1995) Goodrich, R. W. 1995, ApJ, 440, 141
- Griem (1997) Griem, H. R. 1997, Principles of plasma spectroscopy, Cambridge: Cambridge University Press
- van Groningen (1987) van Groningen, E. 1987, A&A, 186, 103
- Halpern & Steiner (1987) Halpern, J. P., Steiner, J. E. 1983, ApJ, 269, L37
- Hummer & Storey (1987) Hummer, D. G., Storey, P. J. 1987, MNRAS, 224, 801
- Hummer & Storey (1992) Hummer, D. G., Storey, P. J. 1992, MNRAS, 254, 277
- Ilić et al. (2009) Ilić, D., Kovačević, J., Popović, L. Č. 2009, New Astronomy Review, 53, 149
- Ilić et al. (2006) Ilić, D., Popović, L. Č., Bon, E., Mediavilla, E., Chavushyan, V. H. 2006, MNRAS, 371, 1610
- Jin et al. (2012) Jin, C., Ward, M., Done, C., Gelbord, J. 2012, MNRAS, 420, 1825
- Konjević (1999) Konjević, N. 1999, PhR, 316, 339
- Korista & Goad (2000) Korista, K. T., Goad, M. R. 2000, ApJ, 536, 284
- Korista & Goad (2004) Korista, K. T., Goad, M. R. 2004, ApJ, 606, 749
- Kovačević et al. (2010) Kovačević, J., Popović, L. Č, Dimitrijević, M. S. 2010, ApJS, 189, 15
- Krolik (1999) Krolik, J. H. 1999, Active Galactic Nuclei: From the Central Black Hole to the Galactic Environment, Princeton University Press, Princeton, New Yersey
- Kwan & Krolik (1979) Kwan, J., Krolik, J. 1981, ApJ, 233, L91
- Kwan & Krolik (1981) Kwan, J., Krolik, J. 1981, ApJ, 250, 478
- La Mura et al. (2009) La Mura, G., Di Mille, F., Ciroi, S., Popović, L. Č., Rafanelli, P. 2009, ApJ, 693, 1437
- La Mura et al. (2007) La Mura, G., Popović, L. Č., Ciroi, S., Rafanelli, P., Ilić, D. 2007, ApJ, 671, 104
- Laor (2006) Laor, A. 2006, ApJ, 643, 112
- Laor et al. (1997) Laor, A., Jannuzi, B. T., Green, R. F., Boroson, T. A. 1997, ApJ, 489, 656
- Leighly & Casebeer (2007) Leighly, K. M., Casebeer, D. 2007, The Central Engine of Active Galactic Nuclei, 373, 365
- Marziani et al. (2001) Marziani, P., Sulentic, J. W., Zwitter, T., Dultzin-Hacyan, D., Calvani, M. 2001, ApJ, 558, 553
- Marziani et al. (2010) Marziani, P., Sulentic, J. W., Negrete, C. A., Dultzin, D., Zamfir, S., Bachev, R. 2010, MNRAS, 409, 1033
- Mathews, Blumenthal & Grandi (1980) Mathews, W. G., Blumenthal, G. R., Grandi, S. A. 1980, ApJ, 235, 971
- McGill et al. (2008) McGill, K. L., Woo, J.-H., Treu, T., Malkan, M. 2008, ApJ, 673, 703
- Negrete et al. (2011) Negrete, C. A., Dultzin, D., Marziani, P., Sulentic, J. W. 2011, arXiv:1107.3188
- Netzer (1975) Netzer, H. 1975, MNRAS, 171, 395
- Netzer et al. (1995) Netzer, H., Brotherton, M. S., Wills, B. J., Han, M., Wills, D., Baldwin, J. A., Ferland, G. J., Browne, I. W. A. 1995, ApJ, 448, 27
- Osterbrock (1977) Osterbrock, D. E. 1977, ApJ, 215, 733
- Osterbrock (1978) Osterbrock, D. E. 1978, PNAS, 75, 540
- Osterbrock (1981) Osterbrock, D. E. 1981, ApJ, 249, 462
- Osterbrock (1984) Osterbrock, D. E. 1984, QJRAS, 25, 1
- Osterbrock & Ferland (2006) Osterbrock, D. E., Ferland G. J. 2006, Astrophysics of Gaseous Nebulae and Active Galactic Nuclei (2nd ed.), University Science Books, Sausalito, California
- Peterson (1994) Peterson, B. M. 1994, in Reverberation Mapping of the Broad-Line Region in Active Galactic Nuclei, 69, 1
- Popović (2003) Popović, L. Č. 2003, ApJ, 599, 140
- Popović (2006a) Popović, L. Č. 2006a, ApJ, 650, 1217 (an Erratum)
- Popović (2006b) Popović, L. Č. 2006b, SerAJ, 173, 1
- Popović et al. (2002) Popović, L. Č., Mediavilla, E. G., Kubičela, A., Jovanović, P. 2002, A&A, 390, 473
- Popović et al. (2004) Popović, L. Č., Mediavilla, E. G., Bon, E., Ilić, D. 2004, A&A, 423, 909
- Popović et al. (2008) Popović, L. Č., Shapovalova, A. I., Chavushyan, V. H., Ilić, D., Burenkov, A. N., Mercado, A., Ciroi, S., Bochkarev, N. G. 2008, PASJ, 61, 1
- Popović et al. (2009) Popović, L. Č., Smirnova, A. A., Kovačević, J., Moiseev, A. V., Afanasiev, V. L. 2009, AJ, 137, 3548
- Popović et al. (2011) Popović, L. Č., Shapovalova, A. I., Ilić, D., Kovačevic, A., Kollatschny, W., Burenkov, A. N., Chavushyan, V. H., Bochkarev, N. G., León-Tavares, J. 2011, A&A, 528, 130
- Rafanelli (1985) Rafanelli, P. 1985, A&A, 146, 17
- Rees, Netzer & Ferland (1989) Rees, M., Netzer, H., Ferland, G. J. 1989, ApJ, 347, 640
- Sivron & Tsuruta (1993) Sivron, R., & Tsuruta, S. 1993, ApJ, 402, 420
- Snedden & Gaskell (2007) Snedden, S. A., & Gaskell, C. M. 2007, ApJ, 669, 126
- Shapovalova et al. (2004) Shapovalova, A. I., Doroshenko, V. T., Bochkarev, N. G., et al. 2004, A&A, 422, 925
- Shapovalova et al. (2008) Shapovalova, A. I., Popović, L. Č., Collin, S., Burenkov, A. N., Chavushyan, V. H. et al. 2008, A&A, 486, 99
- Shapovalova et al. (2010) Shapovalova, A. I., Popović, L. Č., Burenkov, A. N., Chavushyan, V. H., Ilić, D., Kovačević, A., Bochkarev, N. G., León-Tavares, J. 2010, A&A, 509, 106
- Storey & Hummer (1988) Storey, P.J., Hummer, D.G. 1988, MNRAS, 231, 1139
- Storey & Hummer (1995a) Storey, P.J., Hummer, D.G. 1995a, MNRAS, 272, 41
- Storey & Hummer (1995b) Storey, P.J., Hummer, D.G. 1995b, VizieR Online Data Catalog, 6064, 0
- Sulentic et al. (2000) Sulentic, J. W., Marziani, P., Dultzin-Hacyan, D. 2000, ARA&A, 38, 521
- Sulentic et al. (2009) Sulentic, J. W., Marziani, P., Zamfir, S. 2009, New Astronomy Review, 53, 198