Anisotropy of TeV and PeV cosmic rays with IceCube and IceTop
Abstract
The interaction of high energy cosmic rays with the Earth’s atmosphere produces extensive air showers of secondary particles with a large muon component. By exploiting the sensitivity of neutrino telescopes to high energy muons, it is possible to use these detectors for precision cosmic ray studies. The high rate of cosmic-ray muon events provides a high-statistics data sample that can be used to look for anisotropy in the arrival directions of the parent particles at the per-mille level. This paper reports on the observation of anisotropy in the cosmic ray data collected with the IceCube neutrino telescope in the 20-400 TeV energy range at multiple angular scales. New data from the IceTop air shower array, located on the ice surface above IceCube, shows an anisotropy that is consistent with the high-energy IceCube results. The sensitivity of IceTop to all the components of the extensive air shower will allow us to explore in more detail the characteristics of the primary cosmic rays associated with the observed anisotropy.
keywords:
galactic , cosmic ray , anisotropy1 Introduction
It has been almost 100 years since the discovery of cosmic rays by Victor Hess. The origin of these energetic particles, however, still remains an enduring problem in astrophysics. Based on indirect evidence, it is believed that cosmic rays (CRs) with energies up to a few PeV are accelerated in supernova remnants distributed accross our galaxy. A direct test of this hypothesis is a challenge since the arrival directions of cosmic rays at Earth do not point back to their sources due to the scrambling action of the galactic magnetic field (GMF) during propagation. For this reason, the search for the sources of cosmic rays is usually performed either at the highest energies where the influence of the GMF is small, or by making use of a neutral messenger particle as the neutrino.
Even if a direct detection of cosmic ray sources is not feasible at or below PeV energies, their discrete spatial distribution should create an observable dipolar anisotropy of per-mille strength [1][2][3]. The energy dependence of the phase and amplitude of this kind of anisotropy would be dominated by details in the propagation process such as the geometry of the galaxy, the energy dependence of the CR diffusion coefficient, and the age and injection spectrum of the sources. Other factors, such as turbulent propagation in the GMF [4], heliospheric effects [5], and special magnetic field configurations [6][7], could give rise to anisotropy at smaller angular scales. A different process, known as the Compton-Getting effect [8], could also create a dipole anisotropy due to the relative motion of the solar system with respect to the cosmic ray plasma.
Several experiments in the northern hemisphere have reported on the observation of anisotropy at TeV energies [9][10][11][12][13]. Two features dominate the northern sky in cosmic rays: a dipole-like large scale structure with an amplitude of , and a small scale anisotropy with significant structure at angular sizes between and . The observed dipole anisotropy is inconsistent, both in amplitude and phase, with the Compton-Getting prediction.
IceCube is sensitive to muons from cosmic rays with TeV energies, and the data collected with this detector has been used to provide the first look at the CR anisotropy in the southern sky. The large set of cosmic ray events from IceCube, together with the air shower data from the IceTop detector, provide us with important tools to study the anisotropy of cosmic rays in the TeV and PeV range.
The most recent results on CR anisotropy obtained with the IceCube and IceTop detectors are summarized in this paper.
2 The IceCube and IceTop detectors
IceCube is a km3 neutrino telescope designed to search for astrophysical sources of high energy neutrinos. The basic building block of IceCube is the Digital Optical Module (DOM), a glass pressure sphere that contains a 10” Hamamatsu PMT [14], together with electronic boards for signal digitization [15], HV supply, and calibration LEDs. Between 2004 and 2010, 5160 DOMs were deployed in the South Pole ice at depths between 1450 and 2450 m to detect the Cherenkov radiation emitted by charged particles produced in the interaction of neutrinos with nucleons.
These DOMs are attached to 86 vertical strings that provide mechanical support, electrical power, and a data connection to the surface. The vertical spacing between most consecutive DOMs in each string is about 17 m, while the horizontal spacing between most neighboring strings is approximately 125 m.
A dedicated cosmic ray air shower array called IceTop is located on the ice surface above IceCube. The array consists of 81 stations, with two light-tight ice Cherenkov tanks per station. Each tank is 1.8 m in diameter, 1.3 m in height, and is instrumented with two DOMs that are operated at different PMT gains to increase the dynamic range of the detector.
IceCube and IceTop were operated in partial configurations from the beginning of their construction until the completion of both detectors in December of 2010. IceCube was operated in a 59-strings (IC59) configuration between May 2009 and May 2010, with IceTop operating with 59 stations (IT59) during the same time period.
The IC59 dataset consists of those events where at least 8 IceCube DOMs detected photon hits within a 5 s window. The average rate for this trigger condition was 1.7 kHz in IC59. During a total live time of 334.5 days, events were collected, almost all of them produced by down-going muons from cosmic rays. For this analysis, a fast muon track reconstruction was performed online at the South Pole. The result of the fit, together with the number of triggered DOMs and the time of the event are stored and transferred over a satellite link using a compressed data format. The median energy of primary cosmic rays in this dataset is 20 TeV and was determined through Monte Carlo simulations assuming a mixed CR composition dictated by the polygonato model [16]. In this model, the energy spectrum for each chemical element is given by a broken power-law with a smooth transition, where the location of the spectral break is rigidity-dependent. Due to this dependence, heavier elements dominate the all-particle CR spectrum at energies above a few PeV.
The median angular resolution of the muon track reconstruction is 3∘. Due to the degradation of the resolution with increasing zenith angle, only events with were used in the analysis, which reduced the final dataset size to 3.2 events.
In IceTop, the high-gain DOMs in the two tanks that form a station are run in local coincidence mode and the readout is enabled if they record hits within s of each other. The IceTop trigger condition is satisfied if at least 6 DOMs recorded locally-coincident hits within a time window of 5 s, which implies that at least 2 stations have participated in the event.
The anisotropy analysis used events in which at least 3 IceTop stations had triggered. Due to bandwidth limitations, events triggering less than 8 stations were prescaled by a factor of 8 while events with at least 8 stations were not prescaled. The event directional reconstruction was performed doing a fit to the trigger times of each station using a planar approximation for the shape of the shower front. Simulations show that the median resolution of this reconstruction algorithm is 2∘.
Preliminary results from Monte Carlo studies using a mixed composition of H, He, and Fe from the polygonato model indicate that the median primary CR energy of the IceTop dataset is 640 TeV, with 68% of the event between 200 TeV and 2400 TeV. Only events with were selected for the analysis, with events passing the cut.
3 Analysis and results
An anisotropy in the arrival direction of TeV cosmic rays was observed for the first time in IceCube using data from the 22-string configuration (IC22) that operated between June 2007 and March 2008 and was reported in Ref. [17]. In this analysis, the exposure-corrected right ascension distribution of cosmic ray events was fitted with a harmonic function of the form , where and are the amplitude and phase of the term in the sum, is the right ascension, and is a constant. This sum was performed over the first two terms in harmonic space () since they provide with an adequate description of the shape of the anisotropy. The fit parameters obtained in this analysis are , , , with , and show a good agreement with the phase and amplitude of the anisotropy observed in the northern sky.
A later analysis [18] using IC59 data revealed that besides the large-scale structure (i.e. dipole and quadrupole modes) observed in the IC22 analysis there are also statistically significant structures with typical sizes between 10∘ and 20∘. In this analysis, the search for anisotropy is conducted by searching for deviations of the sky map of reconstructed cosmic ray arrival directions in equatorial coordinates from a reference isotropic sky map obtained from data using the time-scrambling method described in Ref. [19]. The time scrambling period used in the analysis is 24 hours, which makes it sensitive to all angular scales in the celestial sphere. During the time scrambling procedure, events were resampled 20 times to reduce statistical fluctuations in the reference sky map.
The sky maps were constructed using the HEALPix111http://healpix.jpl.nasa.gov library [20] that provides an equal area pixelization of the sphere. The chosen HEALPix resolution divides the sphere into 49152 pixels, with an average distance between pixel centers of approximately 1∘. Using the reference and data maps, a relative intensity map can be calculated using the expression , where and are respectively the number of observed events and the number of reference events for the isotropic expectation in the pixel obtained with the time scrambling technique.
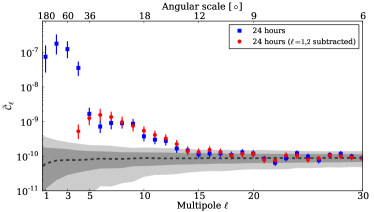
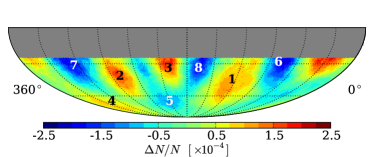
The angular power spectrum of the relative intensity map can be used to estimate the strength of the anisotropy at different angular scales in our data. The IC59 power spectrum is shown in Fig. 1 and was obtained using the PolSpice software package222http://www2.iap.fr/users/hivon/software/PolSpice/ that corrects for systematic effects introduced by the limited sky coverage of our data [21][22]. It can be seen that besides the already mentioned dipole () and quadrupole () there is a significant departure from isotropy at higher multipole moments between and , which corresponds to structures that have angular sizes roughly between 15∘ and 30∘ in the sky. In order to reveal this smaller structure, the dipole () and quadrupole () terms of the spherical harmonics functions were fit and subtracted from the IC59 relative intensity map. The residual maps were smoothed to search for the small scale anisotropy. The smoothing procedure sums all events in a pixel to the events from pixels inside a certain angular distance. This produces a sky map of correlated pixels with an improved sensitivity to structures with angular sizes similar to the smoothing radius. A scan was then performed over smoothing radii between 3∘ and 30∘ in steps to find the optimal angular scale for the small scale structure. The optimal scale corresponds to the one that maximizes the statistical significance of the observation calculated according to Ref. [23], after taking into account trials due to the search over many pixels and smoothing radii. For the IC59 data, eight regions were identified where the absolute value of the statistical significance was higher than before accounting for trials. These regions can be seen in Fig. 2 for smoothing radii of . The most significant excess is region 1, with an optimal scale of at which it reaches a significance of after trials and has an amplitude of . A full list of the statistical significance for all regions can be found in Ref. [18].
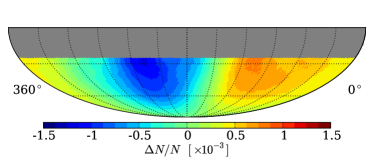
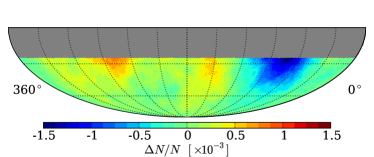
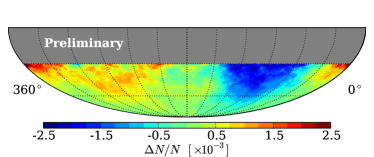
A study of the energy dependence of the anisotropy was performed using IC59 data and was reported in Ref. [24]. A cut was implemented to create two distinct subsamples with different median energies: 20 TeV, and 400 TeV. The cut variables used in the selection were the reconstructed zenith angle of the event, and the number of triggered DOMs (both increase as a function of primary CR energy). After cuts, the 20 TeV dataset contained events, while the 400 TeV dataset consists of events (with 68% of the events between 100 TeV and 1300 TeV). The anisotropy results were obtained in two ways: through a harmonic fit to the right ascension distribution of events as in the case of IC22, and through the search for the optimal angular scale after a reference level estimation performed with the time scrambling technique as in Ref. [18]. Both methods consistently observed the presence of the already known dipole and quadrupole structure in the 20 TeV dataset, while at 400 TeV the anisotropy pattern changes both in phase and amplitude. Only one structure in the 400 TeV sky map has a post-trial significance larger than : a deficit located at () with an optimal smoothing of and an average amplitude of approximately in relative intensity. The deficit is also visible as region 6 in the small scale map shown in Fig. 2 before energy cuts are applied. This observation represents the first detection of anisotropy in the southern sky at these energies. The relative intensity sky maps for the 20 TeV and 400 TeV energy bands are shown in Fig. 3.
A preliminary analysis of the IceTop IT59 dataset reveals a deficit located in the same region as the one observed at 400 TeV with IceCube. For a smoothing angle of the pre-trial significance is and the amplitude is about , larger than the one observed in IceCube. A possible cause of this discrepancy is the difference in energy range associated with the two data sets. It is also possible that the CR chemical composition may be contributing to this mismatch. This is due to the fact that while IceTop is sensitive to all components of the CR air shower, IceCube is only capable of detecting the muon component, and this could create a detection bias towards a particular composition. Further studies of the energy and composition dependence of the anisotropy are needed to perform a direct comparison between both results.
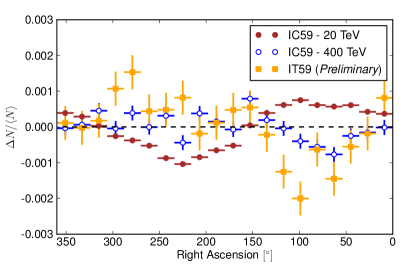
A comparison of the right ascension projection of the relative intensities observed in IceCube for both the 20 TeV and 400 TeV energy bands, and IceTop is shown in Fig. 5. Only events in the declination range were used in this plot.
4 Summary
Data taken between 2007 and 2010 with the IceCube neutrino telescope and the IceTop air shower array has been used to probe the anisotropy of TeV and PeV cosmic rays down to amplitudes of . The anisotropy at an energy of 20 TeV is consistent with that observed by other experiments in the northern hemisphere, and is dominated by a large scale component (dipole and quadrupole) with a strength of . A subdominant, but statistically significant, structure at 20 TeV is characterized by small excess and deficit regions with angular sizes between and and strengths of the order of .
At energies of about 400 TeV, IceCube observed a strong deficit with a relative intensity of about and a size of approximately . A preliminary analysis of IceTop data shows a deficit in the same region, but with an amplitude that doubles the one observed in IceCube.
Future studies will expand the energy reach of the anisotropy analysis, and provide a handle on the evolution of the anisotropy as a function of energy and angular scale.
References
- Erlykin and Wolfendale [2006] A. D. Erlykin, A. W. Wolfendale, Astropart. Phys. 25 (2006) 183–194.
- Ptuskin et al. [2006] V. S. Ptuskin, F. C. Jones, E. S. Seo, R. Sina, Advances in Space Research 37 (2006) 1909–1912.
- Blasi and Amato [2011] P. Blasi, E. Amato, ArXiv e-print 1105.4529 (2011).
- Giacinti and Sigl [2011] G. Giacinti, G. Sigl, ArXiv e-print 1111.2536 (2011).
- Lazarian and Desiati [2010] A. Lazarian, P. Desiati, Astrophys. J. 722 (2010) 188–196.
- Malkov et al. [2010] M. A. Malkov, et al., Astrophys. J. 721 (2010) 750–761.
- Drury and Aharonian [2008] L. Drury, F. Aharonian, Astropart. Phys. 29 (2008) 420–423.
- Compton and Getting [1935] A. H. Compton, I. A. Getting, Phys. Rev. 47 (1935) 817–821.
- Abdo et al. [2008] A. A. Abdo, et al., Phys. Rev. Lett. 101 (2008) 221101.
- Aglietta et al. [2009] M. Aglietta, et al., Astrophys. J. Lett. 692 (2009) L130–L133.
- Amenomori et al. [2006] M. Amenomori, et al., Science 314 (2006) 439–443.
- Guillian et al. [2007] G. Guillian, et al., Phys. Rev. D 75 (2007) 062003.
- Vernetto et al. [2009] S. Vernetto, et al., in: Proc. 31st ICRC, Łódź, Poland.
- Abbasi et al. [2010] R. Abbasi, et al., Nucl. Instrum. Meth. A618 (2010) 139–152.
- Abbasi et al. [2009] R. Abbasi, et al., Nucl. Instrum. Meth. A601 (2009) 294–316.
- Hörandel [2003] J. R. Hörandel, Astropart. Phys. 19 (2003) 193–220.
- Abbasi et al. [2010] R. Abbasi, et al., Astrophys. J. 718 (2010) L194.
- Abbasi et al. [2011] R. Abbasi, et al., Astrophys. J. 740 (2011) L16.
- Alexandreas et al. [1993] D. E. Alexandreas, et al., Nucl. Instr. Meth. A 328 (1993) 570–577.
- Gorski et al. [2005] K. M. Gorski, et al., Astrophys. J. 622 (2005) 759–771.
- Chon et al. [2004] G. Chon, et al., Mon. Not. Roy. Astron. Soc. 350 (2004) 914.
- Szapudi et al. [2001] I. Szapudi, S. Prunet, D. Pogosyan, A. S. Szalay, J. R. Bond, Astrophys. J. 548 (2001) L115.
- Li and Ma [1983] T. Li, Y. Ma, Astrophys. J. 272 (1983) 317–324.
- Abbasi et al. [2011] R. Abbasi, et al., ArXiv e-print 1109.1017 (2011).