The Correlated Formation Histories of Massive Galaxies and Their Dark Matter Halos
Abstract
Using observations in the COSMOS field, we report an intriguing correlation between the star formation activity of massive (M⊙) central galaxies, their stellar masses, and the large-scale (10 Mpc) environments of their group-mass (M⊙) dark matter halos. Probing the redshift range , our measurements come from two independent sources: an X-ray detected group catalog and constraints on the stellar-to-halo mass relation derived from a combination of clustering and weak lensing statistics. At , we find that the stellar mass in star-forming centrals is a factor of two less than in passive centrals at the same halo mass. This implies that the presence or lack of star formation in group-scale centrals cannot be a stochastic process. By , the offset reverses, probably as a result of the different growth rates of these objects. A similar but weaker trend is observed when dividing the sample by morphology rather than star formation. Remarkably, we find that star-forming centrals at live in groups that are significantly more clustered on 10 Mpc scales than similar mass groups hosting passive centrals. We discuss this signal in the context of halo assembly and recent simulations, suggesting that star-forming centrals prefer halos with higher angular momentum and/or formation histories with more recent growth; such halos are known to evolve in denser large-scale environments. If confirmed, this would be evidence of an early established link between the assembly history of halos on large scales and the future properties of the galaxies that form inside them.
Subject headings:
cosmology: observations—galaxies: groups: general—galaxies: halos1. Introduction
Understanding the form and evolution of the relationship between galaxy stellar mass, galaxy color, and dark matter halo mass has become a critical topic in galaxy formation. In Leauthaud et al. (2012) (hereafter L12) we combined measurements of the galaxy stellar mass function (SMF), galaxy clustering, and galaxy-galaxy lensing in the COSMOS survey (Scoville et al. 2007) to place constraints on the stellar-to-halo mass relation (SHMR) at using a halo occupation analysis (HOD). In this paper, we focus on the SHMR for massive galaxies, M⊙, within group-scale halos, M⊙, across this same redshift range. Updating the L12 results, we now separately constrain the SHMR’s for galaxies that are actively star-forming and those that are passively evolving. We compare these results with a sample of central galaxies identified in an X-ray selected COSMOS group catalog (George et al. 2011).
We define a dark matter halo with as having an overdensity 200 times the mean cosmic density. All calculations assume a flat CDM cosmology of (,,,,.
2. Data
The COSMOS sample that we use for clustering, lensing, and SMFs has already been described in detail in L12. HOD anlaysis is performed on these measurements. The main difference with respect to L12 is that we now divide the sample into star-forming (SF) and passive subsamples using the UVJ color-color cuts of Bundy et al. (2010). We use the same stellar masses as L12. These have been estimated using the Bayesian code of Bundy et al. (2006) using a Chabrier (2003) initial mass function. In our redshift range, there are 12,573 passive and 41,682 SF galaxies in the COSMOS sample above our completeness limits.
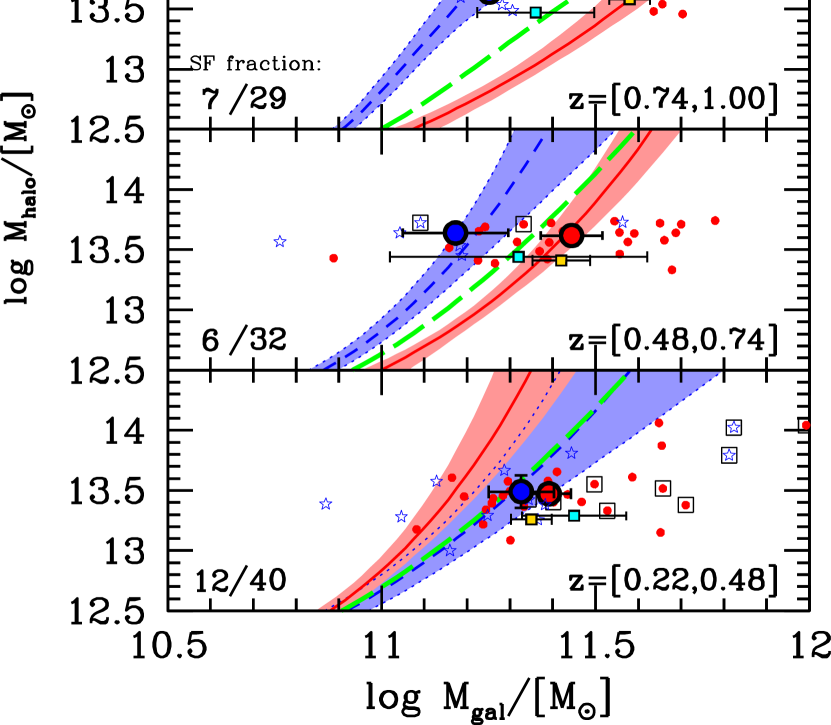
We also use a COSMOS X-ray selected group catalog to select and study central galaxies. Details regarding this group catalog can be found in Finoguenov et al. (2007) and George et al. (2011)111This group catalog is publicly available and can be found at http://irsa.ipac.caltech.edu/data/COSMOS/tables/groups/. Halo masses for these groups were determined in Leauthaud et al. (2010) by calibrating the - relation from weak lensing. To ensure a clean sample of groups and centrals, we exclude potentially merging systems, and groups near masked regions or with very few members (flag_include=1 in George et al. 2011). This sample contains 129 groups out of 211 extended X-ray detections. We further remove 18 groups with ambiguous identification of a central galaxy, i.e., when the most massive group galaxy within the NFW-scale radius (Navarro et al. 1997) of the halo is not the most massive galaxy within the virial radius (mmgg_scale_mstar mmgg_r200_mstar). At fixed redshift, the group catalog constitutes a roughly halo-mass limited sample of dark matter halos. We divide the data into three redshift bins that span . The specific redshift bins are the same as in L12 and are shown in Fig. 1. The mean logarithmic halo mass in each redshift bin is 13.47, 13.59, and 13.75. We note that the mass calibration of Leauthaud et al. (2010) assumes a halo mass definition of 200 times the critical density. We have converted these values to our fiducial halo definition by assuming the NFW density profile with a concentration-mass relation given by Muñoz-Cuartas et al. (2011). We then rescale the masses from the 200-critical definition to the 200-mean (e.g., Hu & Kravtsov 2003).
The central galaxies in our sample are well above the completeness limit for COSMOS (Fig. 1 in L12), even for passive galaxies. We also check for AGN contamination, which we will discuss subsequently.
3. Halo Occupation Analysis
In Leauthaud et al. (2011), we presented a theoretical framework for modeling combined measurements of the SMF, galaxy clustering, and galaxy-galaxy lensing. This method is a more generalized version of the traditional Halo Occupation Distribution (see, e.g., Cooray & Sheth 2002 for a review). Our HOD method utilizes these three statistical measures to infer the number of galaxies within halos as both a function of halo and galaxy mass. In L12, we implemented this formalism on stellar-mass defined samples within COSMOS. Our analysis constrains the halo occupation of both central and satellite galaxies, but in this paper we focus exclusively on central galaxies within group-scale halos. We constrain a SHMR for both passive and SF central galaxies such that the total number of central galaxies per halo is unity. This result is obtained independent of the SHMR constrained from the group catalog. In L12 we assumed that every halo has one central galaxy; here we require that the sum of mean occupation of passive and SF central galaxies is unity. In a companion paper (J. Tinker et al., in preparation), we present full details of our measurements and our model fits. Our results focus on the relative clustering of groups at Mpc. Due to the small area of COSMOS, the integral constraint can affect the clustering of objects at our scale of interest (L12). However, it will not alter the relative clustering of two samples in the same volume (L12), which is the quantity of interest here.
4. Results
4.1. Stellar-to-Halo Mass Ratios
Fig. 1 shows the constraints on the SHMR for passive and SF galaxies for each redshift bin. Results from L12 for the full stellar-mass limited samples are shown for comparison. At , there is a clear difference between the stellar masses of SF and passive central galaxies in groups of similar halo mass. At M⊙, the difference is 0.4 dex. This is qualitatively consistent with the trends seen in AEGIS groups at lower halo mass (Woo et al. 2012). At lower redshift, however, this difference gradually goes away. In the lowest redshift bin, the SHMR for SF and passive galaxies cross at fixed halo mass.
This evolution is confirmed in the galaxy group sample: At high redshift, there is a 3- difference in the median central galaxy mass between passive and SF centrals. Errors for this quantity are calculated by bootstrap resampling of the stellar masses within each subsample. The median galaxy masses are also in good agreement with those derived from the halo occupation analysis. At lower redshifts, the difference in the passive and SF galaxy masses gets monotonically smaller. The median masses do not cross over, as they do in the SHMRs; there is a discrepancy between the results for the passive subsample in the lowest redshift bin. However, results from SDSS demonstrate that this cross over has indeed occurred by (Mandelbaum et al. 2006; More et al. 2011). The results from the group catalog are qualitatively similar if one breaks the catalog up by morphology222The ‘spheroidal’ classification of §3.4.1 in Bundy et al. 2010. (as shown in Figure 1). The galaxies with X-ray AGN activity, either in the XMM or Chandra observations are indicated on the plot. The low number of such objects, and the (lack of) correlation with star formation estimates indicates that AGN contamination is not playing any role in the observations. Removing these objects from the sample does not shift the medians beyond their 1- errors.
At , the discrepancy in the SHMR values and those obtained from the groups for passive galaxies is a 2.4- difference based upon creating Monte Carlo samples of halos using all elements in the MCMC chain but with the same mass distribution as the groups sample. The large-scale clustering amplitude of all structure in the low- bin is below average (L12), which could drive systematic errors in the HOD results. It is also possible that the halo mass function assumed in the HOD analysis (Tinker et al. 2008a) is not the same as the true mass function in that patch of sky, also resulting in systematic biases. However, we note that the groups catalog is a subset of all X-ray groups within COSMOS, while the SHMRs are derived from statistics on the full sample of galaxies. Also, measurements of the SHMR using lensing (Mandelbaum et al. 2006) and satellite kinematics (More et al. 2011) find that the halo masses for massive red galaxies are higher than those of massive SF central galaxies, following the evolutionary trend seen in the HOD results.
4.2. Clustering by Central Galaxy Type
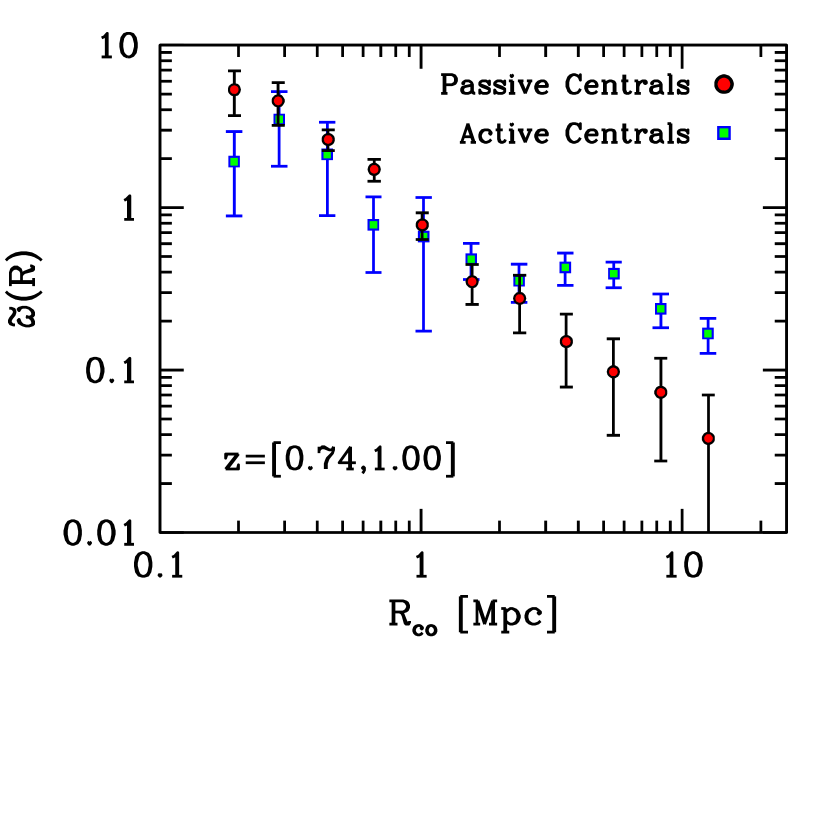
Fig. 2 shows the cross-correlation between groups and all galaxies. We split the groups into samples with SF and passive centrals, and cross-correlate each set of centrals with all galaxies. Both samples are in the z=[0.74, 1.00] redshift bin, with a magnitude cut of . Galaxies brighter than this threshold have reliable photometric redshifts with errors (see figure 2 in George et al. 2011). Because most of the redshifts of the central group galaxies are known with spectroscopic precision (most are sampled within the zCOSMOS survey), we can measure the real-space projected clustering, which has higher signal-to-noise relative to a simple angular cross-correlation. We denote this clustering statistic . Details are given in Padmanabhan et al. (2009). Briefly, we calculate the projected comoving separation between each group-galaxy pair from the angular separation and the redshift of the group. We restrict all pairs to lie within a redshift interval of , or 3- of the photo-z error. To properly normalize requires detailed information of the photo-z error distribution function, but since we are only concerned with the relative clustering between two spectroscopic samples cross-correlated with the same photometric sample, this step is unnecessary. We measure the angular cross-correlation, , for the same samples as a cross-check on our results. Errors are obtained by bootstrap resampling of the groups and recalculating or for each bootstrap sample.
A scale of importance is the 1 Mpc scale (comoving), roughly the virial radius of the groups. Inside this scale, the cross-correlation probes the number of satellite galaxies within the groups. Outside this scale, the cross-correlation probes the large-scale bias of the groups, which is an indicator of their environment. In the measurements of Fig. 2, this scale marks the bifurcation in the two correlation functions. Outside this scale, the passive-central groups have a lower large-scale bias, indicating that these halos have formed in lower-density environments. Inside this scale, the correlation functions for the groups differ at the level, with the SF-centered groups having lower clustering, but the large errors prevent meaningful interpretation.
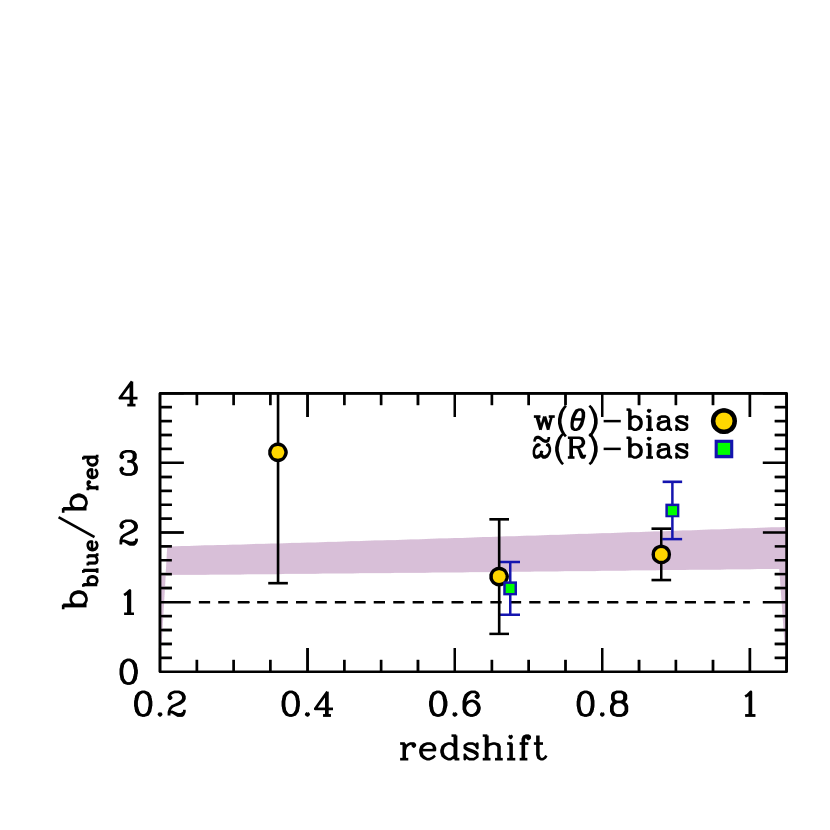
For each redshift bin, we calculate the bias relative to an (arbitrarily normalized) non-linear matter correlation function calculated using the Smith et al. (2003) fitting function. We calculate bias using bins at Mpc or arcsec. We estimate the covariance matrix by bootstrap resampling of the groups with replacement. We use 200 bootstrap samples. Due to the low number of groups, the clustering signal around each group can be considered independent. We use the full covariance matrix to obtain the bias and its error. The relative bias of SF-centered and passive-centered groups is shown as a function of redshift in Fig. 3. We show bias measurements from both and . For the former, a bias measurement is not possible at due to noise in the measurements for both subsamples. At , both measures indicate that the SF-centered groups have significantly enhanced clustering. At , the relative bias is above unity, but this detection is not significant given the errors. At , the angular clustering yields a 1- detection of elevated clustering in the SF-centered groups.
5. Discussion
Proposed quenching mechanisms for massive galaxies, such as major mergers (i.e., Hopkins et al. 2008) or AGN (i.e., De Lucia & Blaizot 2007) essentially remove galaxies from the star-forming sequence and place them in the red sequence. The efficiency of such processes is correlated with halo mass. Some research suggests that cooling flows may lead to episodic star formation in central galaxies (Liu et al. 2012).
The substantial difference in the SHMRs for SF and passive galaxies at the group-scale halo masses at has many implications. It implies that star formation is not stochastic in these objects: if massive central galaxies underwent periodic episodes of star formation followed by longer-term quiescence, the galaxies at fixed halo mass would have the same mass regardless of color. The results also imply that massive quenched galaxies had far different growth histories than those that are forming stars at . A scenario in which galaxies at fixed halo mass grow on a common star-forming sequence, with a quenching mechanism that removes these galaxies from this sequence, would make passive central galaxies less massive than SF central galaxies. This is the opposite of what is observed at . To be consistent with our observations, passive central galaxies at form their stars rapidly at high redshift, essentially getting ‘ahead of the growth curve’ relative to central galaxies that are still forming stars by . At high redshift, central galaxies essentially “knew” they would be quenched by .
Fig. 2 indicates that color-selected groups represent special subsets of objects at this halo mass scale. The current growth rate (indicated by galaxy color) and growth history (probed by total stellar mass) of the central galaxy is correlated with large-scale environment. A similar effect is seen in dark matter halos in N-body simulations, an effect called assembly bias. For massive systems, younger halos exist in more dense environments (Wechsler et al. 2006; Dalal et al. 2008). The environment (and formation history) of massive halos is also correlated with angular momentum of dark matter halos (Wechsler 2001; Bett et al. 2007; Gao & White 2007) such that high-spin halos are more clustered than low-spin halos. This effect goes away below M⊙. The shaded region in Fig. 3 is the numerical result from Bett et al. (2007). The lower limit is the bias of the top 20% of halos, ranked by angular momentum, relative to all halos. The upper limit is the bias of the top 20% of halos relative to the lowest 20% of halos (see their Fig. 20333We assume that assembly bias is fixed for halos with the same , thus we convert their results, which are plotted as a function of , to and interpolate the assembly bias at the values of for the groups samples at each redshift.). The proper comparison to our measurements will lie in between.
Recent hydrodynamic simulations of galaxy formation indicate that galaxy morphology is correlated with the angular momentum gained from the larger-scale environment around the halo at early epochs (Sales et al. 2011). If the angular momentum of dark matter and baryons are connected, massive halos with central disk galaxies should have enhanced clustering, in agreement with the results in Fig. 2. Sales et al. (2011) also find that the disk galaxy masses are lower than their spheroidal counterparts. There are, however, substantive differences between the Sales simulations and our results: they show results for less-massive halos at , rather than group-scale systems at . They conclude that there is little correlation between morphology and halo spin, but there is little correlation between halo spin at early and late epochs for their halo masses (Vitvitska et al. 2002). However, the existence of assembly bias implies that more massive halos retain memory of the angular momentum at the epoch of galaxy formation. Further investigation is required at higher masses and redshifts.
However, one need not invoke angular momentum to achieve both the relative clustering and relative masses of passive and SF centrals. Conroy & Wechsler (2009) demonstrate that stellar mass growth peaks at a halo mass of M⊙, weakly dependent on redshift, but the star formation efficiency at that peak decreases with cosmic time. In this scenario, central galaxies within late-forming halos would lag behind those in early-forming halos, and have enhanced clustering. This toy model does not explain the morphology dependence, or the difference in instantaneous SF rates at , but does provide a connection between halo formation history and galaxy properties.
There have been many attempts to find assembly bias in the galaxy distribution. Tinker et al. (2008b) and Tinker et al. (2011) find no evidence for assembly bias for galaxies below the knee in the SMF or luminosity function. The assembly biases in the low mass and high mass halo populations are driven by disparate physical mechanisms. Younger halos form in denser environments at high mass through the statistics of Gaussian random fields. At low mass, older halos form in denser environments due to tidal forces and interactions with nearby massive objects (Dalal et al. 2008). It is plausible that these two mechanisms may have different levels of impact on galaxy formation.
Wang et al. (2008) find that group-mass halos in SDSS with redder total galaxy content (centrals and satellites combined) are more clustered than groups with bluer galaxies. It is not clear how the clustering signal in COSMOS data could reverse if the most-clustered halos at one redshift remain the most clustered at a lower redshift. The Wang et al. (2008) detection is mitigated by the lack of independent constraints on the halo mass; in their group-finding algorithm, the halo mass is estimated statistically by assuming a 1:1 correspondence between total group stellar mass and halo mass, with no scatter. Berlind et al. (2006), using a different group-finding algorithm (but the same data set), find the opposite signal: groups with bluer central galaxies are the ones that are more clustered. Both these methods rely on inferring halo mass statistically from the galaxies within them; our X-ray detections and lensing masses are more legitimate for detecting assembly bias.
From to , the SHMRs evolve quite differently depending on star formation activity. By , the mean relations have crossed and passive central galaxies live in higher mass halos than SF central galaxies at fixed mass. This inversion is also consistent with results from studies (Mandelbaum et al. 2006; More et al. 2011). Star forming galaxies grow by a factor of 2 using the star formation rates of Noeske et al. (2007) from to . Group-mass halos also grow by a factor of 2, thus central galaxies grow as fast as their host halos. For quenched galaxies, their growth rates are slower than that of their host halos, plausibly causing the inversion of the SHMR seen in Fig. 1.
At , our results imply that the process that shuts down star formation in massive galaxies cannot be explained by a stochastic process that is a function of halo mass. Rather, the interplay between the dark matter halo and the surrounding environment, including the tidal fielde, strongly influences the fate of the galaxy forming within it.
References
- Berlind et al. (2006) Berlind, A. A., Kazin, E., Blanton, M. R., Pueblas, S., Scoccimarro, R., & Hogg, D. W. 2006, ApJ, submitted, (astro-ph/0610524)
- Bett et al. (2007) Bett, P., Eke, V., Frenk, C. S., Jenkins, A., Helly, J., & Navarro, J. 2007, MNRAS, 376, 215
- Bundy et al. (2006) Bundy, K., Ellis, R. S., Conselice, C. J., Taylor, J. E., Cooper, M. C., Willmer, C. N. A., Weiner, B. J., Coil, A. L., Noeske, K. G., & Eisenhardt, P. R. M. 2006, ApJ, 651, 120
- Bundy et al. (2010) Bundy, K., Scarlata, C., Carollo, C. M., Ellis, R. S., Drory, N., Hopkins, P., Salvato, M., Leauthaud, A., Koekemoer, A. M., Murray, N., Ilbert, O., Oesch, P., Ma, C.-P., Capak, P., Pozzetti, L., & Scoville, N. 2010, ApJ, 719, 1969
- Chabrier (2003) Chabrier, G. 2003, PASP, 115, 763
- Conroy & Wechsler (2009) Conroy, C. & Wechsler, R. H. 2009, ApJ, 696, 620
- Cooray & Sheth (2002) Cooray, A. & Sheth, R. 2002, Phys. Rep., 372, 1
- Dalal et al. (2008) Dalal, N., White, M., Bond, J. R., & Shirokov, A. 2008, ApJ, 687, 12
- De Lucia & Blaizot (2007) De Lucia, G. & Blaizot, J. 2007, MNRAS, 375, 2
- Finoguenov et al. (2007) Finoguenov, A., Guzzo, L., Hasinger, G., Scoville, N. Z., Aussel, H., Böhringer, H., Brusa, M., Capak, P., Cappelluti, N., Comastri, A., Giodini, S., Griffiths, R. E., Impey, C., Koekemoer, A. M., Kneib, J.-P., Leauthaud, A., Le Fèvre, O., Lilly, S., Mainieri, V., Massey, R., McCracken, H. J., Mobasher, B., Murayama, T., Peacock, J. A., Sakelliou, I., Schinnerer, E., Silverman, J. D., Smolčić, V., Taniguchi, Y., Tasca, L., Taylor, J. E., Trump, J. R., & Zamorani, G. 2007, ApJS, 172, 182
- Gao & White (2007) Gao, L. & White, S. D. M. 2007, MNRAS, 377, L5
- George et al. (2011) George, M. R., Leauthaud, A., Bundy, K., Finoguenov, A., Tinker, J., Lin, Y.-T., Mei, S., Kneib, J.-P., Aussel, H., Behroozi, P. S., Busha, M. T., Capak, P., Coccato, L., Covone, G., Faure, C., Fiorenza, S. L., Ilbert, O., Le Floc’h, E., Koekemoer, A. M., Tanaka, M., Wechsler, R. H., & Wolk, M. 2011, ApJ, 742, 125
- Hopkins et al. (2008) Hopkins, P. F., Cox, T. J., Kereš, D., & Hernquist, L. 2008, ApJS, 175, 390
- Hu & Kravtsov (2003) Hu, W. & Kravtsov, A. V. 2003, ApJ, 584, 702
- Leauthaud et al. (2010) Leauthaud, A., Finoguenov, A., Kneib, J.-P., Taylor, J. E., Massey, R., Rhodes, J., Ilbert, O., Bundy, K., Tinker, J., George, M. R., Capak, P., Koekemoer, A. M., Johnston, D. E., Zhang, Y.-Y., Cappelluti, N., Ellis, R. S., Elvis, M., Giodini, S., Heymans, C., Le Fèvre, O., Lilly, S., McCracken, H. J., Mellier, Y., Réfrégier, A., Salvato, M., Scoville, N., Smoot, G., Tanaka, M., Van Waerbeke, L., & Wolk, M. 2010, ApJ, 709, 97
- Leauthaud et al. (2011) Leauthaud, A., Tinker, J., Behroozi, P. S., Busha, M. T., & Wechsler, R. H. 2011, ApJ, 738, 45
- Leauthaud et al. (2012) Leauthaud, A., Tinker, J., Bundy, K., Behroozi, P. S., Massey, R., Rhodes, J., George, M. R., Kneib, J.-P., Benson, A., Wechsler, R. H., Busha, M. T., Capak, P., Cortês, M., Ilbert, O., Koekemoer, A. M., Le Fèvre, O., Lilly, S., McCracken, H. J., Salvato, M., Schrabback, T., Scoville, N., Smith, T., & Taylor, J. E. 2012, ApJ, 744, 159
- Liu et al. (2012) Liu, F. S., Mao, S., & Meng, X. M. 2012, MNRAS, 2848
- Mandelbaum et al. (2006) Mandelbaum, R., Seljak, U., Kauffmann, G., Hirata, C. M., & Brinkmann, J. 2006, MNRAS, 368, 715
- More et al. (2011) More, S., van den Bosch, F. C., Cacciato, M., Skibba, R., Mo, H. J., & Yang, X. 2011, MNRAS, 410, 210
- Muñoz-Cuartas et al. (2011) Muñoz-Cuartas, J. C., Macciò, A. V., Gottlöber, S., & Dutton, A. A. 2011, MNRAS, 411, 584
- Navarro et al. (1997) Navarro, J. F., Frenk, C. S., & White, S. D. M. 1997, ApJ, 490, 493
- Noeske et al. (2007) Noeske, K. G., Faber, S. M., Weiner, B. J., Koo, D. C., Primack, J. R., Dekel, A., Papovich, C., Conselice, C. J., Le Floc’h, E., Rieke, G. H., Coil, A. L., Lotz, J. M., Somerville, R. S., & Bundy, K. 2007, ApJ, 660, L47
- Padmanabhan et al. (2009) Padmanabhan, N., White, M., Norberg, P., & Porciani, C. 2009, MNRAS, 397, 1862
- Sales et al. (2011) Sales, L. V., Navarro, J. F., Theuns, T., Schaye, J., White, S. D. M., Frenk, C. S., Crain, R. A., & Dalla Vecchia, C. 2011, MNRAS, submitted, ArXiv:1112.2220
- Scoville et al. (2007) Scoville, N., Aussel, H., Brusa, M., Capak, P., Carollo, C. M., Elvis, M., Giavalisco, M., Guzzo, L., Hasinger, G., Impey, C., Kneib, J.-P., LeFevre, O., Lilly, S. J., Mobasher, B., Renzini, A., Rich, R. M., Sanders, D. B., Schinnerer, E., Schminovich, D., Shopbell, P., Taniguchi, Y., & Tyson, N. D. 2007, ApJS, 172, 1
- Smith et al. (2003) Smith, R. E., Peacock, J. A., Jenkins, A., White, S. D. M., Frenk, C. S., Pearce, F. R., Thomas, P. A., Efstathiou, G., & Couchman, H. M. P. 2003, MNRAS, 341, 1311
- Tinker et al. (2008a) Tinker, J., Kravtsov, A. V., Klypin, A., Abazajian, K., Warren, M., Yepes, G., Gottlöber, S., & Holz, D. E. 2008a, ApJ, 688, 709
- Tinker et al. (2011) Tinker, J., Wetzel, A., & Conroy, C. 2011, MNRAS, submitted, ArXiv:1107.5046
- Tinker et al. (2008b) Tinker, J. L., Conroy, C., Norberg, P., Patiri, S. G., Weinberg, D. H., & Warren, M. S. 2008b, ApJ, 686, 53
- Vitvitska et al. (2002) Vitvitska, M., Klypin, A. A., Kravtsov, A. V., Wechsler, R. H., Primack, J. R., & Bullock, J. S. 2002, ApJ, 581, 799
- Wang et al. (2008) Wang, Y., Yang, X., Mo, H. J., van den Bosch, F. C., Weinmann, S. M., & Chu, Y. 2008, ApJ, 687, 919
- Wechsler (2001) Wechsler, R. H. 2001, PhD thesis, UNIVERSITY OF CALIFORNIA, SANTA CRUZ
- Wechsler et al. (2006) Wechsler, R. H., Zentner, A. R., Bullock, J. S., Kravtsov, A. V., & Allgood, B. 2006, ApJ, 652, 71
- Woo et al. (2012) Woo, J., Dekel, A., Faber, S. M., Noeske, K., Koo, D. C., Gerke, B. F., Cooper, M. C., Salim, S., Dutton, A. A., Newman, J., Weiner, B. J., Bundy, K., Willmer, C. N. A., Davis, M., & Yan, R. 2012, MNRAS, submitted (ArXiv:1203.1625)