Permeability of phospholipid membrane for small polar molecules determined from osmotic swelling of giant phospholipid vesicles
Abstract
A method for determining permeability of phospholipid bilayer based on the osmotic swelling of micrometer-sized giant unilamellar vesicles (GUVs) is presented as an alternative to the two established techniques, dynamic light scattering on liposome suspension, and electrical measurements on planar lipid bilayers. In the described technique, an individual GUV is transferred using a micropipette from a sucrose/glucose solution into an isomolar solution containing the solute under investigation. Throughout the experiment, vesicle cross-section is monitored and recorded using a digital camera mounted on a phase-contrast microscope. Using a least-squares procedure for circle fitting, vesicle radius is computed from the recorded images of vesicle cross-section. Two methods for determining membrane permeability from the obtained dependence are described: the first one uses the slope of for a spherical GUV, and the second one the dependence around the transition point at which a flaccid vesicle transforms into a spherical one. We demonstrate that both methods give consistent estimates for membrane permeability.
keywords:
lipid bilayer , membrane permeability , giant unilamellar vesicle , nonelectrolyte , osmotic swelling , phase contrast microscopy1 Introduction
The cell membrane physically separates the cell interior from the environment. The membrane is selectively permeable: it permits the passage of some species of molecules or ions to- and from the cell, while it blocks the transport for other species. Around 1900, while studying the working of general anaesthesia, Hans Meyer in Marburg [1] and Ernest Overton in Zürich [2] independently devised a simple rule to predict membrane permeability. They established that the more a molecule species is soluble in lipid, the greater the cell permeability for this molecule species is. While this rule cannot account for transport processes not known at that time, such as those mediated by membrane carriers, channels (e.g., aquaporins [3]) or pumps, nor does it acknowledge membrane inhomogeneities, such as rafts [4] present in the biological membrane, the Meyer-Overton rule seems to withstand the test of time [5, 6]. At the same time, there is a continuing interest in both basic physics of general anaesthesia [7] and passive membrane permeability [8].
While a significant corpus of publications on permeability properties of biological cells has been accumulated since Meyer and Overton, experimental access to an isolated lipid bilayer only became available in the early 1960s, when a technique for preparation of thin films separating two aqueous compartments has been devised, known as the black lipid membrane [9]. An arguably even more influential technique which was developed at roughly the same time allowed for producing artificial lipid vesicles, or liposomes [10]. Vesicles are osmotically sensitive structures which swell and shrink in response to changed osmotic conditions. Even though the sub-micrometer liposomes which are the easiest to produce cannot be visualized directly, their size can be estimated via light scattering [11] (see [12] for a review on the optical methods in determining membrane permeability).
Both model lipid bilayer systems – planar lipid bilayers and liposomes – have proved extremely fruitful in the studies of membrane permeability [13]. Planar lipid bilayers are well suited to electrical characterization, as the two chambers separated by the bilayer are both easily accessible, which allows simple placement of macroscopic electrodes. Finkelstein [14] measured the permeability of a planar lipid bilayer for water and seven other non-electrolytes in an attempt to resolve the mechanism by which neutral molecules and ions permeate the membrane. One possibility is the solubility-diffusion mechanism, which assumes that the permeating species dissolves in the hydrophobic membrane, diffuses across, and leaves by redissolving into the other aqueous compartment. Another possibility is that permeation occurs through hydrated transient defects, which appear as a result of thermal fluctuations. That study concluded that both water and non-electrolytes cross the membrane through the solubility-diffusion mechanism. A similar but more comprehensive study was repeated a few years later by Orbach and Finkelstein [15]. Walter and Gutknecht [16] examined the correlation between the membrane permeability for 22 solutes and their partition coefficient between water and any of the four examined organic solvents, and found a very high correlation with hexadecane and olive oil, and a less pronounced correlation in the case of octanol and ether.
In an early work [17], Bangham and coworkers made use of the fact that the total volume of liposomes in the suspension is proportional to the reciprocal of the optical extinction, which allowed them to examine the permeability of membrane for water and various solutes via osmotic swelling and shrinking of liposomes. As early as 1933 Jacobs noticed [18] that the volume of a cell transferred into a solution of permeant solute transiently decreases, reaches some minimal value, and then starts increasing. Sha’afi and coworkers [19] employed this phenomenon and the Kedem-Katchalsky formalism [20] to compute the permeability of erythrocyte membrane for urea. De Gier and coworkers used the initial slope of the reciprocal of the optical extinction for determining membrane permeability of liposomes [21]. Hill and Cohen [22] brought the “minimal volume” technique to the experiment with liposomes as well. A comprehensive review of the use of liposomes in membrane permeability studies is given by de Gier [23]. Using established techniques, Paula et al. [24] did an extensive study in another attempt to resolve the standing debate between the solubility-diffusion mechanism and the hydrated transient defects as a primary pathway, and concluded that except for ion permeability of lipid bilayers composed of phospholipids with short chain lengths, solubility-diffusion mechanism seems to be the dominant effect. Examining the known phenomenon that upon transfer into a hypotonic medium, vesicles swell, and, if the gradient is large enough, burst and expel part of their content, Shoemaker and Vanderlick studied the influence of membrane composition on the extent of leakage [25], and found out a correlation between the membrane resistance to burst and its stretching modulus.
Both planar lipid bilayers and liposomes as model bilayer systems have their drawbacks, too. The original “brush” technique of producing planar lipid bilayers has been limited by pockets of residual solvent trapped between the two bilayer leaflets, which affects membrane properties. While an improved deposition method [26] virtually eliminated this problem, the limited lifetime of the membranes– most often less than one hour – remains a persisting problem which limits the duration of the experiment. Liposomes, on the other hand – in particular large unilamellar vesicles (LUVs) with a diameter of 100–200 nm – have proved to be extremely stable. The interpretation of dynamic light scattering (DLS) experiments of osmotic shrinking of LUVs is not trivial, as it involves the transformation of shapes predicted by the area difference elasticity model [27] to the hydrodynamic radius, which is characterized by DLS [28, 29]. Also, it has been argued that LUVs, which consist exclusively of high-curvature membrane regions, serve as a poor model of biological cell membranes. An attempt to resolve the possible dependence of permeability on the membrane curvature [30] was inconclusive, as the authors ascribe the observed differences in permeability to the problems they experienced with planar lipid membranes. Finally, an effect which occurs in both systems, but is more prominent with the planar lipid bilayer, is the unstirred layer effect [31]. In general, the concentration of solute adjacent to the membrane differs from its concentration in bulk. It is the concentration of solute immediately adjacent to the membrane which determines the permeation of solute across the membrane, while the concentration in bulk is the one that is usually known. In both the experiment design and the interpretation of the experimental findings, one needs to be aware of this discrepancy.
While both planar lipid bilayers and liposomes have been used as model membrane systems for studies of membrane permeability since 1960s, studies employing GUVs, which allow for a direct visualization of the process, appeared decades later [32], chiefly due to a lack of suitable techniques for preparation and manipulation of GUVs in those early days. In the paper by Boroske et al. [32], the authors describe the experiment in which GUVs were prepared in pure water and subsequently transferred into a solution of either glucose or NaCl (concentrations used ranged from 1.5–20 mM) while their size was monitored using phase-contrast microscopy. Upon transfer, vesicles shrank in size; the process of shrinking depended on the vesicle size. Vesicles with radius shrank with a linear time dependence: , where is the molar volume of water, is membrane permeability for water (water filtration coefficient), the solute concentration difference, and time. From measured data, the authors inferred the water filtration coefficient, . Larger vesicles () underwent a phase of “instability” in which the vesicle was flaccid, and after which a spherical shape was reestablished. The authors dismissed the idea of dissolving lipid molecules into the outer medium as a plausible explanation for the apparent decrease of vesicle surface area, in particular since they also noticed formation of smaller satellite spherical vesicles, seemingly connected to the mother vesicle. Instead, they proposed a mechanism of concerted flipping of lipid molecules from the inner membrane leaflet into the outer membrane leaflet, induced by the flow of water. Recently, membrane permeability has also been studied of GUVs made of block copolymers [33, 34].
The remaining of this chapter is structured as follows. First, the experimental section introduces the system and presents the immediate experimental results. A section on the theory of membrane permeability offers a review of the few selected phenomenological models for membrane permeability, with a special emphasis on the influence of membrane elasticity and the swelling-burst cycle. The section concludes with a theory of the continous transition between the “ironing” and the stretching regimes of the osmotic swelling of a vesicle. The section on experimental analysis demonstrates the calculation of membrane permeability based on the swelling-burst cycle, and compares its result with the calculation based on the analysis of the transition between the “ironing” and the stretching regimes. We conclude with a discussion of the merits and limitations of the presented method.
2 Experimental section
2.1 Materials and methods
D-(+)-glucose, D-(+)-sucrose, glycerol, urea, and ethylene glycol were purchased from Fluka (Buchs, Switzerland). Methanol and chloroform were purchased from Kemika (Zagreb, Croatia). 1-palmitoyl-2-oleoyl-sn-glycero-3-phosphocholine (POPC) was purchased from Avanti Polar Lipids (Alabaster, USA). All the solutions were prepared in double-distilled sterile water.
A suspension of POPC GUVs in 0.1 or 0.2 mol/L 1:1 sucrose/glucose solution was prepared using an electroformation method, described in Ref. 35 with some modifications [36, 37]. Lipids were dissolved in a mixture of chloroform/methanol (2:1, v/v) to a concentration of 1 mg/mL. A volume of 25 L of the lipid solution was spread onto a pair of Pt electrodes and dried under reduced pressure (water aspirator; mmHg) for 2 hours. The electrodes were then placed into an electroformation chamber, which was filled with 0.1 or 0.2 mol/L sucrose. AC current (8 V, 10 Hz) was applied, and the voltage and frequency were reduced in steps to the final values of 1 V and 1 Hz [37]. Subsequently, the chamber was first drained into a beaker and then flushed with an equal volume of isomolar glucose solution, thus resulting in a suspension of GUVs containing entrapped sucrose in a 1:1 sucrose/glucose solution, which increases the contrast in a phase contrast setup and facilitates vesicle manipulation [38]. This procedure yields mostly spherical unilamellar vesicles, with diameters of up to 100 m.
An inverted optical microscope (Nikon Diaphot 200, objective 20/0.40 Ph2 DL) with micro-manipulating equipment (Narishige MMN-1/MMO-202) and a cooled CCD camera (Hamamatsu ORCA-ER; C4742-95-12ERG), connected via an IEEE-1394 interface to a PC running Hamamatsu Wasabi software, was used to obtain phase contrast micrographs. In the streaming mode, the camera provides 12-bit grayscale images at a rate of 8.9 images/s.
In the experiment, an individual spherical GUV is selected, fully aspirated into a glass micropipette whose inner diameter exceeds the vesicle’s diameter, and transferred from a solution containing solutes of very low membrane permeability (1:1 glucose/sucrose) into an iso-osmolar solution of a more permeable solute (glycerol, urea, or ethylene glycol), where the content of the micropipette is released, and the micropipette is subsequently removed. Vesicle response is recorded using a CCD camera mounted on the microscope.
2.2 Experimental results
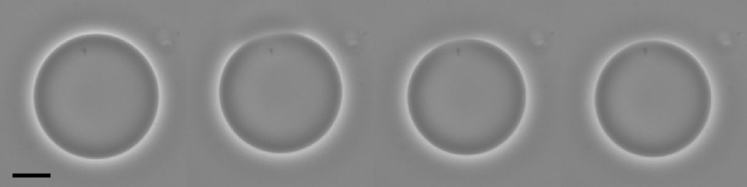
Upon transfer into a solution of permeating solute, vesicles start to swell until the membrane critical strain is reached. At that point, the membrane ruptures, and the vesicle ejects part of its internal solution (figure 1). After the burst, the membrane reseals, and another cycle of swelling starts. The observed sequences of swelling-burst cycles ranged from 3 to over 40 successive bursts, with an average in our sample being 15.4.
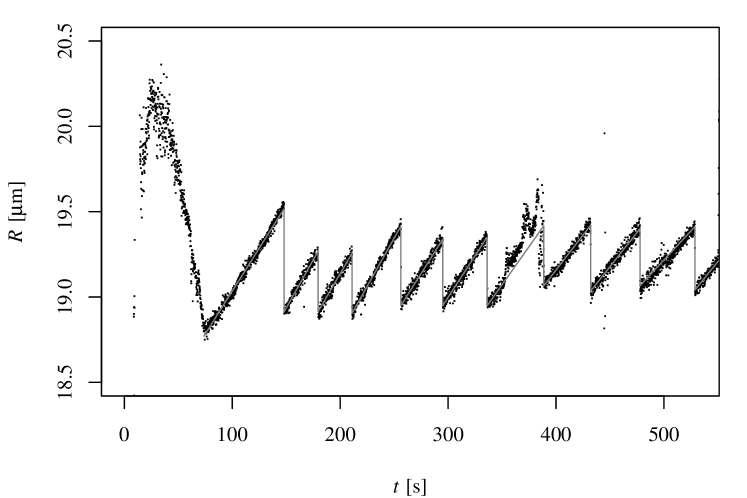
For a quantitative analysis, the radius of the vesicle cross-section in each recorded micrograph was determined with a GNU Octave script using a least-squares procedure for circle fitting [39]. Figure 2 shows a typical time course of vesicle radius after transfer. In about 80% of all cases, we observed a transient maximum of radius shortly after the transfer. We attribute this phenomenon to a slight hypertonicity of the target solution. This causes the vesicle to deflate rapidly, the rate of volume change being determined by the vesicle size and the permeability of phospholipid membrane for water. A deflated vesicle changes its shape from spherical into a shape which can be approximated with an oblate spheroid. Small deviations from this shape, which originate from the effects of gravity [40], are neglected here. Due to gravity, the axis of rotational symmetry is aligned with the vertical, which, in our experimental setup, also coincides with the direction of the optical axis. Thus, the observed cross-section radius is the oblate spheroid longer semiaxis, and consequently it increases with the decreasing volume, while the membrane area remains unchanged.
Concurrently with the initial vesicle deflation due to the slight hypertonicity, diffusion of permeating solute into the vesicle interior, accompanied by the osmotic influx of water, also takes place. The rate of this latter process is however dominated by the permeability of the membrane for the given solute (in our case, glycerol, urea, or ethylene glycol), and is thus much slower than the initial rapid deflation due to the mismatch in tonicity. With time, however, the initial trend of vesicle deflation is overturned and the vesicle starts inflating again. Inflation can be qualitatively divided into two phases. In the first phase, the vesicle is still partially deflated, and the influx of solute and the accompanying osmotic influx of water increases the vesicle volume, all while the membrane area remains unchanged. This “ironing” phase is characterized by the decrease of the radius of vesicle cross-section. At some point, the vesicle reaches a spherical shape, which can be observed as a local minimum of the cross-section radius.
Further permeating of solute into the vesicle interior, accompanied by the osmotic influx of water, causes the vesicle to inflate while maintaining a spherical shape. In this phase, the increase of vesicle volume can be observed as an increase of vesicle cross-section. In order to accomodate the increased vesicle volume, the membrane needs to stretch. This stretching process continues until the critical strain for the membrane is reached. At this point, the membrane ruptures, and part of the vesicle interior is ejected outside. When the vesicle volume is thus reduced, the membrane reseals again. As the concentration difference for the permeating solute persists, which serves as a driving force for the diffusion of the permeating solute into the vesicle interior, this means that at the same moment, the vesicle volume starts increasing again, and another swelling cycle commences. Repeated swelling-burst cycles give yield to the characteristic saw-tooth pattern, when the vesicle radius is plotted against the elapsed time (figure 2).
In total, 47 recordings of vesicle transfer from a 1:1 sucrose/glucose solution into an isomolar solution of glycerol, urea, or ethylene glycol were selected for further analysis. Out of these, 15 transfers were into glycerol (5 at 0.1 M and 10 at 0.2 M), 15 transfers into urea (8 at 0.1 M and 7 at 0.2 M), and 17 transfers into ethylene glycol (12 at 0.1 M and 5 at 0.2 M). Figure 3 shows the critical strain , where is the radius of a relaxed spherical vesicle, and is the radius of a critically strained vesicle. The median critical strain obtained for a total of 738 recorded vesicle bursts is 0.033, and mean critical strain is 0.038 with standard deviation 0.024.
A published value for the critical strain is around 0.04 [41, 42]. Our own estimate based on the first burst in the sequence alone is a little higher: [43]. This may indicate that the membrane might not always perfectly reseal, and that a local defect present in the membrane makes it more likely to rupture at a lower strain.

3 Theoretical section
In this section, we will briefly review a few theoretical models used for the description of solute permeation across cell membrane, starting from the most general Kedem-Katchalsky formalism, based on nonequilibrium thermodynamics [44], then showing how in the case of separate pathways for water and solute transport it can be simplified into a two-parameter model, and subsequently when a two-parameter model can be simplified into a one-parameter model in the case when the membrane permeability for water greatly exceeds its permeability for solute. We will discuss the influence of finite membrane elasticity on the apparent membrane permeability, review the work on the repetitive swelling-burst cycles, and conclude with the theory of the continuous transition between the “ironing” and the stretching regime of a vesicle which swells osmotically due to the permeation of a permeable solute.
3.1 Kedem-Katchalsky formalism
Starting from the principles of non-equilibrium thermodynamics, Kedem and Katchalsky arrived at a model with three parameters [20]. A simple qualitative argument can be offered why no less than three parameters are required for the description of the transport of solvent and solute across a membrane. In the simpler case of free diffusion of a single solute in a solvent, molecules of solute move relative to the molecules of solvent, and a single parameter – diffusion coefficient – is required to describe the friction between the solvent and the solute. In the case of membrane transport, two additional coefficients are required, one describing the friction between the molecules of solvent and the membrane, and another describing the friction between the molecules of solute and the membrane.
As their starting point, Kedem and Katchalsky [20] choose the rate of entropy production during the permeation of solute and water across the membrane separating the interior compartment from the exterior,
| (1) |
Here, and denote the chemical potential of solute and solvent (water), respectively, and and denote the number of moles of solvent and water entering the interior compartment per unit time.
Formulating Eq. (1) in terms of a dissipation function per unit area, , one obtains
| (2) |
Here, we have denoted for water and accordingly for the solute. Eq. (2) is a particular case of dissipation function, which in general assumes the form , where represent flows and represents the corresponding conjugate “forces”. In Eq. (2), the differences in chemical potential act as conjugate forces. We shall now rewrite Eq. (2) in a way where the driving forces will be quantities easier to evaluate experimentally.
For an ideal solution, the difference in chemical potential can be expressed as
| (3) |
where denotes the partial molar volume of the constituent, its mole fraction, the pressure difference between the external and the internal compartment, and , with being the molar gas constant and the absolute temperature. Assuming a dilute solution, where the volume fraction of the solute is low, , with being the molal concentration of solute, one can rewrite Eq. (3) for the solute:
| (4) |
where is the difference and is the average of the concentration of solute in both compartments. An analogous relation can be written for the solvent,
| (5) |
with . Introducing Eq. (4) and Eq. (5) into Eq. (2) and rearranging, one arrives at another expression for the dissipation function:
| (6) |
In Eq. (6), is expressed in terms of forces commonly used in the permeability studies: is the hydrostatic pressure, and is the osmotic pressure. The conjugate flows are , the total volume flow per unit area, and , the relative velocity of solute with respect to solvent, which serves as a measure of exchange flow.
It is assumed that each flow present in the system in general depends on all the forces acting in the system, and if the forces are sufficiently small, the relationship is linear:
Here, are phenomenological transport coefficients. The Onsager reciprocity relations [45, 46] state that the matrix of transport coefficients is a diagonal one, .
Applying this formalism to our case, we obtain
| (7) | ||||||||
| (8) |
where we have already taken into account . The second law of thermodynamics requires that the diagonal terms are non-negative, while the off-diagonal terms are only constrained by the relation . It is the off-diagonal terms though which are responsible for a concentration difference producing a volume flow, or vice versa.
For easier comparison with the experimental results, it is convenient to transform to another set of coefficients. One of them is the reflection coefficient , introduced with
| (9) |
Two special cases which can be considered include a non-selective membrane () and an ideally selective membrane, permeable only for the solute (). Another parameter commonly defined is the mobility of the solute :
| (10) |
It can be shown that is chosen in such a way that for permeability measurement at constant volume (), one can write .
Expressing the volume flow and the exchange flow in terms of , one obtains
| (11) | ||||
| (12) |
Eq. (11) and Eq. (12) obtained above pertain to a two-component system, in which binary solutions of the same solvent and solute are separated by a membrane. In order to allow for a comparison with the experimental results, we need to consider a slightly more complicated system, comprising of a membrane separating two ternary solutions of the same solvent and two different solutes. The membrane is permeable for the solvent and one of the solutes, but impermeable for the other solute. As in the previous example, we treat the solution as ideal.
For a dilute solution, the difference in the chemical potential for the solvent (Eq. (5)) can now be written as
| (13) |
where the index pertains to the permeating solute, and the index to the non-permeating solute. While Eq. (4) remains valid, we have to consider the contribution of the non-permeating solute to the difference in osmotic pressure,
| (14) |
Considering the same flows as before, one can write the expression for the dissipation function Eq. (2), and when substituting into it the expressions for the difference in the chemical potential for the solute, Eq. (4), and solvent, Eq. (13), one obtains the expressions for the forces conjugate to the flows:
| (15) | ||||
| (16) |
Using the expressions (15,16), one can obtain expressions analogous to (11,12), obtained in the case of a binary solution:
| (17) | ||||
| (18) |
A more condensed expression of Eq. (18) can be obtained if Eq. (17) is taken into account:
| (19) |
In dilute solutions, is often negligible with respect to . On the other hand, the contribution is important. In many biologically relevant experiments, while .
3.2 Two-parameter model
Through the reflection coefficient , the Kedem-Katchalsky formalism resolves the competition between solvent and solute being transported through a shared pathway, e.g., a cotransporting channel permeable to both the solute and the solvent. The formalism itself, however, applies to any simple transport problem, regardless of whether a cotransporting channel is present or not [47]. In the latter case, not all three parameters are independent. It can be shown [20] that in this case, can be written as:
| (20) |
Introducing Eq. (20) into Eqs. (17,19), one obtains the transport equations for the case where the solute and the solvent do not compete for the same cotransporting channel, e.g., in the case where they both diffuse through the phospholipid bilayer. Along the way, we will use the following simplifications: , , and introduce the notation more appropriate for describing the experimental setup: , , . Here, is the total volume of the internal compartment, is the area of the membrane, is the number of moles of permeating solute inside the internal compartment, and is the permeability of the membrane for the permeating solute. Using the described simplifications, the transport equations (17,18) can be written as
| (21) | ||||
| (22) |
Two terms contribute to the volume change in Eq. (21): the first one corresponds to the transport of solvent due to the osmotic pressure gradient, and the second one to the transport of solute. For dilute solutions, the second term is much smaller. Similarly, in Eq. (22), the first term is proportional to , which makes this term negligible for dilute solutions.
As an example, we will apply the two-parameter model to the case which corresponds to the experimental setup: a single vesicle filled with a non-permeating solute is transferred to a reservoir filled with an isotonic solution of a permeating solute. Even though the solutions are isotonic, permeating solute diffuses into the vesicle, thus causing an osmotic pressure, which is in turn balanced by the inflow if water. Two cases can be distinguished: a flaccid vesicle changes its shape and becomes ever more spherical, while a spherical vesicle has already reached its limiting shape and can only grow by stretching the membrane. In this case, , , and initially, , ; which is equal to .
In the case of a flaccid vesicle, membrane area is constant, and the system can be characterized with the vesicle volume and the amount of permeating solute in the vesicle interior, . Using the simplifications , which is appropriate for dilute solutions, Eq. (21) and Eq. (22) transform into:
| (23) | ||||
| (24) |
Here, denotes the initial volume of the vesicle, and denotes the initial partial concentration of the non-permeating solute inside the vesicle. Often, the permeability of membrane for water is expressed as water filtration coefficient instead of hydraulic conductivity , the two quantities being bound by the relation . Alternatively, one can use the reduced volume , instead of , with being the volume of a sphere with an area equal to :
| (25) | ||||
| (26) |
Here, is the initial reduced volume of the vesicle.
The other case is a spherical vesicle. In this case, neither its area nor its volume are constant; both can be, however, expressed in terms of the vesicle radius , which is a convenient parameter in this case. Substituting and into Eq. (23) and Eq. (24), one obtains:
| (27) | ||||
| (28) |
Here, is the initial vesicle radius; .
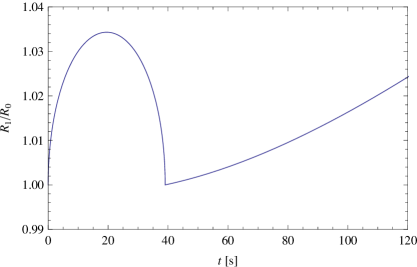
As figure 2 shows, both flaccid and spherical regimes can appear in the course of a single vesicle transfer. The two-parameter model allows us to mimic the same behaviour. Figure 4 shows a time course of the radius of a vesicle cross-section upon transfer into a slightly hypertonic solution of a solute which can permeate the vesicle membrane. A spherical vesicle with is initially filled with a 0.1 mol/L solution of a solute which cannot permeate the membrane, then transferred into a 0.105 mol/L solution of a solute which can permeate the membrane (). Other parameters used were , . Upon transfer into a hypertonic solution, two processes are competing: the efflux of water, driven by the osmotic pressure mismatch, is the quicker of the two, while the influx of the solute, accompanied by the concomitant influx of water, is the slower one. Therefore, we first have to solve the system defined by Eq. (23) and Eq. (24), with and as initial conditions. A deflated vesicle deforms into an approximate oblate spheroid; since in the experimental setup, the optical axis is usually aligned with the symmetry axis of the spheroid, the cross-section radius increases with the decreasing volume. Introducing and , being the spheroid visible semiaxis, one obtains the following relationship between and :
| (29) |
After a certain time, the vesicle becomes spherical again. From this point onwards, it starts to grow while maintaining a spherical shape, and its behaviour is governed by Eq. (27) and Eq. (28), with initial conditions and equal to the concentration of the permeable solute, which diffused into the vesicle during the previous step.
3.3 One-parameter model
Vesicle swelling is a two step process: in the first step, permeating solute diffuses into vesicle interior and thus causes osmotic non-equilibrium, and in the second step (which constitutes the bulk of swelling), it is followed by the water influx, which balances the osmotic non-equilibrium. Eq. (23) and Eq. (24) can be regarded as a kinetic system. In the systems treated here, however, the influx of water is a much faster process than the solute diffusion, and thus Eq. (24) represents the rate-limiting step. In the case where solute diffusion is a much slower process than the influx of water, a simpler description can be obtained.
In this simpler description, Eq. (24) is retained, while Eq. (23) is replaced by an instantaneous osmotic equilibrium:
| (30) |
With and being constant, this leads to . Taking this into account, and inserting Eq. (30) into Eq. (24), one obtains
| (31) |
Eq. (31) is general in the case that both and may vary with time. Again, two special cases can be considered: flaccid vesicles, where , and spherical vesicles, where both and can be expressed in terms of the vesicle radius . In the latter case, a further simplification is possible by assuming that initially, the vesicle was spherical and in osmotic equilibrium, i.e., . In this case, Eq. (31) can be rewritten into
| (32) |
which can be readily integrated:
| (33) |
As long as deformations are small, exhibits linear growth, . In this model, which assumes that the membrane permeability for water exceeds the permeability for solute by such a large margin that water transport can be considered instantaneous, the only parameter governing the vesicle volume change is . Despite its simplifications, the one-parameter model has proved to be useful in certain situations [48, 49].
3.4 The influence of membrane elasticity
The treatment of osmotic swelling of spherical vesicles presented so far assumes that the membrane is infinitely “soft” and does not oppose its stretching as the vesicle swells. In reality, the stretching modulus of a phospholipid membrane is finite. This means that the apparent value of membrane permeability derived from the experiments with osmotic swelling of spherical vesicles is slightly underestimated: because the vesicle membrane opposes its stretching, the radius increases slightly less in a given interval of time than it would if the limiting factor was the membrane permeability alone.
It is common to assume that the membrane area has a certain relaxed area , and expand the free energy of membrane stretching around this value:
| (34) |
Here, is the membrane stretching modulus, and . We consider now the work , needed to increase the radius of a spherical vesicle by a small amount . The corresponding change in the free energy is
Substituting , , and equating with the change in the free energy, one obtains:
| (35) |
In the case of osmotic equilibrium, this pressure is balancing the difference in the osmotic pressure: .
When the pressure exerted by the membrane is taken into account, Eq. (23) transforms into
| (36) |
Here, and , where , , and is defined by Eq. (35). In the system defined by Eq. (27) and Eq. (28), the vesicle membrane would in theory grow indefinitely because the osmotic pressure is never entirely balanced. A membrane which opposes vesicle swelling limits the extent of swelling by the condition .
Rewriting Eq. (36) for a spherical vesicle, one obtains an equation analogous to Eq. (28):
| (37) |
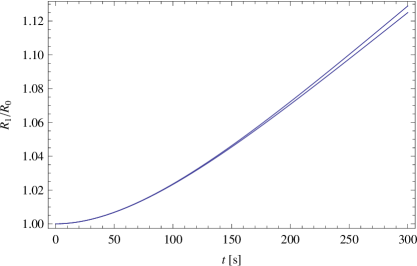
For realistic parameter values, membrane stretching only adds a minor correction to the vesicle swelling rate. Figure 5 shows the swelling of a spherical vesicle upon transfer into an isotonic medium of permeating solute (), obtained by the numerical solution of the two-parameter system defined by Eq. (37) and Eq. (28), with and as initial conditions. The upper curve disregards the membrane stretching energy (), while the lower uses the value . Other parameters used in calculation are , , , and at .
3.5 Swelling-burst cycle
In reality, vesicles approximately follow the swelling course shown in Figure 5 only until the critical strain of the membrane is reached. Once the critical strain is reached, the membrane ruptures, and the vesicle bursts. Subsequently, the membrane is resealed and another cycle of swelling commences. Experimentally, long trains of vesicle bursts have been observed.
The phenomenon has been predicted and thoroughly worked out from the theoretical point of view by Kozlov and Markin [50]; apparently unaware of their work, other authors attempted the same decades later [51]. Experimentally, the effect has been observed on erythrocytes when their suspending medium has been exchanged with a hypotonic one [52], on giant adhering vesicles [53], on giant vesicles with equinatoxin-II-induced pores [54], on giant vesicles with photoinduced pores [55], on giant vesicles with mellitin-induced pores [56], and on giant vesicles upon transfer from a solution of a non-permeating solute to a solution of a permeating solute [37].
Kozlov and Markin [50] consider a vesicle filled with an osmotically active solute (i.e., non-permeating), and write an expression for the osmotic influx of water:
| (38) |
where is the permeability of membrane for water (hydraulic conductivity), is the membrane area, is the difference in osmotic pressure, and is the difference in the hydraulic pressure. Eq. (38) is identical to Eq. (36) above.
The vesicle is treated as spherical, its radius denoted by . Due to osmotic swelling, , where denotes the value of a non-expanded vesicle. Denoting , the corresponding changes in the vesicle volume and membrane area are and , respectively. A stretched membrane creates a pressure inside the vesicle – cf. Eq. (35), which opposes the swelling,
with being the membrane stretching modulus. The elastic free energy associated with membrane stretching is given according to Eq. (34):
A pore present in the membrane lowers and thus reduces this energy term. However, on the other hand, creating a tension pore increases the total energy by the edge energy, equal to the product of the lenght of the pore edge, , and the linear tension :
| (39) |
Here, refers to the radius of a circular tension pore. Eq. (39) is an approximate expression, valid for large pores. A consequence of a pore having a non-zero energy is that the intravesicular pressure does not drop to zero after the membrane ruptures. Instead, a residual intravesicular pressure remains:
| (40) |
This residual intravesiculare pressure causes the efflux of the intravesicular solution once the vesicle ruptures. The efflux is approximately equal to
| (41) |
Here denotes the viscosity.
Substituting Eq. (40) into Eq. (36) and integrating it, one obtains the time course of vesicle volume upon transfer into a hypotonic medium:
| (42) |
Here, . The elastic energy of a vesicle with a pore is the sum of the membrane stretching energy and the linear energy of the pore:
| (43) |
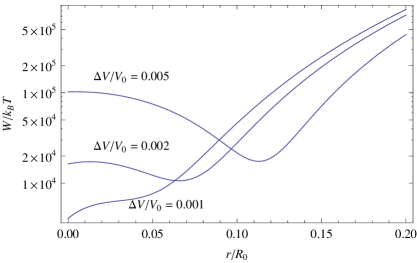
At a given , the area of the tension pore adapts in such a way as to minimize the total energy given by Eq. (43). If is plotted against pore radius for realistic values of and and for different values of , one can prove that for low values of , is a monotonously increasing function of pore radius (figure 6). If is increased, we reach a critical value at which has an inflection point. By increasing even further, a local minimum becomes a global one, meaning that at some non-zero pore radius, the energy of the vesicle is lower than at , and by overcoming the energy barrier, the vesicle can jump from a poreless state into a state with a pore.
Kozlov and Markin show that based on the difference between the influx and the efflux, given by Eq. (38) and Eq. (41), three different scenarios are possible:
instant efflux of the whole vesicle interior steadily open pore pulse-wise regime
Kozlov and Markin conclude that for realistic parameter values, the pulse-wise regime is the most probable one, which is consistent with our own observations.
In the pulse-wise regime, it is possible to infer some relationships between relevant quantities during successive bursts by employing two assumptions:
-
1.
During the swelling phase, the amount of the non-permeating solute inside the vesicle remains constant.
-
2.
At burst, partial concentrations of both the permeating and the non-permeating solute remain constant.
The first assumption is valid if the characteristic time for solute exchange is long compared with the time course of the experiment; the second assumption assumes that the interior of the vesicle is well mixed.
While the validity of the above assumptions is more general, some simple formulas can be obtained for the linearized one-parameter case. Let us consider a vesicle in the pulse-wise regime (figure 7). Due to osmotic swelling, the vesicle radius increases from its relaxed value until a critical value is reached, at which the critical strain for the membrane is reached, upon which membrane ruptures, ejects a part of the internal volume, and reseals in a relaxed state. As the amounts to a few percent, Eq. (33) can be linearized.

Eq. (33) is valid only up to the first burst. Deriving it, we assumed . We can derive the concentration of non-permeating solute in subsequent swelling cycles using the assumptions above. Denoting the amount of non-permeating solute inside the vesicle after bursts by , the concentration of non-permeating solute inside the vesicle after bursts by , , and , one can write:
A general expression for is then
| (44) |
In our experimental setup, holds. Substituting with in the derivation of Eq. (33), one obtains the temporal dependence of vesicle radius after bursts:
| (45) |
Or, linearized, . The time between two successive bursts is then
Denoting and expressing , , one obtains after linearization for the time elapsed between the -th and the -th burst:
| (46) |
In this linear model, the time elapsed between subsequent bursts increases linearly with .
As the formation of a tension pore is a stochastic event, is not a constant, but can vary from one burst to another. To account for this, Eq. (44) can be written as
| (47) |
where the index denotes each of the bursts. We have introduced , the volume of vesicle at which the critical strain for the membrane is reached in the -th burst.
3.6 Critical phenomena in osmotic swelling
Upon transfer of vesicles from a solution of a non-permeating solute into a solution of a permeating solute, vesicles often exhibit a transient increase of cross-section radius (figure 2). We attribute this behaviour to a slight hypertonicity of the target solution, which causes the vesicles to slightly deflate and change their shapes from an initially spherical shape into an oblate spheroid. The concentration gradient, however, drives the permeating solute into the vesicle interior, and the ensuing osmotic pressure difference serves as a driving force for water, which causes the vesicle to re-inflate. The inflation process has two stages: initially, the vesicle is flaccid and approaching the spherical shape, while in the second stage, the vesicle is spherical, its membrane being increasingly stretched.
It has been shown that an inflating vesicle reaches the end of the first stage critically, through a continous transition. This was initially demonstrated for unstretchable membrane [57], and later the theory has been extended in order to account for membrane stretching [43]. We shall provide a brief outline of the underlying theory, which employs a thermodynamic framework [58].
Let us consider a vesicle with entrapped molecules of a non-permeating solute. We assume that the vesicle is brought into a thermal equilibrium with the surroundings, characterized by temperature and pressure . Both the vesicle volume and the surface area are treated as free, independent thermodynamic variables. The Gibbs free energy of the system contains volume and surface contributions:
| (48) |
Considering the enclosed solution as ideal and dilute, one can write
| (49) |
The surface terms comprise the stretching and the bending parts,
| (50) |
The stretching part is assumed to have a minimum at some value ; a quadratic expansion is used:
In regarding the bending free energy, only the contribution from undulation entropy is included, which describes the suppression of bending fluctuations as the vesicle shape approaches a sphere. Assuming small fluctuations around a spherical shape, it is given by [57]
| (51) |
Here, is the total number of independent bending modes contributing to the membrane thermodynamics, and is the vesicle reduced volume. It is important to note that through the reduced volume (which depends on both volume and surface area), provides the coupling between the volume part and the surface part . The number of modes is not known in advance and is a parameter extracted from the experiment.
Using Eqs. 48–51, the Gibbs free energy of a vesicle is defined via , as well as and . By minimizing with respect to and the equilibrium free energy can be obtained. Introducing an intensive area and its relaxed value along the way, one obtains a set of equations from which and can be calculated:
| (52) | ||||
| (53) |
In Eq. (52) and Eq. (53), we have defined
| (54) |
and parameters and , the first one related to the finite vesicle size, and the second one to the finite membrane stretchability:
| (55) | ||||||
| (56) |
Two limiting cases of the described systen can be considered. Setting , while keeping the stretching modulus finite brings us to the usual thermodynamic limit of an infinite system. In this limit, Eq. (52) and Eq. (53) are degenerate and yield the expected equilibration of the internal and the external pressure: . The second limiting case corresponds to an unstretchable membrane: , . In this case, Eq. (53) requires , while Eq. (52) yields the behaviour studied in Ref. [57], with exhibiting a critical behaviour as .
Away from either limit, Eq. (52) and Eq. (53) yield
| (57) |
We can see from Eq. (57) that attaining a perfectly spherical shape () would reqire infinite strain , which is not realistic. The deviation of the area from its relaxed state, , is inversely proportional to the deviation of the vesicle shape from a sphere, . As , it takes a highly swollen vesicle, , to produce a significant membrane strain .
In order to provide an adequate description of the transition, we define the control parameter , proportional to the number of enclosed molecules, and order parameter , which serves as a measure of the deviation of vesicle shape from a sphere. Solving Eq. (52) and Eq. (53) for in the vicinity of the transition, one obtains
| (58) |
For , , which is appreciable, while for , , which is very small. The transition occurs over a region, determined by . Thus, both the finite vesicle size and the membrane stretchability contribute to widening of the transition. In the limit , i.e., for an infinitely large vesicle enclosed by a non-stretchable membrane, has a discontinuity at . Setting while keeping finite yields back the results obtained in [57]. Which of the two factors entering is dominant, or , depends on their ratio
Using the values from our experiments – –, – – as well as [59], we obtain –0.1. Therefore, in our conditions, the transition width is governed by the finite stretching modulus, and can be approximated by
| (59) |
While Eq. (58) fully describes the law of corresponding states for osmotic swelling of nearly spherical vesicles, we would like to transform it into a form which would allow us to compare it with the experiment, i.e., with the function .
The simpler part is the transformation of the time axis. As the concentration of the permeating solute inside the vesicle is approximately two orders of magnitude lower than its concentration in the surrounding medium, the former can be neglected, yielding , which further leads to
| (60) |
Eq. (60) gives a simple linear relationship between the time and the control parameter .
The transformation for the radius is less straightforward. Here we only reproduce the result, which is worked out in detail in [43]. Denoting , where is the radius of vesicle projected cross-section, one arrives at the following scale and shift transformation,
| (61) |
where and . Using the permeability and the transition width as two fitting parameters, one can verify that the experimental data for all recorded vesicle transfers collapse onto a single universal function,
| (62) |
Fitting Eq. (62) to the recorded data of vesicle transfer into an isotonic solution of urea yields the permeability of membrane for urea, . The obtained permeabilities for glycerol and ethylene glycol, on the other hand, exhibit concentration dependence. The values obtained for glycerol range from 0.0053 at M to at 0.2 M, and those for ethylene glycol range from at 0.1 M to at 0.2 M.
4 Experimental analysis
In this section, we will present a method for determining membrane permeability for a given solute from the analysis of swelling-burst cycles [39], and demonstrate that its results are consistent with the analysis of the osmotic swelling of flaccid vesicles [43].
In section 3, Eq. (45) has been obtained, which, when linearized, shows that before the first burst, the slope of equals to the permeability , and after bursts, the slope becomes if all bursts are equal, and if they are not. The underlying assumptions are that the vesicle is spherical at the onset of the first swelling cycle, and the concentration of the non-permeating solute in its interior is equal to the concentration of the permeating solute outside.
These assumptions are not always met. In 37 out of 47 recorded vesicle transfers in our experiments, the dependence of the vesicle cross-section radius as a function of time exhibits an initial transient maximum or “bulge” like the one seen in Figure 2. In those cases, the vesicle is filled with a mixture of a non-permeating and permeating solute already at the onset of the first swelling cycle, and Eq. (45) needs a small correction to take that into account.
An estimate of the mole fraction of the non-permeating and the permeating solute at the onset of the first swelling cycle can be obtained from the initial transient maximum. If we approximate the shape of a partially deflated vesicle with an oblate spheroid and denote , where is the radius of the vesicle cross section at the crest of the “bulge” and is its value in the “valley”, i.e., at the onset of the first swelling cycle, we can compute the reduced volume of the vesicle () using Eq. (29).
We can show that the reduced volume of the vesicle is equal to the mole fraction of the osmotically active solute at the onset of the first swelling cycle. At the crest of the bulge, the vesicle is flaccid with a volume , and containing moles of non-permeating solute. At the onset of the first swelling cycle, the vesicle is spherical with a radius , and containing moles of non-permeating solute and moles of permeating solute. As the rapid osmotic exchange of water ensures that the total concentration is equal in both cases, , it follows
We can amend Eq. (45) with this correction, yielding
| (63) |
We need to note that taking the value of at the onset of a swelling cycle is an approximation, as actually changes during the course of a swelling cycle.
Treating the vesicle swelling-burst cycles as piecewise linear, the slope of the -th cycle can be expressed as
| (64) |
While membrane permeability for the permeating solute can be in principle computed from an individual vesicle-swelling phase between two bursts, a more reliable estimate is obtained by averaging it over all bursts in the cycle:
| (65) |
Eq. (65) gives the estimate for the membrane permeability based on a single recording of a vesicle transfer. Averaging over several recordings of vesicle tranfer are needed to obtain a more reliable estimate of membrane permeability.
Table 1 summarizes the permeability data for glycerol, urea, and ethylene glycol, obtained by using two different analyses. The term “burst train” refers to the analysis presented here, while the term “critical swelling” refers to the alternative analysis presented in the preceding section [43], where vesicle transition from a flaccid to a spherical state before the first burst is observed.
| Permeability [m/s] | ||||||||
| solute | “burst train” | “critical swelling” | ||||||
| 0.1 M | 0.2 M | 0.1 M | 0.2 M | |||||
| glycerol | 0.0077 | 0.0009 | 0.016 | 0.003 | 0.0053 | 0.019 | 0.06 | |
| urea | 0.014 | 0.001 | 0.013 | 0.001 | ||||
| ethylene glycol | 0.054 | 0.005 | 0.10 | 0.01 | 0.046 | 0.006 | 0.085 | 0.01 |

One can see that in the case of urea, the estimate for membrane permeability is independent of solute concentration, which is consistent with our finding in [43]. On the other hand, both polyols exhibit a concentration dependence of the (apparent) membrane permeability, which is again in agreement with our own recent findings [43]. The trend is even more apparent in Figure 8. A possible explanation for the concentration dependence of the apparent membrane permeability is strong evidence for the affinity of polyols to phospholipid headgroups [60, 61], which results in the solute concentration adjacent to the membrane being larger than in the bulk solution, which consequently leads to an apparent permeability coefficient which is larger than the actual one. This affinity of polyols to phospholipid headgroups may also account for a large scatter of published data on membrane permeabilities for polyols.
5 Discussion
The existance of reproducible techniques for producing giant unilamellar vesicles (GUVs) [35, 62], the availability of phase-contrast microscopy and high-resolution digital cameras, along with the efficient procedures for automated extraction of vesicle contour from the images and determination of the radius of vesicle cross-section [39], render the determination of membrane permeability of GUVs a viable alternative to the established techniques employing either dynamic light scattering on sub-micrometer vesicles or planar lipid membranes.
GUVs were used before in studies of membrane permeability [32]. The study by Boroske et al., however, was designed to observe osmotic shrinking of GUVs, while in our study vesicles swell osmotically (with the exception of the initial phase, where a transient osmotic shrinking may be observed). Osmotic swelling of vesicles in a controlled manner guarantees a simpler spherical geometry, through which both the vesicle area and its volume are experimentally accessible variables. By contrast, in the experiment of Boroske et al., vesicle volume was the only experimentally observable variable, and the authors had to come up with a plausible explanation for the apparently “missing” membrane area.
On a very superficial level, the continuous transition between the “ironing” and the stretching regime of a vesicle which swells osmotically due to the permeation of a permeable solute might seem similar to the “minimal volume” technique employed by Sha’afi et al. (cf. Fig. 3 in [19] and Fig. 1 in [43]). However, one needs to be aware of the fact that Fig. 3 in [19] shows vesicle volume as a function of time, while Fig. 1 in [43] shows the radius of a non-spherical vesicle cross-section, and throughout the course shown in the diagram, vesicle volume is monotonously increasing. In our experiment, minimal vesicle volume appears at the top of the initial bulge (visible around 40 s on the graph in figure 2). We have not attempted an analysis analogous to the one performed by Sha’afi et al. [19] or Hill and Cohen [22], because the initial moment in which the vesicles are brought in contact with the target solution is not defined as well as in the stopped flow experiments. The authors of earlier studies, on the other hand, seem to be unaware of the critical transition between the “ironing” and the stretching regime in the course of osmotical swelling of a vesicle.
While offering a direct visualization of osmotic swelling, the method described here has its limitations. The three solutes tested here – glycerol, urea, and ethylene glycol – induce significant changes in vesicle size on the timescale of minutes. With solutes which are much more or much less permeable, the rate of changes may be either too fast for video camera, or so slow that other effects start to dominate the experiment (e.g., convection in the measuring chamber). Another limitation is imposed by the refractive index of the solution. The refractive index of the target solution in general differs from that of the vesicle interior, and the difference between the two refractive indices increases with the increasing concentration of solutions. At high enough concentration, the halo around the vesicle becomes blurred, and the algorithm used to determine vesicle contour [39] fails. With our present equipment, we estimate that concentrations significantly higher than 0.2 mol/L are outside our reach.
Finally, we want to compare the results of two techniques dubbed “burst train” and “critical swelling” in Table 1. As can be seen, they produce consistent results which are within the experimental error of each other. The experimental error estimates for both methods are also approximately the same. The “burst train” technique is more forgiving towards minor glitches, such as vesicle temporarily drifting slighly out of focus, which results in an overestimate of vesicle radius (seen around 370 s in figure 2). However, one needs to keep in mind that the “burst train” technique requires approximately 5 times as much data as the “critical swelling”, and consequently, minor glitches are more likely to occur during a longer period. We therefore lean towards recommending the “critical swelling” technique, which is less resource-greedy while giving the results with the same precision. Our recommended procedure is therefore to keep recording the vesicle transfer up to the first burst (which is easy to notice during the experiment), and carry out the analysis desribed in Ref. [43].
References
- Meyer [1899] H. Meyer, Welche Eigenschaft der Anästhetica bedingt ihre narkotische Wirkung?, Arch. Exp. Pathol. Pharmakol. 42 (1899) 109–118.
- Overton [1901] C. E. Overton, Studien über die Narkose: Zugleich ein Beitrag zur allgemeinen Pharmakologie, Gustav Fischer, Jena, 1901.
- Preston et al. [1992] G. M. Preston, T. Piazza Caroll, W. B. Guggino, P. Agre, Appearance of water channels in xenopus oocytes expressing red cell CHIP28 protein, Science 256 (1992) 385–387.
- Pike [2006] L. J. Pike, Rafts defined: a report on the Keystone symposium on lipid rafts and cell function, J. Lipid Res. 47 (2006) 1597–1598.
- Al-Awqati [1999] Q. Al-Awqati, One hundred years of membrane permeability: does Overton still rule?, Nature Cell. Biol. 1 (1999) E201–E202.
- Missner and Pohl [2009] A. Missner, P. Pohl, 110 years of the Meyer-Overton rule: Predicting membrane permeability of gases and other small compounds, Chem. Phys. Chem. 10 (2009) 1405–1414.
- Heimburg and Jackson [2007] T. Heimburg, A. D. Jackson, The thermodynamics of general anesthesia, Biophys. J. 92 (2007) 3159–3165.
- Nagle et al. [2008] J. F. Nagle, J. C. Mathai, M. L. Zeidel, S. Tristram-Nagle, Theory of passive permeability through lipid bilayers, J. Gen. Physiol. 131 (2008) 77–85.
- Mueller et al. [1962] P. Mueller, D. O. Rudin, H. T. Tien, W. C. Wescott, Reconstitution of cell membrane structure in vitro and its transformation into an excitable system, Nature 194 (1962) 979–980.
- Bangham [1968] A. D. Bangham, Membrane models with phospholipids, Prog. Biophys. Mol. Biol. 18 (1968) 27–95.
- Cohen and Bangham [1972] B. E. Cohen, A. D. Bangham, Diffusion of small non-electrolytes across liposome membranes, Nature 236 (1972) 173–174.
- Verkman [1995] A. S. Verkman, Optical methods to measure membrane transport processes, J. Membr. Biol. 148 (1995) 99–110.
- Tien [1974] H. T. Tien, Bilayer lipid membranes (BLM), theory and practice, Marcel Dekker, New York, 1974.
- Finkelstein [1976] A. Finkelstein, Water and nonelectrolyte permeability of lipid bilayer membranes, J. Gen. Physiol. 68 (1976) 127–135.
- Orbach and Finkelstein [1980] E. Orbach, A. Finkelstein, The nonelectrolyte permeability of planar lipid bilayer, J. Gen. Physiol. 75 (1980) 427–436.
- Walter and Gutknecht [1986] A. Walter, J. Gutknecht, Permeability of small nonelectrolyte molecules through lipid bilayer-membranes, J. Membr. Biol. 90 (1986) 207–217.
- Bangham et al. [1967] A. Bangham, J. de Gier, G. D. Greville, Osmotic properties and water permeability of phospholipid liquid crystals, Chem. Phys. Lipids 1 (1967) 225–246.
- Jacobs [1933] M. H. Jacobs, The simultaneous measurement of cell permeability to water and to dissolved substances, J. Cell. Comp. Physiol. 2 (1933) 427–444.
- Sha’afi et al. [1970] R. I. Sha’afi, G. T. Rich, D. C. Mikulecky, A. K. Solomon, Determination of urea permeability in red cells by minimum method. A test of the phenomenological equations, J. Gen. Physiol. 55 (1970) 427–450.
- Kedem and Katchalsky [1958] O. Kedem, A. Katchalsky, Thermodynamic analysis of the permeability of biological membranes to non-electrolytes, Biochim. Biophys. Acta 27 (1958) 229–246.
- de Gier et al. [1971] J. de Gier, J. G. Mandersloot, J. V. Hupkes, R. N. McElhaney, W. P. van Beek, Mechanism of non-electrolyte permeation through lipid bilayers and through biomembranes, Biochim. Biophys. Acta 233 (1971) 610–618.
- Hill and Cohen [1972] M. W. Hill, B. E. Cohen, A simple method of determining relative permeabilities of liposomes to non-electrolytes, Biochim. Biophys. Acta 290 (1972) 403–407.
- de Gier [1993] J. de Gier, Osmotic behaviour and permeability properties of liposomes, Chem. Phys. Lipids 64 (1993) 187–196.
- Paula et al. [1996] S. Paula, A. G. Volkov, A. N. Van Hoek, T. H. Haines, D. W. Deamer, Permeation of protons, potassium ions, and small polar molecules through phospholipid bilayers as a function of membrane thickness, Biophys. J. 70 (1996) 339–348.
- Shoemaker and Vanderlick [2002] S. D. Shoemaker, T. K. Vanderlick, Stress-induced leakage from phospholipid vesicles: Effect of membrane composition, Ind. Eng. Chem. Res. 41 (2002) 324–329.
- Montal and Mueller [1972] M. Montal, P. Mueller, Formation of bimolecular membranes from lipid monolayers and a study of their electrical properties, Proc. Natl. Acad. Sci. USA 69 (1972) 3561–3566.
- Seifert [1997] U. Seifert, Configurations of fluid membranes and vesicles, Adv. Phys. 46 (1997) 13–137.
- Pencer et al. [2001] J. Pencer, G. F. White, F. R. Hallett, Osmotically induced shape changes of large unilamellar vesicles measured by dynamic light scattering, Biophys. J. 81 (2001) 2716–2728.
- Pencer and Hallett [2003] J. Pencer, F. R. Hallett, Effects of vesicle size and shape on static and dynamic light scattering measurements, Langmuir 19 (2003) 7488–7497.
- Brunner et al. [1980] J. Brunner, D. E. Graham, H. Hauser, G. Semenza, Ion and sugar permeabilities of lecithin bilayers: Comparison of curved and planar bilayers, J. Membr. Biol. 57 (1980) 133–141.
- Barry and Diamond [1984] P. H. Barry, J. M. Diamond, Effects of unstirred layers on membrane phenomena, Physiol. Rev. 64 (1984) 763–872.
- Boroske et al. [1981] E. Boroske, M. Elwenspoek, W. Helfrich, Osmotic shrinkage of giant egg-lecithin vesicles, Biophys. J. 34 (1981) 95–109.
- Wang et al. [2010] J.-Y. Wang, J. Chin, J. D. Marks, K. Y. C. Lee, Effects of PEO-PPO-PEO triblock copolymers on phospholipid membrane integrity under osmotic stress, Langmuir 26 (2010) 12953–12961.
- Carlsen et al. [2011] A. Carlsen, N. Glaser, J.-F. Le Meins, S. Lecommandoux, Block copolymer vesicle permeability measured by osmotic swelling and shrinking, Langmuir 27 (2011) 4884–4890.
- Angelova and Dimitrov [1986] M. I. Angelova, D. S. Dimitrov, Liposome electroformation, Faraday Discuss. Chem. Soc. 81 (1986) 303–311.
- Heinrich and Waugh [1996] V. Heinrich, R. E. Waugh, A piconewton force transducer and its application to measurement of the bending stiffness of phospholipid membranes, Ann. Biomed. Eng. 24 (1996) 595–605.
- Peterlin and Arrigler [2008] P. Peterlin, V. Arrigler, Electroformation in a flow chamber with solution exchange as a means of preparation of flaccid giant vesicles, Colloid. Surface. B 64 (2008) 77–87.
- Dimova et al. [2006] R. Dimova, S. Aranda, N. Bezlyepkina, V. Nikolov, K. A. Riske, R. Lipowsky, A practical guide to giant vesicles. Probing the membrane nanoregime via optical microscopy, J. Phys.: Condens. Matter 18 (2006) S1151–S1176.
- Peterlin et al. [2009] P. Peterlin, G. Jaklič, T. Pisanski, Determining membrane permeability of giant phospholipid vesicles from a series of videomicroscopy images, Meas. Sci. Technol. 20 (2009) 055801.
- Döbereiner et al. [1997] H.-G. Döbereiner, E. Evans, M. Kraus, U. Seifert, M. Wortis, Mapping vesicle shapes into the phase diagram: A comparison of experiment and theory, Phys. Rev. E 55 (1997) 4458–4474.
- Evans and Rawicz [1990] E. Evans, W. Rawicz, Entropy-driven tension and bending elasticity in condensed-fluid membranes, Phys. Rev. Lett. 64 (1990) 2094–2097.
- Bloom et al. [1991] M. Bloom, E. Evans, O. G. Mouritsen, Physical properties of the fluid lipid-bilayer component of cell-membranes—a perspective, Q. Rev. Biophys. 24 (1991) 293–397.
- Peterlin et al. [2012] P. Peterlin, V. Arrigler, E. Haleva, H. Diamant, Law of corresponding states for osmotic swelling of vesicles, Soft Matter 8 (2012) 2185–2193.
- Katchalsky and Curran [1965] A. Katchalsky, P. F. Curran, Nonequilibrium thermodynamics in biophysics, Harvard University Press, 1965.
- Onsager [1931a] L. Onsager, Reciprocal relations in irreversible processes. I., Phys. Rev. 37 (1931a) 405–426.
- Onsager [1931b] L. Onsager, Reciprocal relations in irreversible processes. II., Phys. Rev. 37 (1931b) 2265–2279.
- Kleinhans [1998] F. W. Kleinhans, Membrane permeability modeling: Kedem-Katchalsky vs a two-parameter formalism, Cryobiology 37 (1998) 271–289.
- Mazur et al. [1974] P. Mazur, S. P. Leibo, R. H. Miller, Permeability of the bovine red cell to glycerol in hyperosmotic solutions at various temperatures, J. Membr. Biol. 15 (1974) 107–136.
- Mazur and Miller [1976] P. Mazur, R. H. Miller, Permeability of human erythrocyte to glycerol in 1 and 2 M solutions at 0 or C, Cryobiology 13 (1976) 507–522.
- Koslov and Markin [1984] M. M. Koslov, V. S. Markin, A theory of osmotic lysis of lipid vesicles, J. Theor. Biol. 109 (1984) 17–39.
- Popescu and Popescu [2008] D. Popescu, A. G. Popescu, The working of a pulsatory liposome, J. Theor. Biol. 254 (2008) 515–519.
- Zade-Oppen [1998] A. M. M. Zade-Oppen, Repetitive cell ‘jumps’ during hypotonic lysis of erythrocytes observed with a simple flow chamber, J. Microsc. 192 (1998) 54–62.
- Sandre et al. [1999] O. Sandre, L. Moreaux, F. Brochard-Wyart, Dynamics of transient pores in stretched vesicles, Proc. Natl. Acad. Sci. USA 96 (1999) 10591–10596.
- Mally et al. [2002] M. Mally, J. Majhenc, S. Svetina, B. Žekš, Mechanisms of equinatoxin II-induced transport through the membrane of a giant phospholipid vesicle, Biophys. J. 83 (2002) 944–953.
- Karatekin et al. [2003] E. Karatekin, O. Sandre, H. Guitouni, N. Borghi, P.-H. Puech, F. Brochard-Wyart, Cascades of transient pores in giant vesicles: Line tension and transport, Biophys. J. 84 (2003) 1734–1749.
- Mally et al. [2007] M. Mally, J. Majhenc, S. Svetina, B. Žekš, The response of giant phospholipid vesicles to pore-forming peptide melittin, Biochim. Biophys. Acta 1768 (2007) 1179–1189.
- Haleva and Diamant [2008] E. Haleva, H. Diamant, Critical swelling of particle-encapsulating vesicles, Phys. Rev. Lett. 101 (2008) 078104. 4 pages.
- Diamant [2011] H. Diamant, Model-free thermodynamics of fluid vesicles, Phys. Rev. E 84 (2011) 061123.
- Rawicz et al. [2000] W. Rawicz, K. C. Olbrich, T. McIntosh, D. Needham, E. Evans, Effect of chain length and unsaturation on elasticity of lipid bilayers, Biophys. J. 79 (2000) 328–339.
- Krasteva et al. [2001] N. Krasteva, D. Vollhardt, G. Brezesinski, H. Möhwald, Effect of sugars and dimethyl sulfoxide on the structure and phase behaviour of DPPC monolayers, Langmuir 17 (2001) 1209–1214.
- Pocivavsek et al. [2011] L. Pocivavsek, K. Gavrilov, K. D. Cao, E. Y. Chi, D. Li, B. Lin, M. Meron, J. Majewski, K. Y. C. Lee, Glycerol-induced membrane stiffening: the role of viscous fluid adlayers, Biophys. J. 101 (2011) 118–127.
- Pavlič et al. [2011] J. I. Pavlič, J. Genova, G. Popkirov, V. Kralj-Iglič, A. Iglič, M. D. Mitov, Mechanoformation of neutral giant phospholipid vesicles in high ionic strength solution, Chem. Phys. Lipids 164 (2011) 727–731.