Evolution of the baryon fraction in the Local Group:
accretion versus feedback at low and high z
Abstract
Using hydrodynamical zoom simulations in the standard CDM cosmology, we
investigate the evolution of the distribution of baryons (gas and stars) in a
local group-type universe.
First, with standard star formation and supernova feedback
prescriptions, we find that
the mean baryonic fraction value estimated at the virial radius
of the two main central objects (i.e. the Milky Way and Andromeda) is decreasing over
time, and is 10-15% lower than the universal value, 0.166, at .
This decrease is mainly due to
the fact that the amount of accretion of dissipative gas onto the halo,
especially at low redshift, is in general much lower than that of the dissipationless dark matter.
Indeed,
a significant part of the baryons does not collapse onto the haloes and remains in their outskirts, mainly in the form
of warm-hot intergalactic medium (WHIM).
Moreover, during the formation of each object, some dark matter and baryons are also expelled
through merger events via tidal disruption.
In contrast to baryons, expelled dark matter can be more efficiently
re-accreted onto the halo, enhancing both the reduction of inside ,
and the increase of the
mass of WHIM outside .
Varying the efficiency of supernovae feedback at low redshift does not seem to significantly affect these trends.
Alternatively, when a significant fraction of the initial gas in the main objects
is released at high redshifts by more powerful sources of feedback,
such as AGN from intermediate mass black holes in lower mass galaxies,
the baryonic fraction at the virial radius can have a lower value () at low redshift.
Hence physical mechanisms able to drive the gas out of the virial radius at high redshifts will
have a stronger impact on the deficit of baryons in the mass budget
of Milky Way type-galaxies at present times
than those that expel the gas in the longer, late phases of galaxy formation.
keywords:
Galaxies: Local Group – Galaxies: haloes – Dark matter – Methods: N-body simulations1 Introduction
The distribution of galaxies in the Universe on large scales, as revealed by sky surveys such as the CFA Redshift Survey (Geller & Huchra 1989), the 2DF Galaxy Redshift Survey (Colless et al. 2001) or the Sloan Digital Sky Survey (Gott et al. 2005) is structured into a filamentary web in which the intersections correspond to the most massive objects (i.e. galaxy clusters, Bond et al. 1996). This specific distribution is now commonly and easily reproduced by cosmological hydrodynamical N-body simulations of the CDM cosmology which also indicate that the distribution of dark matter, the dominant mass component of the Universe (Komatsu et al. 2011), follows the same trend. Indeed, since in the traditional picture of galaxy formation, galaxies are supposed to form when baryonic gas falls into the gravitational potential of their host dark matter halo, the distribution of dark matter is therefore expected to faithfully trace that of the baryons. However on galactic scales, observations tend to suggest that the spatial distributions of dark matter and baryons (especially in the form of gas) may display some substantial differences. In particular, it has been shown that galaxies are missing most of their baryons, – most galaxies are severely baryons-depleted relative to the cosmological fraction (see for instance Bell et al. 2003; Hoekstra et al. 2005; McGaugh 2010).
This so-called “missing baryons problem” (see Bregman 2007 for a complete review), if real, calls for two alternative scenarios. Either a significant part of the gas never collapsed into the gravitational potential wells of protogalaxies in the first place, or some of the gas has been expelled by galaxy formation feedback processes such as supernova winds. Hence solving the missing baryon problem may prove to be central in order to constrain galaxy formation models.
Past studies based on hydrodynamical simulations indicate that most of the “missing” baryons might lie in a gaseous phase (the so-called warm-hot intergalactic medium, hereafter WHIM) in the temperature range and at moderate over-density (Cen & Ostriker 1999; Davé et al. 2001; Cen & Ostriker 2006). According to these studies, the WHIM is primarily shock-heated during the formation of large-scale structures, while feedback mechanisms associated with star formation should also have an additional impact on this phase during galaxy formation. For instance, for low mass systems, the cosmological UV-background is supposed to reduce both the star formation and baryon content (Thoul & Weinberg 1996; Bullock, Kravtsov & Weinberg 2000; Gnedin 2000; Somerville 2002; Ricotti, Gnedin & Shull 2002; Benson et al. 2002; Read, Pontzen & Viel 2006; Hoeft et al. 2006; Okamoto, Gao & Theuns 2008; Peirani 2010; Nickerson et al. 2011, Hambrick et al. 2011a). Supernova feedback is also expected to expel some gas, especially for low mass systems, as suggested by various numerical investigations (Scannapieco et al. 2008, 2009; Faucher-Giguère, Kereš & Ma 2011 and references therein). Other mechanisms have been proposed, such as turbulence in the baryonic intergalactic medium (Zhu, Feng & Fang 2011) or pre-heating by pre-virialisation (Mo et al. 2005), although Crain et al. (2007) claimed that this process is unable to prevent the collapse of gas (instead, according to these authors, non-gravitational feedback is required in order to reduce the efficiency of gas cooling and star formation in dwarf galaxies). Another less investigated potential mechanism, which may also affect the evolution of the distribution of baryons on small scales, is the effect of accretion and merger events (and in particular their associated tidal disruption) that are expected to be frequent in the framework of the hierarchical model. For instance, in an early paper, Navarro & White (1993) have shown that during a merger involving dark matter and adiabatic gas, there is a transfer of energy between these two components that leads to a situation where the gas is less tightly bound. More recently, Sinha & Holley-Bockelmann (2010, 2011) found that a few percent of gas can be driven into the intergalactic medium (IGM) by galaxy mergers, using either merger trees calculated from the Press-Schechter formalism or idealized simulations of mergers of galaxy clusters. Using hydrodynamical simulations, Nickerson et al. (2011) have also concluded that tidal forces may cause significant mass loss from satellites of all masses.
In the present work, we make use of cosmological “zoom” simulations with an extended treatment of the physics of baryons to study the formation of Milky Way-like galaxies. Our aim is to characterise the relative role of supernova feedback to accretion and mergers in the evolution of the distribution of baryons for objects of such masses. We will also test scenarios in which a significant fraction of gas in progenitors is expelled at high redshift by more powerful sources of feedback, such as AGN associated with massive black holes. This will allow us to quantify two distinct processes which may allow us to address the so-called missing baryon problem, should it persist.
This paper is organised as follows. In section 2, we summarize the numerical modelling, and section 3 presents our main results on the evolution of the distribution of baryons in our simulated local group universes. We give our main conclusions in the last section.
2 Numerical modelling
2.1 Initial conditions and simulation
The numerical methodology used in the present paper is described in detail in Peirani (2010) to which we refer the reader for more information. For the sake of clarity, we summarize the main steps below.
We analyse three cosmological zoom simulations for a CDM universe using WMAP5 parameters (Komatsu et al. 2009), namely , , , km/s/Mpc, and . Each simulation was performed in a periodic box of side Mpc with effective dark matter and gas particles in the highest resolution region (a sphere of Mpc of radius). In this region of interest, the mass resolution are and . The Plummer-equivalent force softening adopted for the high mass resolution particles were 1 and 0.5 kpc for dark matter and gas particles respectively and were kept constant in comoving units.
Initial conditions have been generated from the MPgrafic code (Prunet et al. 2008) and the simulations were performed using GADGET2 (Springel 2005), with added prescriptions for metal-dependent cooling, star formation (in this work we remind that the star formation efficiency is =0.02), feedback from Type Ia and II supernovae (SN), UV background (starting at ) and metal enrichment. The three simulations have common initial conditions whose phases are consistent with the local group but essentially differ in the quantity of energy released by SN derived from star particles (). As mentioned in Peirani (2010), we consider that a fraction of this energy is deposited in the neighbour gas particle by applying a radial kick to its velocity with a magnitude , where is the weighting based on the smoothing kernel and is the mass of gas particle . The first simulation uses the standard value of while in the second one, , we have considered a higher efficiency in order to investigate how our results would be affected. In the third simulation (), our aim is to study the effects of earlier high energy ejection to the ISM induced either by intermediate mass black holes or other high energy processes such as hypernovae events. Intermediate mass black holes are the likely missing link between Population III and the supermassive black holes in quasars and plausibly as part of the hierarchy of structure formation. Hypernovae are likely to be more prevalent than normal supernovae in the earliest phases of star formation: for example, the Population III IMF is most likely top-heavy, and this may also be the norm for the precursors of spheroids, as evidenced for example by the radial distribution of SNe in disturbed (including recently merged) galaxies (Habergham, Anderson & James 2010) and the frequency of low mass x-ray binaries in ultracompact dwarf galaxies (Dabringhausen et al. 2012). A higher frequency of hypernovae could plausibly provide an order-of-magnitude higher feedback efficiency than supernovae. The case of AGN is intriguing, as even higher feedback is required in deep potential wells, where supernovae are relatively inefficient, in order to account for the correlation between black hole mass and spheroid velocity dispersion (Silk & Nusser 2010; Debuhr et al. 2012). Moreover, the recent detection of a massive gas outflow in a distant quasar () strongly suggests that a strong quasar activity is already in place at very early times (Maiolino et al. 2012). For this purpose, a simple modelling was used in which a much higher efficiency () was considered during a very short ( Myr) at earlier times () and otherwise. We also justify the choice of this high efficiency by simple energetics and momentum comparisons between supernovae and AGN. For instance, for a M⊙ black hole along with its M⊙ in stars, the number of type II SNe produced in star formation phase ( M⊙ per SN for a Chabrier IMF) is . Thus, the total SNe energy injected is ergs over a dynamical time, say yr, or ergs/s. Since the Eddington luminosity is ergs/s energetics favour AGN. Furthermore, for supernovae momentum conservation starts at shell velocity km/s. Since the ejection velocity is km/s, the momentum injected is of initial momentum namely gm cm/s or dynes. For AGN, momentum injected is or dynes. Thus AGN injects 100 times more momentum flux than supernovae. Finally, there is another factor of 10-100 that favours AGN, the so-called mechanical advantage factor due to ram pressure on the expanding bubble as suggested by recent hydrodynamical simulations (Wagner, Bicknell & Umemura). Therefore the value of seems to be reasonable in order to account for the accumulation of the different potential sources of feedback at high redshifts.
The feedback parameters are summarized in Table 1.
| 0.1 | 1.0 | 50 () 0.1 elsewhere |
2.2 Physical properties of main galaxies
In each simulation, we analyse a pair of galaxies with physical characteristics similar to the Milky Way-Andromeda pair (MW-M31) and with similar galaxy environments up to Mpc. Some relevant physical properties at the virial radius at of these two objects from each simulation are summarized in Table 2. Note that we keep the same definition of the virial radius and virial mass used in Peirani (2010) (see paragraph 2.3), namely is the radius where the enclosed mean density is times the critical density, and , where . In the cosmology adopted in the present study, at . Furthermore, the baryonic fraction is defined as follow:
| (1) |
where and refer to the masses of baryons (gas+stars) and dark matter respectively in the same specific region of the universe. When not specified in the text, we do not distinguish the cold and hot phases of the gas in the estimate of . According to the adopted cosmology, the universal value is:
| (2) |
| () | () | () | () | ||||
| 7.58 | 7.58 | 7.23 | 7.43 | 7.40 | 8.17 | ||
| 0.30 | 0.44 | 0.27 | 0.38 | 0.44 | 0.45 | ||
| 1.08 | 0.93 | 0.71 | 0.84 | 0.78 | 0.68 | ||
| 8.96 | 8.95 | 8.21 | 8.65 | 8.62 | 9.30 | ||
| 0.282 | 0.282 | 0.274 | 0.279 | 0.279 | 0.286 | ||
| 0.154 | 0.153 | 0.119 | 0.141 | 0.141 | 0.121 |
The time evolution of the virial, dark matter (DM), gas and stellar masses of each object at the virial radius and for the three simulations is shown in Figure 1. First, we notice that there is no particular difference between the evolution of dark matter halo masses (and hence viral masses) between and . However, the baryonic compositions are quite different. Indeed, stellar masses are significantly reduced in due to higher amounts of energy released by the SN. The mass of the gas component is therefore higher in , as expected. For , the stellar masses are even more reduced. This is mainly due to the fact that a significant fraction of the gas has been expelled at high redshifts.
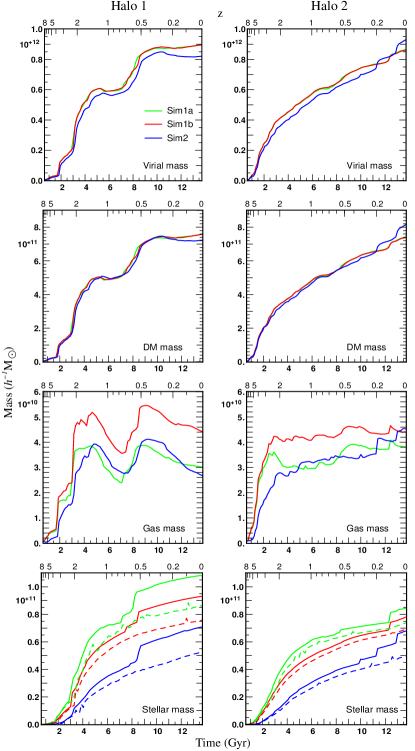
Indeed, while the DM masses are quite similar between the 3 runs, the virial masses for objects in tend to be lower at high redshift, which indicate that a fraction of gas expelled at high z does not recollapse at some later stage. Interestingly, undergoes a minor merger event at , which corresponds for instance to a sudden variation in the evolution of its stellar mass. This same accretion event takes place at in . Moreover, we can also identify clearly in another minor merger event at that has not occurred (yet?) in and . This explains why the dark matter mass (and therefore the virial mass) of is higher in than or . This also suggests that small perturbations in the properties of haloes at earlier times can have some significant impact on the whole accretion history (see for instance, Thiebaut et al. 2008). It is also worth mentioning that although the two main central objects have the same virial mass at , they have undergone different mass accretion histories. Indeed, while grows regularly through smooth mass accretion, the evolution of the mass of is more sporadic thanks to several major merger events. It is therefore instructive to see to which extent these two different mass evolutions could affect the evolution of the distribution of baryons in the vicinity of these two objects.
It is also worth studying how the stellar masses found in the different simulations are related to the mass of their host dark matter haloes. From Table 2, the mass of dark matter haloes varies from to while according to observational and numerical analysis, the expected stellar mass range inside those haloes is (Guo et al. 2010; Moster et al. 2010; Brook et al. 2012b). In order to make a suitable comparison, instead of considering the stellar mass inside the virial radius , we define the galaxy radius as and all stars inside this radius contribute to the galaxy stellar mass . By doing this, we only select stars which belong to the central main galaxy while excluding stars of accreted satellites inside . In Figure 1, the evolution of each stellar mass inside is shown in dashed line. One can see that at , galaxy stellar mass ranges are , and for , and respectively. Thus, each simulation tends to produce too many stars in the central region of haloes and the trend is more severe in and relative to . This problem was already pointed out from other hydrodynamical simulations which indicate that low feedbacks may result in more than an order-of-magnitude too many stars (see for instance Piontek & Steinmetz 2011; Brook et al. 2012b). As a first conclusion, stronger and earlier feedbacks seem to be required in order to improve the stellar mass-halo mass relation (also recently suggested by Stinson et al. 2012) and, in the present study, one probably also needs the action of additional sources of feedback in the late phase of galaxy formation such as AGN to get even closer to the expected galaxy stellar masses. Moreover the fact that our model leads to too high central stellar masses suggests that the effect of all different sources of feedback has been underestimated. Thus in the following, baryonic fraction values found in our simulations may be slightly overestimated.
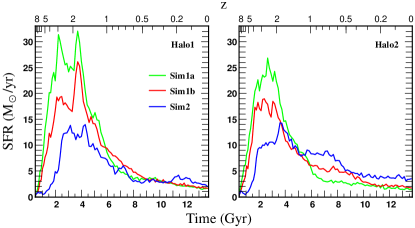
Finally, Figure 2 shows the evolution of the star formation rate (SFR) for each object and simulation. At , SFR values are around yr which is consistent with observational values derived by Robitaille & Whitney (2010) using Spitzer data. Note that these cosmic evolutions are similar for the two haloes: at high redshifts () the lower the SN efficiency the higher the stellar mass. And the higher the mass of formed stars at high redshift, the higher the subsequent SN feedback. This explains why, at low redshifts, a higher fraction of stars is produced in relative to and .
3 The baryon fraction in the LG
3.1 Spatial distribution in the simulated LG
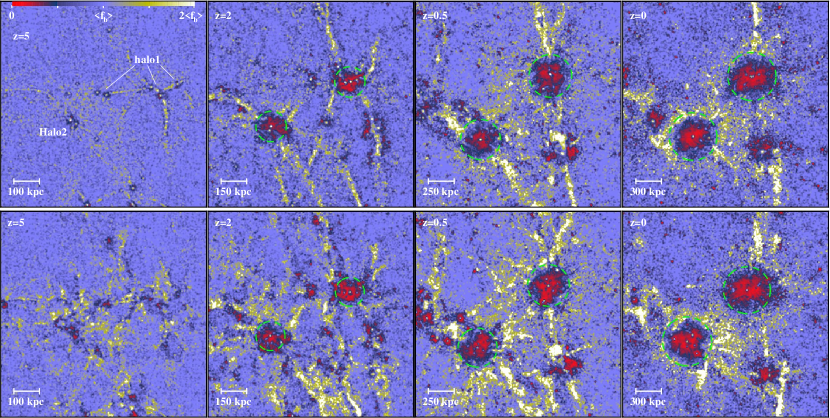
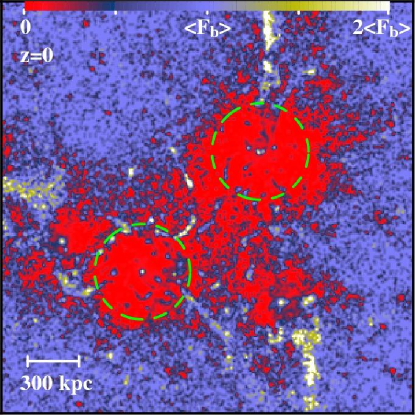
Fig. 3 shows the projected distribution of baryons in our LG type universes derived from and and at four specific epochs (i.e. and ). We clearly see that the evolution of the distributions of baryons and dark matter do not follow the same trend. Indeed, the regions of the universe in red and dark blue correspond to regions where the baryonic fraction is lower than the universal value. And those specific regions are mainly located around the forming protogalaxies or galaxies at each redshift, while in the very inner part of dark matter haloes, is higher. This is an expected result: due to cooling, the gas collapses to the center of haloes where stars can be formed. However, note that the size of these “red” cavities increases over time which suggests that the fraction of gas that has collapsed to the center of the halo is not immediately replaced by some fresh gas from its vicinity.
Note also, at high and low redshift, the existence of relative high baryon content regions which are located either in the filaments or beyond the virial radii. Such anisotropic distribution seems to be more pronounced in relative to . If the high baryon fractions in filaments can be understood by the dissipative nature of gas, allowing it to cool to the dense filaments, it is crucial to characterise the mechanisms that drive high baryon content regions beyond the virial radii.
3.2 Cosmic evolution of
3.2.1 The effects of feedback at low redshift
Let us first only consider the role of supernovae feedback in the evolution of the mass budget of Milky Way-type galaxies. We therefore focus on both and in this sub-section.
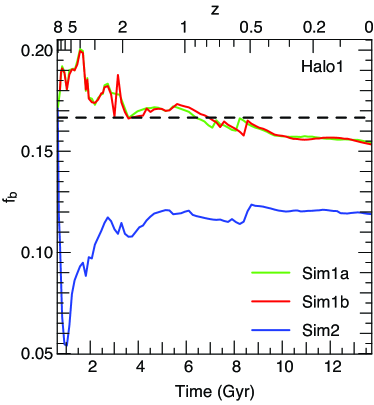
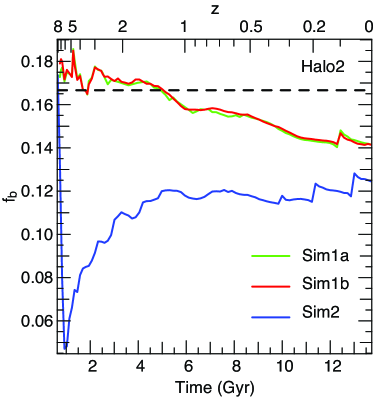
The cosmic evolution of the baryonic fraction estimated at the virial radius for the two main haloes is shown in Figure 4. In each of these two simulations, they follow the same trend. At high redshift, is close to the universal value and sometimes is slightly higher. Cold flows provides gas to form stars. Note that the virial radius is estimated according to the local density, which is dominated by the newly formed stars. Since the resolution in these simulations is limited, especially for low mass systems, the virial radius may be underestimated, and subsequently this baryonic fraction may be in fact overestimated at high redshifts.
From , is decreasing with cosmic time until it reaches the values of and at for and respectively. These latter values are quite close to the universal value which is not surprising since similar trends have been already found from other hydrodynamical simulations using weak or no supernovae feedback, for objects with a mass of at (Crain et al. 2007; Faucher-Giguère, Kereš & Ma 2011). More interestingly, no particular differences are seen in the evolution of between and . This suggests that higher SN feedback can reduce the star formation rate (and therefore the final stellar mass) but is rather inefficient in expelling the gas outside the virial radius at high and low redshifts for massive galaxies. This results are in agreement with Stinson et al. (2011) who show that increased feedback in haloes of such mass scale affects the star formation more than baryon content in the circumgalactic medium (CGM). Moreover, they show that higher feedback models can account for sufficient OVI and HI gas in the CGM compatible with the observed distributions. Therefore, in the present scenario, the relatively small differences in the baryon fraction between and could make supernovae feedback prescriptions difficult to distinguish and one probably needs to focus on stellar mass and/or properties of the intergalactic medium in order to have better constraints (see also Davé, Oppenheimer & Sivanandam 2008; Shen, Wadsley & Stinson 2010; Stinson et al. 2011,2012; Scannapieco et al. 2012; Brook et al. 2012b). In particular, it seems that higher feedback of compared to may be necessary in reproducing values closer to the correct stellar masses and properties of intergalactic medium as we will see in section 3.3.
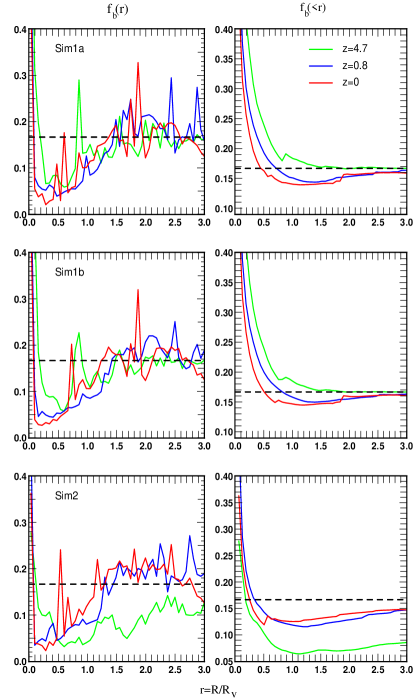
We have also studied the distribution of the integral and differential as respect to the radius at three different redshifts , and in Figure 5. Only results from are shown since similar trends are obtained for . At the center of each halo, is high due to the presence of the galaxy. At larger radii, , tends towards the universal value as expected. Interestingly, for high redshifts (), converges to the universal value from above, while this is not the case at lower redshifts, which suggest, as mentioned above, that the gas infall is not recurrently replaced by some fresh gas from the outskirt of the haloes. Also, an excess of baryons at can be clearly seen in the variations of the differential for different cosmic times, which correspond to regions in yellow in Fig. 3 around haloes. Similar plots were recently derived from observations using Chandra and Suzaku facilities for an isolated elliptical galaxy with a Milky way mass (Humphrey et al. 2011) and a fossil group (Humphrey et al. 2012).
3.2.2 The effects of feedback at high redshift
In however, due to earlier and important eviction of gas from other potential sources of feedback (AGN, hypernovae,…) reaches its lowest value at , then increases until and becomes nearly constant () until the present time. This strongly suggests that sources of feedback acting at high redshift, even for a very short period, can have a stronger impact on the final mass budget of massive galaxies than those acting in the later and longer phases of galaxy formation. One can also notice from Figure 2 that the gas outflow taking place at high redshift lead to the quenching of the star formation during a few million years (). This is in nice agreement with conclusions of Valiante, Schneider & Maiolino (2012) using semi-analytical models of the formation and evolution of high-redshift quasars. Indeed, according to their model, the observed outflow of a distant quasar at is dominated by quasar feedback which “has considerably depleted the gas content of the host galaxy, leading to a down-turn in the star formation rate at ”. Nevertheless, future observational proofs of star formation quenching at these redshifts are required in order to confirm such statements.
3.2.3 The role of accretion of matter
The time evolution of the baryonic fraction inside the virial radius depends on the competition between the evolution of the mass that arrives within , and the mass that leaves . It raises the following question: are the low values of found at due to the fact that more baryons have been expelled out of the virial radius or because more dark matter has been accreted inside ? To answer this question, instead of studying the evolution of the mass that enter or leave the virial radius at each subsequent step, we focused on the location at a given redshift of all particles that have been accreted up to this specific redshift. To do this, we have first identified all the particles that have been accreted at each snapshot of the simulation from to “”. Then, we have computed the fraction of those particles that are inside or outside at the considered redshift. By doing this, the interpretation of our findings will be easier since each accreted particle contributes only once in the final result. Indeed, certain particles can be accreted, ejected and accreted again during the whole evolution of these haloes.
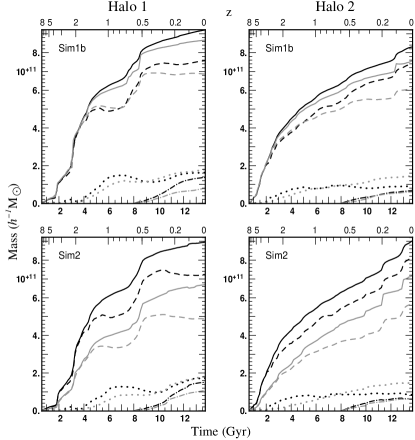
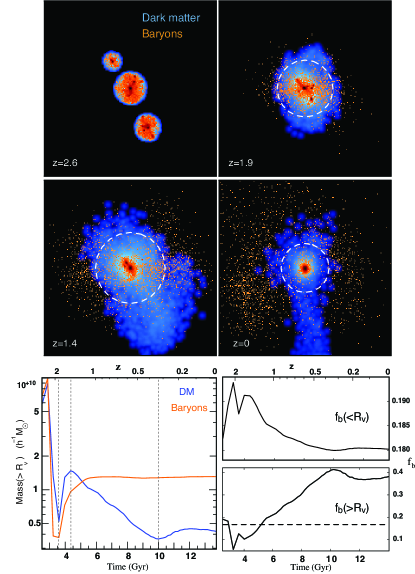
Figure 6 shows the evolution of the total accreted DM and baryon mass from to a given redshift, , for both haloes, and for both and (results derived from are not shown since they are similar to those from ). We also plot the fraction of these accreted particles that are located inside or outside at this given redshift . First, we look at the evolution relative to . One can see that a higher fraction of dark matter mass has been accreted from to relative to the baryon component (solid lines). Moreover, a similar fraction of dark matter and baryons are located outside the virial radius at . That means that the fraction of baryons released during the formation of is not higher than that of dark matter, which demonstrate that the low value of at follows from the fact that more dark matter particles has been accreted over cosmic time. This can be understood given the difference in nature between the dissipative gas and the non-dissipative dark matter. In particular, the gas component can be shock-heated at the virial radius which considerably affects and slows down its further accretion on to the halo as already shown in hydrodynamical simulations using no feedback (see for instance Oñorbe et al. 2007). In contrast, especially after an important episode of accretion or merger event, the dark matter component can “damp out” its orbital motion until it completely relaxes. For the same trends are observed but the mass of baryons outside the virial radius turns out to be higher that that of dark matter. However this does not necessarily mean that a higher fraction of baryons has been expelled through physical mechanisms such as feedback or merger events. Indeed, if we represent the fraction of baryons and DM released from to (see Figure 6), one can see that same amounts of mass have been expelled at by the two components. It implies in fact that a significant fraction of dark matter which has been expelled between and has been re-accreted between and . This is not the case for baryons which are generally heated through the expelling process and therefore remain outside the virial radius afterwards. In order to illustrate this, Figure 7 presents the evolution of the distribution of baryons and dark matter for Halo1. From , the main progenitor undergoes two mergers with mass ratios of 1:1.8 and 1:5. Here, we have selected all particles inside the virial radius of each of the 3 objects. Note that the orbits of the two mergers are quite radial. After the two merger events, the spatial distributions of baryons and dark matter are quite different. Most of the dark matter particles are located inside the virial radius, though a small part has been expelled in the same orbital direction. The baryons tends to either collapse toward the center or are expelled all around. This phenomenon is observed at where a non-negligible part of baryons have been expelled and remain outside the virial radius. Figure 7 also shows the evolution of the mass of DM and baryons located outside the virial radius. In the case of the dark matter component, there are 3 distinct phases. First, from the beginning of the experiment until Gyr, both satellites are accreted inside . Then in the second phase (from to Gyr) some of the dark matter is expelled via tidal disruption. Finally from Gyr some of the dark matter particles are re-accreted. Note that evolution from Gyr is probably due to the effect of another merger event. However, the baryon component follows the two first phases but not the third one: once baryons are expelled, most of them remain outside the virial radius. In this specific example, we found that 2.1% and 5.8% of dark matter and baryon masses respectively are released at from the three main objects. This is in good agreement with results obtained from idealized simulations (Sinha & Holley-Bockelmann 2009). It is also interesting to see that due to mergers, unbound gas diffuses far away from the galaxy; thus mergers represent a potential mechanism for enriching the IGM with metals. Note that this enrichment must occur early, as in our model, to avoid disruption of the cold and weakly enriched Lyman alpha forest. It is also worth mentioning that during a merger event, gas can be expelled via both tidal disruption and outflows from feedback due to the merger driven starburst. However, since there is no significant difference in the evolution of within the virial radius between and , this suggests that supernovae feedbacks have a lower contribution relative to tidal disruption for Milky Way mass galaxies. As observed in the evolution of the dark matter component, tidal disruption should guarantee escape whereas a starburst driven outflow is much more problematic (see for instance Powell, Slyz and Devriendt 2011).
Finally, it is interesting to point out that undergoes major merger events between and , leading to important mass outflows from and . In particular, Figure 6 indicates that more dark matter particles are released than baryons after the merger events. Most of this dark matter is not yet re-accreted, which explains why tends to have values of higher than at . This also explains why in Figure 3 the high value regions around seem to be less pronounced in comparison to those around .
Thus, the evolution of the mean baryonic fraction value at the virial radius is essentially governed by the relative efficiency at which the dark matter and baryons are accreted. Indeed, the evolution of the accreted mass of both dark matter and baryons follows two different regimes: a rapid growth at high redshifts () and a slower one at lower redshifts. These evolutions are directly related to the total mass evolutions in Figure 6 which also presents these two regimes. This behaviour compares well to the evolution of individual dark matter haloes (see for instance Wechsler et al. 2002; Vitvitska et al. 2002, Peirani, Mohayaee & Pacheco 2004, McBride et al. 2009 and Tillson, Miller & Devriendt 2011), indicating a fast growth of the mass for , followed by a phase where the accretion rate is slower. Hydrodynamical simulations have also suggested that galaxy formation presents two phases: a rapid early phase () during which stars mainly form within the galaxy from infalling cold gas (Katz et al. 2003; Kereš et al. 2005; Ocvirk, Pichon & Teyssier 2008; Dekel et al. 2009) and a second one () during which stars are accreted (Oser et al. 2010; Hirschmann et al. 2012). This latter phase is dominated by the accretion of diffuse matter and small satellites (Fakhouri & Ma 2010; Genel et al. 2010; Wang et al. 2011; van de Voort et al. 2011). Hence the high values at high redshift derived from and can be explained by the accretion of high gas-to-dark matter ratio from dense region such as filament via cold flows. But at lower redshift, is decreasing due to the accretion of low gas-to-dark matter ratio material, in particular from the diffuse region. Indeed, we found that the baryonic fraction of the diffuse accreted matter (namely ) is on the average much lower than the universal value: as the haloes become more massive, the temperature at the virial radius increases and the gas is shock-heated and this process slows down its accretion onto the halo. For , reaches its lowest value () at right after some significant expulsion of gas. After that, there is a short phase where increases because the accreted matter has a higher baryonic content (but not necessarily higher than the universal value). Then, in the late phase of evolution of each halo, tends to be constant () because the average accreted matter tends to have the same baryonic fraction value as the mean value inside virial radii.
3.3 Properties of the IGM
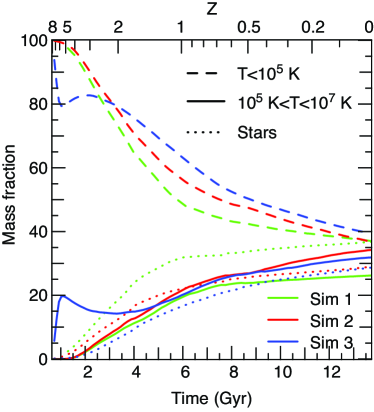
The WHIM has proven to be difficult to detect and represents a serious candidate for the missing baryons. It is therefore instructive to estimate the fraction of the WHIM in our simulated local universes. For this purpose, we have divided the Inter-Galactic Medium (IGM) into four components: (1) stars, (2) cold gas (), (3) WHIM () and hot gas (). Figure 8 shows the time evolution of three baryon components (stars, cold gas and WHIM) within a sphere centred on the local Universe-type haloes and of comoving radius 1.5 Mpc/h. The evolution of the hot gas ( K) is not shown in Figure 8 since this component represents less than of the total baryon mass budget in our selected region, as expected since we are not in a cluster environment. It shows that the WHIM represents % of the baryon budget at , in good agreement with past work based on hydrodynamical simulations (Cen & Ostriker 1999; Davé et al. 2001; Cen & Ostriker 2006; Rasera & Teyssier 2006; Tornatore et al. 2010) when AGN feedback is not taken into account. We also found that the warm and hot gas becomes the dominant baryonic component at large radii ( kpc) from each main halo, in good agreement with previous observational analysis of massive galaxies (Humphrey et al. 2011, 2012) or with previous numerical simulations (van de Voort et al. 2011; van de Voort & Schaye 2012). However, when the contribution of the WHIM is not taken into account in the estimation of the baryonic fraction at the virial radius, namely when only the cold gas ( K) and stars are considered, values obtained at only decrease by %. This follows from the fact that stellar masses obtained in our experiments have a large contribution in the final values and thus we probably need the additional effect of AGN feedback to regulate the SFR and also increase the mass of WHIM inside the virial radius. Nevertheless, the distribution of baryonic fraction seen in Figure 3 is significantly affected when the WHIM is not taken into account. Indeed, Figure 9 shows that in this latter case, the baryonic fraction is lower than in the direct vicinity of the virial radius.
Outside the virial radii, our analysis in the previous section has suggested that the IGM is composed of gas that either never collapses onto haloes or is released by mechanisms such as feedback or merger events. But what are the relative proportions? From Figure 6 we can estimate that of the total accreted baryons is expelled from to for and , which is quite significant. These results are also in good agreement with Sinha & Holley-Bockelmann (2010) who found from semi-analytic techniques that up to 25% of gas can be unbind over the course of galaxy assembly. From our analysis, we found that the gas that has been released after being accreted on to haloes is mainly located between and at . If we focus on which is quite isolated, we found that the gas component between and consists of 55.9%, 58.6% and 60.5% of gas that has been expelled from from , and respectively. In other words 40% of this gas has never collapsed onto . It is also worth mentioning that of the gas that has been released through merger events or feedback is in the form of WHIM at but only 65% in the case the gas that has never collapsed into the halo. Hence, the gas that has been ejected through different mechanisms during the galaxy formation and evolution significantly increases the mass of the WHIM.
4 Discussion and Conclusions
In this paper, we have analysed hydrodynamical simulations with an extensive treatment of the physics of baryons in order to study the evolution of the distribution of baryons in a local group-type object. In particular, we have investigated the impact of i) supernova feedback, ii) more powerful sources of feedback at high redshift such as AGN from intermediate mass black holes or hypernovae and iii) accretion/ejection and merger events in the evolution of the mass content of Milky-Way type galaxies.
First, when no high early feedback is considered as is the case in and , we found that the evolution of the mean baryonic fraction value estimated at the virial radius of the two main central objects is essentially governed by the relative efficiency at which dark matter and baryons are accreted. Indeed, in the first and early phase of galaxy formation (the cold mode of accretion ) during which stars mainly form within the galaxy from infalling cold gas (Katz et al. 2003; Kereš et al. 2005; Ocvirk, Pichon & Teyssier 2008; Dekel et al. 2009) is in general higher than the universal value. But in the second phase (the hot mode of accretion), dominated by the accretion of diffuse matter or small satellites, tends to decrease and is 10-15% lower than the universal value, 0.166, at . This decrease is not due to the fact that more baryons (relative to DM) are expelled beyond the virial radius by physical mechanisms such as feedback or merger events. Rather this essentially follows from the relative nature of dissipative gas and non-dissipative dark matter. Specifically, the gas component can be shock-heated at the virial radius, which considerably slows down its further accretion into the halo (see for instance Oñorbe et al. 2007). However, shock-heating will presumably not be a large factor in low mass galaxies, but as mentioned in the introduction, feedbacks such as UV-background and supernovae winds are supposed to play a major role in the effective reduction of the baryon content of these galaxies. Additionally, we found that accretion and particularly merger events can release a fraction of both dark matter and baryons. But again, dark matter that has been expelled can be re-accreted more efficiently than the corresponding baryons, hereby enhancing the decrease of inside the virial radius. Consequently, our simulations suggest that the gas located beyond the virial radius is mainly in the form of WHIM that comes from either gas that never collapsed prior to the formation of the proto-galaxy () or gas expelled by feedback and merger processes ().
Our comparison of Sim1a and Sim1b also suggest that globally increasing somewhat the efficiency of supernovae does not significantly affect the evolution of inside the virial radius. In other words, standard SN feedback is not powerful enough to expel the baryons out of the gravitational potential of dark matter haloes of such mass scales. This also means that, if future observations indicate that inside the virial radius of Milky Way mass galaxy at is relatively close to the universal value, then in order to make clear a distinction between the different feedback models, the stellar mass and the properties of the intergalactic medium may provide better constraints than baryon fractions, as suggested by recent numerical works (Davé, Oppenheimer & Sivanandam 2008; Shen, Wadsley & Stinson 2010; Stinson et al. 2011,2012; Scannapieco et al. 2012; Brook et al. 2012b). But at high redshift the situation is quite different since haloes are less massive and thus feedback mechanisms have a more effective contribution. Indeed for our other scenario (for which a higher fraction of gas is expelled at high redshift () by more powerful source of feedback such as AGN from intermediate mass black holes or hypernovae implemented in Sim2) the accretion of gas is strongly affected at high redshift, and drives the mean baryonic value inside the virial radius to a lower values at . This is one important conclusion of this paper: to get a low value of at present time, physical mechanisms able to expel the gas at high redshift will have a stronger impact on the deficit of baryons in the mass budget of Milky Way type-galaxy today than those that expel the gas in the longer, late phases of galaxy formation. Thus, if future observations favour a relatively low value of at , then this “high redshift feedback” scenario is the most probable.
However, it this worth mentioning that the effective contribution of non-gravitational heating such as galactic winds from supernovae in the evolution of within the virial radius of Milky Way type galaxy is still a controversial and a debated topic in the recent literature. From our modelling and experiments, we found that increasing the efficiency of supernova feedback leads to the reduction of the stellar mass but has no particular impact on the evolution of for system of such mass scales (cf Powell, Slyz & Devriendt 2011). Such statements were also advocated by Anderson & Bregman (2010) from observational constraints on the density of hot gas around the Milky Way. Moreover, using cosmological simulations, Faucher-Giguère, Kereš & Ma (2011) have investigated the net baryonic accretion rates through . Although the net baryonic accretion rate is sensitive to galactic outflows, especially for low mass systems, the baryon mass fractions at for objects with a mass higher than and for different SN feedback prescriptions have similar values to those derived in the present study. However, other hydrodynamical simulations from Scannapieco et al. (2008, 2009) using higher SFR efficiency () found that at , the baryon fractions inside the virial radius are within the virial radius “indicating that a significant amount of baryons has been lost through winds”.
AGN feedback is supposed to play an important role in the formation of massive objects such as giant ellipticals in galaxy groups (Tabor & Binney 1993; Ciotti & Ostriker 1997; Silk & Rees 1998). From previous numerical studies, the inclusion of AGN is expected to reduce the stellar mass (see for instance Sijacki et al. 2007; Dubois et al. 2010, 2012; Hambrick et al. 2011b) and also increase the mass of WHIM (Cen & Ostriker 2005; Tornatore et al. 2010; Durier & Pacheco 2011; Roncarelli et al. 2012). Our study does not include the effect of AGN feedback at low redshift, but we think that such sporadic events will not have a major contribution in the baryonic fraction value inside the virial radius at present time. Indeed, from observationally motivated constraints, AGN and SN at low to moderate redshift seem not to produce the expected correlations with the baryonic Tully-Fisher relationship (Anderson & Bregman 2010). Moreover, as mentioned above, observations of massive objects reported by Humphrey et al. (2011, 2012) seem to suggest that AGN feedback has no particular impact on the baryonic fraction values within the virial radius. Also, recent hydrodynamical simulations show that AGN and SN feedback may mutually weaken one another’s effect by up to an order of magnitude in haloes in the mass range of (Booth & Schaye 2012). At high redshift, the effects of galactic winds on the IGM are also controversial. In the present paper, our simple minded modelling indicates that galactic winds can expel some gas outside the virial radius and affect significantly the evolution of the baryon content of massive galaxies. Similar conclusions have been recently drawn by Roncarelli et al. (2012) from hydrodynamical simulations suggesting that galactic winds acting at earlier epochs can prevent the IGM to collapse in dense structures. Also, as mentioned above, semi-analytical model from Valiante, Schneider & Maiolino (2012) indicates that the observed outflow of a distant quasar at (Maiolino et al. 2012) is expected to have considerably depleted the gas content of the host galaxy. However, simulations conducted by Di Matteo et al. (2011) or Shen et al. (2012) found that galactic outflows at high redshift may not be very effective at stopping the cold gas from penetrating the central regions.
In summary, our study indicates that in order to reach lower values at for Milky Way type galaxies, the eviction of cold gas by feedbacks during the first phase of galaxy formation at high redshifts proves to be crucial. Our study also suggests that these high redshift feedback mechanisms more efficiently reduce galaxy stellar mass in the central part of haloes and thus show better agreement to galaxy observable such as the stellar mass-halo mass relation. Moreover, efficient high redshift feedback processes seem also to be required in order to slow down the growth of galaxies at high redshift and thus to reproduce the observed number density evolution as recently pointed out by Weinmann et al. (2012). The presence of strong early feedbacks is also motivated in disk galaxy formation theory. Indeed, it has been suggested that early outflows could eject low angular momentum gas allowing disk galaxies to form (Binney, Gerhard and Silk (2001). Such hypothesis was confirmed by hydrodynamical simulations which show that outflows can indeed remove preferentially low angular momentum material which can be re-accreted latter with higher angular momentum and forms a disk (Brook et al. 2011, 2012a). If such statements are correct, numerical and observational efforts have to be focused towards characterising the respective role of each feedback process on the IGM at high redshift. In particular, are the baryons expelled from protogalaxies or do they never collapse into the gravitational potential well of these objects? In the present paper, we only focus on the first mechanism, but it is not excluded that processes such as photoionization play a major role especially at high redshifts for low mass systems. In this regard, it is interesting to compare our results with those of Guedes et al. (2011) who have studied the formation of late-type spirals from the ERIS simulation. Specifically, they claimed that the collapse of baryons is heavily suppressed at high redshift by the UV background. And it is particularly instructive to see that from their highest mass resolution simulation, the evolution of the baryonic fraction (see their Figure 6 in Guedes et al. 2011) is very similar to those we obtained from . They also found a similar value at namely . Our simulations do include UV background but our mass resolution may be too small to account for this process properly.
More detailed and well-resolved hydrodynamical simulations are required to investigate the evolution of the mass content of galaxies at high and low redshifts. But in order to achieve this goal, one must first improve the constraints of the expected energy injection to the IGM from SN, AGN, UV background (etc…) via observations.
Acknowledgements
I. J. acknowledges support from the Global Internship program by the National Research Foundation of Korea (NRF). We warmly thank the referee for an insightful review that considerably improved the quality of the original manuscript. We warmly thank D. Le Borgne, J. Devriendt, Y. Dubois, R. Gavazzi, T. Kimm, G. Mamon, J.A. de Freitas Pacheco and T. Sousbie for interesting discussions. We also thank D. Munro for freely distributing his Yorick programming language (available at http://yorick.sourceforge.net/) which was used during the course of this work. This work was carried within the framework of the Horizon project (http://www.projet-horizon.fr).
References
- [] Anderson, M. E., & Bregman, J. N. 2010, ApJ, 714, 320
- [] Bell, E. F., McIntosh, D. H., Katz, N., & Weinberg, M. D. 2003, ApJS, 149, 289
- [] Benson, A. J., Frenk, C. S., Lacey, C. G., Baugh, C. M., & Cole, S. 2002, MNRAS, 333, 177
- [] Bregman, J. N. 2007, ARA&A, 45, 221
- [] Brook, C. B., Governato, F., Roškar, R., et al. 2011, MNRAS, 415, 1051
- [] Brook, C. B., Stinson, G., Gibson, B. K., et al. 2011, MNRAS, 419, 771
- [] Brook, C. B., Stinson, G., Gibson, B. K., Wadsley, J., & Quinn, T. 2012b, MNRAS, 424, 1275
- [] Bond, J. R., Kofman, L., Pogosyan, D., 1996, Nature, 380, 603
- [] Booth, C. M., & Schaye, J. 2012, arXiv:1203.3802
- [] Bullock, J. S., Kravtsov, A. V., & Weinberg, D. H. 2000, ApJ, 539, 517
- [] Cen, R., & Ostriker, J. P. 1999, ApJ, 514, 1
- [] Cen, R., & Ostriker, J. P. 2006, ApJ, 650, 560
- [] Ciotti, L., & Ostriker, J. P. 1997, ApJL, 487, L105
- [] Colless, M., Dalton, G., Maddox, S., et al. 2001, MNRAS, 328, 1039
- [] Crain, R. A., Eke, V. R., Frenk, C. S., et al. 2007, MNRAS, 377, 41
- [] Dabringhausen, J., Kroupa, P., Pflamm-Altenburg, J., & Mieske, S. 2012, ApJ, 747, 72
- [] Davé, R., Cen, R., Ostriker, J. P., et al. 2001, ApJ, 552, 473
- [] Debuhr, J., Quataert, E., & Ma, C.-P. 2012, MNRAS, 420, 2221
- [] Davé, R., Oppenheimer, B. D., & Sivanandam, S. 2008, MNRAS, 391, 110
- [] Dekel, A., Birnboim, Y., Engel, G., et al. 2009, Nature, 457, 451
- [] Di Matteo, T., Khandai, N., DeGraf, C., et al. 2012, ApJL, 745, L29
- [] Dubois, Y., Devriendt, J., Slyz, A., & Teyssier, R. 2010, MNRAS, 409, 985
- [] Dubois, Y., Devriendt, J., Slyz, A., & Teyssier, R. 2012, MNRAS, 420, 2662
- [] Durier, F., & de Freitas Pacheco, J. A. 2011, International Journal of Modern Physics E, 20, 44
- [] Fakhouri, O., & Ma, C.-P. 2010, MNRAS, 401, 2245
- [] Faucher-Giguère, C.-A., Kereš, D., & Ma, C.-P. 2011, MNRAS, 417, 2982
- [] Geller, M. J., & Huchra, J. P. 1989, Science, 246, 897
- [] Genel, S., Bouché, N., Naab, T., Sternberg, A., & Genzel, R. 2010, ApJ, 719, 229
- [] Gnedin, N. Y. 2000, ApJ, 542, 535
- [] Gott, J. R., III, Jurić, M., Schlegel, D., et al. 2005, ApJ, 624, 463
- [] Guedes, J., Callegari, S., Madau, P., & Mayer, L. 2011, ApJ, 742, 76
- [] Guo, Q., White, S., Li, C., & Boylan-Kolchin, M. 2010, MNRAS, 404, 1111
- [] Habergham, S. M., Anderson, J. P., & James, P. A. 2010, ApJ, 717, 342
- [] Hambrick, D. C., Ostriker, J. P., Johansson, P. H., & Naab, T. 2011a, MNRAS, 413, 2421
- [] Hambrick, D. C., Ostriker, J. P., Naab, T., & Johansson, P. H. 2011b, ApJ, 738, 16
- [] Hirschmann, M., Naab, T., Somerville, R. S., Burkert, A., & Oser, L. 2012, MNRAS, 419, 3200
- [] Hoeft, M., Yepes, G., Gottlöber, S., & Springel, V. 2006, MNRAS, 371, 401
- [] Hoekstra, H., Hsieh, B. C., Yee, H. K. C., Lin, H., & Gladders, M. D. 2005, ApJ, 635, 73
- [] Humphrey, P. J., Buote, D. A., Canizares, C. R., Fabian, A. C., & Miller, J. M. 2011, ApJ, 729, 53
- [] Humphrey, P. J., Buote, D. A., Brighenti, F., et al. 2012, ApJ, 748, 11
- [] Katz, N., Keres, D., Dave, R., & Weinberg, D. H. 2003, The IGM/Galaxy Connection. The Distribution of Baryons at z=0, 281, 185
- [] Kereš, D., Katz, N., Weinberg, D. H., & Davé, R. 2005, MNRAS, 363, 2
- [] Komatsu, E., Dunkley, J., Nolta, M. R., et al. 2009, ApJS, 180, 330
- [] Komatsu, E., Smith, K. M., Dunkley, J., et al. 2011, ApJS, 192, 18
- [] Maiolino, R., Gallerani, S., Neri, R., et al. 2012, MNRAS, 425, L66
- [] McBride, J., Fakhouri, O., & Ma, C.-P. 2009, MNRAS, 398, 1858
- [] McGaugh, S. S., Schombert, J. M., de Blok, W. J. G., & Zagursky, M. J. 2010, ApJL, 708, L14
- [] Mo, H. J., Yang, X., van den Bosch, F. C., & Katz, N. 2005, MNRAS, 363, 1155
- [] Moster, B. P., Somerville, R. S., Maulbetsch, C., et al. 2010, ApJ, 710, 903
- [] Navarro, J. F., & White, S. D. M. 1993, MNRAS, 265, 271
- [] Nickerson, S., Stinson, G., Couchman, H. M. P., Bailin, J., & Wadsley, J. 2011, MNRAS, 415, 257
- [] Ocvirk, P., Pichon, C., & Teyssier, R. 2008, MNRAS, 390, 1326
- [] Okamoto, T., Gao, L., & Theuns, T. 2008, MNRAS, 390, 920
- [] Oñorbe, J., Domínguez-Tenreiro, R., Sáiz, A., & Serna, A. 2007, MNRAS, 376, 39
- [] Oser, L., Ostriker, J. P., Naab, T., Johansson, P. H., & Burkert, A. 2010, ApJ, 725, 2312
- [] Peirani, S., Mohayaee, R., & de Freitas Pacheco, J. A. 2004, MNRAS, 348, 921
- [] Peirani, S. 2010, MNRAS, 407, 1487
- [] Piontek, F., & Steinmetz, M. 2011, MNRAS, 410, 2625
- [] Powell, L. C., Slyz, A., & Devriendt, J. 2011, MNRAS, 660
- [] Prunet, S., Pichon, C., Aubert, D., Pogosyan, D., Teyssier, R., & Gottloeber, S. 2008, ApJS, 178, 179
- [] Rasera, Y., & Teyssier, R. 2006, A&A, 445, 1
- [] Read, J. I., Pontzen, A. P., & Viel, M. 2006, MNRAS, 371, 885
- [] Ricotti, M., Gnedin, N. Y., & Shull, J. M. 2002, ApJ, 575, 49
- [] Robitaille, T. P., & Whitney, B. A. 2010, ApJL, 710, L11
- [] Roncarelli, M., Cappelluti, N., Borgani, S., Branchini, E., & Moscardini, L. 2012, MNRAS, 424, 1012
- [] Scannapieco, C., Tissera, P. B., White, S. D. M., & Springel, V. 2008, MNRAS, 389, 1137
- [] Scannapieco, C., White, S. D. M., Springel, V., & Tissera, P. B. 2009, MNRAS, 396, 696
- [] Scannapieco, C., Wadepuhl, M., Parry, O. H., et al. 2012, MNRAS, 423, 1726
- [] Shen, S., Wadsley, J., & Stinson, G. 2010, MNRAS, 407, 1581
- [] Shen, S., Madau, P., Guedes, J., Mayer, L., & Prochaska, J. X. 2012, arXiv:1205.0270
- [] Sijacki, D., Springel, V., Di Matteo, T., & Hernquist, L. 2007, MNRAS, 380, 877
- [] Silk, J., & Rees, M. J. 1998, A&A, 331, L1
- [] Binney, J., Gerhard, O., & Silk, J. 2001, MNRAS, 321, 471
- [] Silk, J., & Nusser, A. 2010, ApJ, 725, 556
- [] Sinha, M., & Holley-Bockelmann, K. 2010, MNRAS, 405, L31
- [] Sinha, M., & Holley-Bockelmann, K. 2009, MNRAS, 397, 190
- [] Somerville, R. S. 2002, ApJL, 572, L23
- [] Springel, V. 2005, MNRAS, 364, 1105
- [] Stinson, G. S., Brook, C., Prochaska, J. X., et al. 2012, MNRAS, 425, 1270
- [] Stinson, G., Brook, C., Macciò, A. V., et al. 2012, arXiv:1208.0002
- [] Tabor, G., & Binney, J. 1993, MNRAS, 263, 323
- [] Thiébaut, J., Pichon, C., Sousbie, T., Prunet, S., & Pogosyan, D. 2008, MNRAS, 387, 397
- [] Thoul, A. A., & Weinberg, D. H. 1996, ApJ, 465, 608
- [] Tillson, H., Miller, L., & Devriendt, J. 2011, MNRAS, 417, 666
- [] Tornatore, L., Borgani, S., Viel, M., & Springel, V. 2010, MNRAS, 402, 1911
- [] Valiante, R., Schneider, R., & Maiolino, R. 2012, arXiv:1205.3488
- [] van de Voort, F., Schaye, J., Booth, C. M., Haas, M. R., & Dalla Vecchia, C. 2011, MNRAS, 414, 2458
- [] van de Voort, F., & Schaye, J. 2012, MNRAS, 2882
- [] Vitvitska M. , Klypin A. , Kravtsov A. V. , Wechsler R. H. , Primack J. R.& Bullock J. S. , 2002, ApJ 581, 799
- [] Wagner, A. Y., Bicknell, G. V., & Umemura, M. 2012, arXiv:1205.0542
- [] Wang, J., Navarro, J. F., Frenk, C. S., et al. 2011, MNRAS, 413, 1373
- [] Wechsler, R. H., Bullock, J. S., Primack, J. R., Kravtsov, A. V., & Dekel, A. 2002, ApJ, 568, 52
- [] Weinmann, S. M., Pasquali, A., Oppenheimer, B. D., et al. 2012, arXiv:1204.4184
- [] Zhu, W., Feng, L.-L., & Fang, L.-Z. 2011, MNRAS, 415, 1093