Chemical tracers of high-metallicity environments
Abstract
We present for the first time a detailed study of the properties of molecular gas in metal-rich environments such as early-type galaxies (ETGs). We have explored Photon-Dominated Region (PDR) chemistry for a wide range of physical conditions likely to be appropriate for these sources. We derive fractional abundances of the 20 most chemically reactive species as a function of the metallicity, as a function of the optical depth and for various volume number gas densities, Far-Ultra Violet (FUV) radiation fields and cosmic ray ionisation rates. We also investigate the response of the chemistry to the changes in element enhancement as seen in ETGs. We find that the fractional abundances of CS, H2S, H2CS, H2O, H3O+, HCO+ and H2CN seem invariant to an increase of metallicity whereas C+, CO, C2H, CN, HCN, HNC and OCS appear to be the species most sensitive to this change. The most sensitive species to the change in the fractional abundance of elements are C+, C, CN, HCN, HNC, SO, SO2, H2O and CS. Finally, we provide line brightness ratios for the most abundant species, especially in the range observable with ALMA. Discussion of favorable line ratios to use for the estimation of super-solar metallicities and -elements are also provided.
keywords:
astrochemistry – ISM:abundances – ISM:molecules – methods:numerical – galaxy:active – star:formation1 Introduction
Understanding the production of metals, and the subsequent enrichment of the ISM is crucial in many field of extragalactic astrophysics. For example, the initial mass function (IMF) of stars must have been different in the early universe, where no metals were present, and whether there is any remaining variation of IMF with metallicity remains an open question (e.g. Omukai et al. 2005; Santoro & Shull 2006; Tumlinson 2007; van Dokkum & Conroy 2011). Gas metallicity is regulated by a complex interplay between star formation, infall of metal-poor gas and outflow of enriched material. The discovery of a relation between galaxy mass and metallicity (Lequeux, 1979), showing that the more massive a galaxy is the higher is its metallicity, has increased debate about the metallicity and its relationship with galaxy characteristics and in particular with the properties of its interstellar medium.
Estimating the metallicity of a galaxy remains to date a difficult task with few methods available, and these have large uncertainties. Stellar metallicities are usually derived from absorption indices (such as those of magnesium and iron), but these weak features are hard to observe at high redshift, and only give information about the metallicity of the system in the past, when the stars were formed (e.g. McDermid et al. 2011). Optically determined metallicities of the ionised gas provide information on the metal content of star-forming complexes, allowing astronomers to probe the gas phase metallicity further out into the universe but this approach only works if the emission spectrum observed is powered by star formation processes. Where strong AGN activity, old stellar populations or shocks dominate, this method becomes unreliable. Furthermore, there can be strong degeneracies between low and high metallicity populations in some ionised gas metallicity indicators.
In this paper, we explore the possibility of determining metallicity via submillimeter observations where no dust attenuation is present, remaining a reliable method even if star formation does not dominate the ionisation of the gas. In particular, we concentrate on exploring the high metallicity range represented by early-type galaxies (hereafter called ETGs). These metal-rich objects (ellipticals and lenticulars) located at the ‘end point’ of galaxy merger sequences, carry important signatures of mass assembly and star formation in the Universe (e.g. Kaviraj et al. 2009). Surprisingly, a significant fraction of them ( 20%) contain some molecular gas reservoirs and are not as ‘red-and-dead’ as previously thought (Welch & Sage, 2003; Sage & Welch, 2006; Combes, Young & Bureau, 2007; Sage, Welch & Young, 2007; Krips et al., 2010; Young et al., 2011; Crocker et al., 2011). The properties of this molecular gas such as its temperature, volume number gas density, column density of gas etc. have been estimated (Bayet et al., 2012) showing a priori similarity with the molecular gas properties seen in the center of our own Galaxy. However, the origin of the gas in ETGs remains to date a mystery (but see Davis et al. 2011b). Determining the best molecular gas metallicity tracer can help to better constrain this origin. Indeed, if the metallicity of the molecular gas is similar to the measurements obtained from stars and the ionised gas, then the origin of the gas in ETGs is likely to be internal due to stellar mass loss. Otherwise, it is argued that an external origin due to past merging events and/or accretion is more likely.
Here, we perform a first detailed and comprehensive theoretical study of the influence of various parameters related to metallicity on the molecular gas properties, all likely to be appropriate for ETGs. The Photon-Dominated Region (PDR) code and the chemical database that we have used for our study are described in Section 2, and the physical parameters we have selected are discussed in Section 3. Results describing the chemistry and its sensitivity to variations of these parameters are presented in Section 4. In Section 5, we list the best chemical species or combinations of them we found which represent well ETG environments. In Section 6 we summarize our conclusions.
2 Model Description
We make use of the UCL_PDR model as described in Bell et al. (2005, 2006); Bayet et al. (2009b, 2011). This is a time-dependent Photon-Dominated Region (PDR) model. In the present application, the code is run for 107 yrs, at constant density, by which time chemical steady state is reached in all models. In fact, the fractional abundances at 106 yrs do not differ significantly from those at 107 yrs. Thus, time-dependence above 106 yrs is unlikely to play a role in the chemistry. The code operates in one spatial dimension for an assumed semi-infinite slab geometry, and computes self-consistently the chemistry and the temperature as functions of depth and time within the semi-infinite slab, taking account of a wide range of heating and cooling processes (Bayet et al., 2011). In this work, the code is used to determine the chemical and thermal properties at all depths up to 20 visual magnitudes.
Here, we improved the UCL_PDR code by adding the calculation of the line brightnesses for 13CO, C18O, CS and HCN transitions (see results in Subsect 4). These line brightnesses (in erg s-1 cm-2 sr-1) are calculated using the LVG approximation (see e.g. van der Tak et al. 2007) and the collisional rates with H2 are taken from the Leiden Atomic and Molecular Database (LAMDA; Schöier et al. 2005). The detailed description of these latest changes in the code and their consequences in its overall structure are outside the scope of this paper but can be found in great detail in Bell, Bayet & Viti (2012).
The chemical network used here links 131 species in over 1800 gas-phase reactions; only H2 is formed by surface chemistry. Freeze-out of species on to grain surfaces is not considered. This might have a severe impact on the fractional abundance predictions at A mag since at these optical depths, the temperatures, as seen in Fig. 1, are low. In addition, freeze-out time is about 104yrs for most of the models developed in the present study and 1000 yrs and about 100 yrs for Models 13 and 14 respectively. Therefore, freeze-out may be important. However, at those extinctions the rotational lines considered in this study are mostly optically thick in which case freeze-out would not affect the line ratios but still the abundances. We have thus run chemical models to estimate the impact of freeze-out on abundances and this is estimated to be about 3-8%, depending on the extinction and species considered. The UCL_PDR code has been validated against all other commonly used PDR codes and performs well (Röllig et al., 2007).
3 Parameter Selection
The model requires the setting of a number of physical and chemical parameters. The choices we have made are listed in Table 1, 2 and 3.
Most of the calculations are made for an assumed gas number density of hydrogen nuclei (in all forms) cm-3, typical value found for molecular gas in galaxies. The Av values range from 0 to 20 mags. For Fig. 1 (left hand side) and Fig. 2, we took five representative depths into the one-dimensional slab: A, 3, 5, 8 and 20 mag. These values have been selected intending to represent various gas phases from a dense PDR surface to dark cloud conditions.
We have investigated how metallicity changes influence the chemistry by studying the effect of an increase of metallicity from 1 to 3.3 z⊙ by steps of 0.2 z⊙ from 1.1 z⊙. z = 1 z⊙ corresponds to solar value of the initial elemental abundance ratios (see Table 2) while z = 2.5 z⊙ means that the solar values of the initial elemental abundance ratios have been all multiplied by the same factor (of 2.5 in this example). The metallicity range has been chosen such as to agree with observational results from the ATLAS3D survey which show that metallicity ranges for local ETGs from 0.043 to 0.5 dex i.e. from 0.9 z⊙ to 3.2 z⊙ (McDermid et al., 2011). The step of 0.2 z⊙ was chosen so as to have a reasonable sampling. Several parameters are assumed to scale linearly with metallicity. These are the dust-to-gas mass ratio, the H2 formation rate, and the initial elemental abundances. The values of these parameters for solar metallicity are given in Table 1 and 2. The elemental initial abundances given in Table 2 are derived from the most up-to-date estimates obtained on comets and solar photosphere studies (see Asplund et al. 2009 and references therein).
High metallicity environments such as ETGs or Milky Way metal-rich stars (typically Pop II) have been found to have some of their elements enhanced as compared to others (e.g. Ryan, Norris & Bessell 1991; McDermid et al. 2011). These enhanced elements are oxygen (O), neon (Ne), magnesium (Mg), silicon (Si), sulphur (S), argon (Ar), calcium (Ca) and titanium (Ti). They are more generally called elements since their most abundant isotopes are integer multiples of the mass of the helium nucleus (the particle). Aller & Greenstein (1960) were the first to see element enhancement in metal-poor stars in our Galaxy. Peletier (1989) was the first to note that you can not reproduce the stellar populations of ETGs without element enhancement whereas Ranalli et al. (2003); Origlia et al. (2004) worked out what this meant in terms of bursty star formation. For a review on elements and their enhancements, we refer the reader to Thomas (1999).
In the current UCL_PDR code, only 5/8 elements, namely O, Mg, Si, S and Ca are included in the chemical network (see Table 2 in bold font). For the rest of the paper, we thus consider only the influence on the chemistry of a change in these 5 elements (see Subsection 4.3). To be more specific, we studied the element enhancement of Salaris & Weiss (1998) who provided the most recent elements enhanced mixture able to reproduce well observations of the metal-rich globular clusters in the galactic disk (see Table 2, column 2) and thought to be appropriate for ETGs. In their study, they enhanced the elements by various factors. We also studied another scenario of element enhancement used mostly in metal-rich stellar evolution model likely appropriate for ETGs too, investigated by Weiss et al. (2004). In their paper, contrarily to Salaris & Weiss (1998), they applied a systematic +0.4 dex factor to all the elements. Here, we do not use directly the values reported in Salaris & Weiss (1998) and Weiss et al. (2004) because they each use different standard (solar) values than ours but we adapted their approach to our standard values (see results in Table 2).
The models require the specification of the mean dust grain radius and albedo, which affect the transfer of external radiation into the cloud. The values given in Table 1 are canonical. The external radiation field impinging on the one-dimensional semi-infinite slab is assumed to be 1 Habing in most cases, however the influence of stronger radiation field is investigated through Models 15 and 16 (see Section 4). 1 Habing is the standard value used for the Milky Way. The cosmic ray ionisation rate standard values used in our study is s-1.
Finally, the models also require the specification of the microturbulence velocity for line-width calculations . We use the value adopted by Bayet et al. (2009b) i.e. 1.5 km s-1.
Our grid contains 20 models. Models 0 to 12 investigate the effect of metallicity changes on the chemistry. Models 8, 13 and 14 allow us to study the influence on the chemistry of the change of gas number density. Models 15 and 16 look at the influence of an enhanced FUV radiation field, whereas Models 17 and 18 focus on the influence of the increase of cosmic ray ionisation rate. Finally Models 19 and 20 analyse changes in the high-metallicity chemistry for different scenarios of element enhancement.
As shown in McDermid et al. (2011) and Kuntschner et al. (2010), some ETGs may have sub-solar metallicity stellar populations in their cores. These low metallicity cores are likely caused by the accretion of low metallicity gas. Kaviraj et al. (2011) showed that a number of ETGs have acquired cold gas through accretion during minor merger events with dwarf galaxies (at redshift smaller than 1). Davis et al. (2011a) also showed that 50% of gas-rich field ETGs in the local volume have obtained this gas from mergers or accretion. Low metallicity gas that is accreted will, however, quickly be enriched by SNII (within few hundred Myrs) from the newly formed stellar population. It is thus likely that almost all gas rich ETGs have solar metallicity gas, or above. This assumption is reinforced by the fact that in cluster environments, where most of the ETGs studied in this paper are, the dwarf satellite galaxies are coming in fairly dry, having most of its gas already stripped out, and so, a larger fraction of the gas is actually coming from stellar mass loss and therefore must be of higher metallicity. The chemistry of low metallicity gas has been partially explored in Bayet et al. (2009b) and forthcoming more detailed studies are in preparation.
| Gas Density | 104 cm-3 |
|---|---|
| Mean photon scattering by grain | 0.9 |
| External FUV radiation intensity (=I⊙) | 1 Habinga |
| Cosmic ray ionization rate (=) | 5.0 s-1 |
| H2 formation rate coefficient (=R⊙) | 3 cm3s-1 |
| Dust:gas mass ratio (=d⊙) | 1/100 |
| Metallicity (=z⊙) | solar values b |
| Grain size | 0.1 |
| Grain albedo | 0.7 |
| Av maximum | 20 mag |
| Microturbulent velocity | 1.5 kms-1 |
a: The unit of the standard Interstellar Radiation Field (ISRF) intensity is I⊙ = 1.6 erg cm-2 s-1 Habing (1968); b : z = 1 = z⊙ corresponds to solar values of the initial elemental abundance ratios (see Table 2, first column) while z = 2.5 z⊙ means that the solar values of the initial elemental abundance ratios have been all multiplied by the same factor (of 2.5 in this example).
| ST | SW98 | WE04 | |
|---|---|---|---|
| Fe/H | 3.1610-5 | 3.1610-5 | 3.1610-5 |
| C/H | 2.6910-4 | 2.6910-4 | 2.6910-4 |
| O/H | 4.9010-4 | 1.5510-3 | 1.2310-3 |
| N/H | 6.7610-5 | 6.7610-5 | 6.7610-5 |
| Si/H | 3.2410-5 | 8.1310-5 | 8.1310-5 |
| S/H | 1.3210-5 | 2.8210-5 | 3.3110-5 |
| Ca/H | 2.1910-6 | 6.9210-6 | 5.5010-6 |
| He/H | 8.5110-2 | 8.5110-2 | 8.5110-2 |
| Mg/H | 3.9810-5 | 1.0010-4 | 1.0010-4 |
| Na/H | 1.7410-6 | 1.7410-6 | 1.7410-6 |
| Cl/H | 3.1610-7 | 3.1610-7 | 3.1610-7 |
| Model | Metallicity | Dust-to-gas | H2 form. | Ini. Elem. | FUV rad. field | Gas Density | |
|---|---|---|---|---|---|---|---|
| (z⊙) | mass ratio (d⊙) | rate coeff.(R⊙) | Abund. ratios | (I⊙) | () | (cm-3) | |
| 0 | 1 | 1 | 1 | ST | 1 | 1 | 104 |
| 1 | 1.1 | 1.1 | 1.1 | STx1.1 | 1 | 1 | 104 |
| 2 | 1.3 | 1.3 | 1.3 | STx1.3 | 1 | 1 | 104 |
| 3 | 1.5 | 1.5 | 1.5 | STx1.5 | 1 | 1 | 104 |
| 4 | 1.7 | 1.7 | 1.7 | STx1.7 | 1 | 1 | 104 |
| 5 | 1.9 | 1.9 | 1.9 | STx1.9 | 1 | 1 | 104 |
| 6 | 2.1 | 2.1 | 2.1 | STx2.1 | 1 | 1 | 104 |
| 7 | 2.3 | 2.3 | 2.3 | STx2.3 | 1 | 1 | 104 |
| 8 | 2.5 | 2.5 | 2.5 | STx2.5 | 1 | 1 | 104 |
| 9 | 2.7 | 2.7 | 2.7 | STx2.7 | 1 | 1 | 104 |
| 10 | 2.9 | 2.9 | 2.9 | STx2.9 | 1 | 1 | 104 |
| 11 | 3.1 | 3.1 | 3.1 | STx3.1 | 1 | 1 | 104 |
| 12 | 3.3 | 3.3 | 3.3 | STx3.3 | 1 | 1 | 104 |
| 13 | 2.5 | 2.5 | 2.5 | STx2.5 | 1 | 1 | 105 |
| 14 | 2.5 | 2.5 | 2.5 | STx2.5 | 1 | 1 | 106 |
| 15 | 2.5 | 2.5 | 2.5 | STx2.5 | 10 | 1 | 104 |
| 16 | 2.5 | 2.5 | 2.5 | STx2.5 | 100 | 1 | 104 |
| 17 | 2.5 | 2.5 | 2.5 | STx2.5 | 1 | 10 | 104 |
| 18 | 2.5 | 2.5 | 2.5 | STx2.5 | 1 | 100 | 104 |
| 19 | 2.5 | 2.5 | 2.5 | SW98 | 1 | 1 | 104 |
| 20 | 2.5 | 2.5 | 2.5 | WE04 | 1 | 1 | 104 |
4 Sensitivity of chemistry to variations of the UCL_PDR model parameters
In this section, we present the trends the chemistry is showing with respect to the changes of the parameters described in Section 3. We have selected about 25 molecules for closer study, either for their likely detectability or for their chemical interest. We have arbitrarily fixed the limit of detectability of a molecule X to be with a relative abundance of n(X)/n (where nn(H) 2n(H2)), a criterion roughly satisfied in our own galaxy. The rest of our paper thus deals specifically with species H2, H, electron, C+, C, CO, CS, SO, SO2, OCS, H2CS, H2S, C2H, OH, H2O, H3O+, HCO+, CH, NH3, CN, HCN, HNC, H2CO, H2CN and CH3OH. We additionally exclude methanol from this study because this species is mainly form on grains and such reactions are not included in the model we have used. There is only one (minor) gas-phase formation route that we include in our models but since we are not properly modelling its formation, we do not think we can say anything in this study about the variation of methanol abundances with parameters such metallicity.
4.1 Gas number density, FUV radiation field and cosmic ray ionisation rate
As recently published by Krips et al. (2010); Crocker et al. (2011), HCN and HCO+ lines have been detected in high-metallicity environments such as ETGs. These detections show the likely presence of gas denser than that traced by CO since to excite the transitions HCO+(J=1-0) and HCN(J=1-0), part of the gas density needs to be close to the corresponding line critical densities of 3.4 cm-3 and 2.3 cm-3, respectively. We investigated thus the change in high-metallicity chemistry when the density increased by a factor of 10 (Model 13 in Table 2) or 100 (Model 14) as compared to the selected standard value of cm-3 (Models 0). Not surprisingly, changes in gas density affect high-metallicity chemistry in the same way as found for solar-metallicity chemistry. Detailed analysis of such changes can be found in Bayet et al. (2009b). Similarly, the influence of the FUV radiation field and the cosmic ray ionisation rate on high-metallicity chemistry is the same as for solar-metallicity chemistry. Since results have been already published, for the FUV radiation field influence we refer the reader to Figure 5 and Table 8 from Bayet et al. (2009b). For a detailed influence of the cosmic ray ionisation rate on the chemistry, we refer the reader to e.g. Papadopoulos (2010); Bayet et al. (2011); Meijerink et al. (2011).
4.2 Metallicity
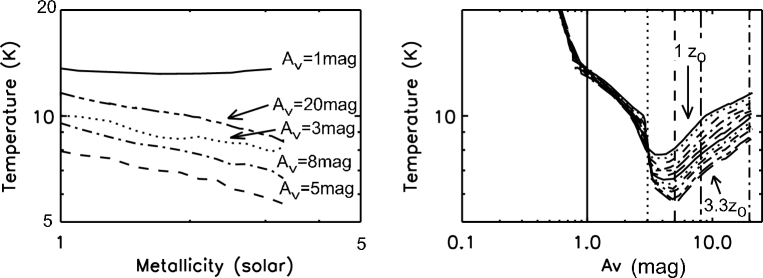
We have plotted in Fig. 1 the temperature distribution obtained from the self-consistent thermal balance, as a function of the metallicity (left hand side) for the five Av selected previously. We have also plotted the temperature distribution as a function of Av for the range of studied metallicities (i.e. from solar to 3.3 z⊙ by step of 0.2 z⊙, see right hand side of Fig. 1). The curves on the left hand side of Fig. 1 show the same general behaviour for A 1 mag i.e. decreasing with increasing metallicity, reaching a minimum of about 6 K for A 5 mag and going up again for higher extinctions. This increase of temperature after A 5 mag, already mentioned in Bayet et al. (2011), is due to the fact that at high visual extinctions the C and CO lines become optically thick and hence are less able to cool the gas whilst the other sources of heating (such as the cosmic rays) which dominate the heating at these depths (60% of the total heating) remains constant. At A 5 mag, the cooling is actually dominated by CS (35.7%), followed by H2O (20%) and 13CO (13%) which show again the importance of the newly added radiative cooling mechanisms (see Section 2 and Bayet et al. 2011). The temperature curve at A 1 mag appears insensitive to metallicity changes; increasing the metal content of the ISM thus does not seem to have significant impact on the total heating or cooling mechanisms of the UV irradiated part of the ISM. This is indeed expected since increased metallicity enhances similarly the PAH and dust photo-electric heating as well as the CO cooling. The ratio between heating and cooling processes stays thus roughly the same from a metallicity value to another. No additional radiative contribution to the total cooling from molecules are seen at A mag since at such depth, molecules are mainly dissociated by the FUV radiation field. Generally, the temperatures seen in Fig. 1 stay below 20 K whatever the metallicity and the Av, ensuring a rich chemistry.
Increasing the metallicity (see Fig. 2) has a different impact from one species to another. When increasing the metallicity, we can disentangle three different behaviours in the chemical abundances. The species seen on the left hand side of Fig. 2 decrease by a factor of 3 to 10 with increasing metallicity whereas those plotted on the upper right hand side of Fig. 2 increase by a factor of 3 to 15 with increasing metallicity. H2, C, electron, CS, H2S, H2CS, H2O, H3O+, HCO+ and H2CN do not show significant variations and thus can be considered as species insensitive to metallicity increase from the solar value. Interestingly, one can also add to this list of ‘constant’ fractional abundances those of OH and CN for the case A mag only (see black solid lines in Fig.2). Outside these three categories is SO with an increased fractional abundance at A, 3 and 20 mag but otherwise decreasing; SO2 with a decreased fractional abundance at A and 8 mag but otherwise increasing; NH3 with a decreasing fractional abundances with increasing metallicity for A and 20 mag but otherwise increasing for A mag and increasing then decreasing for A mag (see bottom right hand side of Fig. 2). C+ and C2H at A mag have smaller variations than those seen for SO, SO2 and NH3 but the fact that the C+ and C2H fractional abundances are high (i.e. above 10-10) makes these more moderate variations as meaningful as those seen for SO, SO2 and NH3.
Complementary results on the variation of the fractional abundances of chemical species with changes in metallicity can be found in Bayet et al. (2009b), where we showed that, CS in particular, is sensitive to changes in metallicity. This apparent contradiction with our current results can be explained by the fact that the models in Bayet et al. (2009b) where for low metallicity whereas in the present study we investigate super-solar metallicities appropriate for ETGs. In addition, in Bayet et al. (2009b) the FUV radiation field is set three times higher than in our present study, which has a dramatic effects on the CS fractional abundance (see their Table 8).
It is on average very difficult to determine the reason for those changes in the chemistry caused by the metallicity because the effects are non-linear involving changes in both total elements and dust-to-gas ratio. However, the first category of species can be understood as actually a result of what happen to the species of the second category when the metallicity increases. For instance, species such as HCN and HNC (category 2) form predominantly from CN, a species which decreases its abundance at high metallicity (first category). This decrease is linked to the decrease of H at high metallicity, H being involved in one of the main formation routes of CN. The decrease of the CN abundance is also reinforced by the destruction route CN H2 where H2 remains high whatever the metallicity. Thus, if HCN and HNC abundances increase with metallicity, this must cause the CN abundance to drop, and vice-versa. Similar chemical routes exist between CO, C2H and H2CO. Detailed chemical analysis following the formation and destruction routes of some of the species included in our models has been performed and confirms the present interpretation of these categories. The behaviour of species whose abundances are independent of the change in metallicity can be explained by the fact that those species are both formed and destroyed by exchange reactions that equally depend on metallicity and the net result is that no change occurs due to metallicity changes. For instance, H2S is destroyed mainly by oxygen which increases with the metallicity, but is formed mainly by electrons recombining with H3S+, H2S+ and H2S, reactions which also increase with metallicity. This results in a simultaneous increase in both formation and destruction, which leaves the abundance of H2S unchanged. More generally, an increase in metallicity leads to a decrease in H, C+ and molecular ions via dissociative recombination, and an increase in electrons. One notes also that, as a secondary effect of the increase in metallicity, the secondary photon process is enhanced due to an increase of total hydrogen nuclei.
4.3 element enhancement
This is the first time that high-metallicity chemistry has been studied with respect to the changes in elements content (see Fig. 3). As described in Section 3 and seen in Table 2, we have used in the present work two mixtures of elements, one corresponding to the approach of Salaris & Weiss (1998) with different factors for each element (Models 19 in Table 3) and one from Weiss et al. (2004) who increase by a factor of 0.4 dex all the elements (Models 20 in Table 3).
We can divide molecular species in three categories: those insensitive to the changes in elements i.e. whose fractional abundances do not change by more than a factor of 2: CO, H, OH, NH3, H2S, OCS, H3O+, HCO+; the species which have their fractional abundances increasing by a factor between 3 and more than 3 orders of magnitude when the elements are enhanced (see right hand side of Fig. 3) i.e. SO, SO2, CS and H2O. Finally, the third category includes CN, HCN, HNC, CH, C2H, H2CS, C+, C and H2CO. These species decrease in fractional abundances with the element enhancement, by up to 5 orders of magnitude for C2H (see left hand side of Fig. 3). We have not shown in Fig. 3 the evolution of the fractional abundance of H2CN with respect to the change in elements because its fractional abundance drops close or below our limit of detectability. Hence this species, even if sensitive to the changes in elements is not likely to be detectable. However a stringent non-detection could be indicative. Similarly, for C2H, CH at A 8 mag, and H2CO, the decrease of fractional abundance is so pronounced that they fall under the assumed limit of detectability. Otherwise, the response of the fractional abundance of the species belonging to the second and third categories make them quite sensitive, hence potential good tracers of element enhancement. For those species whose fractional abundance is above 10-10 whatever the optical depth, they are likely detectable.
Another interesting aspect is the potential difference in the chemistry between the two scenarios of element enhancement. The species showing the most contrast in their fractional abundances are C2H, H2S, CH and C (increase of a factor greater than 2 between Models 19 and 20) and SO and SO2 (decrease by a factor greater than 2). Here, only species showing a fractional abundance varying by a factor of more than five between the scenarios of element enhancement (i.e. only C2H) may be useful for distinguishing the Salaris & Weiss (1998) scenario (i.e. various factors applied to the elements) from the Weiss et al. (2004) one (i.e. same factor of +0.4 dex applied to all elements). However the fractional abundance of C2H in Models 19 and 20 is very low, whatever the optical depth which makes this species unlikely to be detectable. To summarize, it appears thus not possible to use models to disentangle the two scenarios of element enhancement.


5 Molecular tracers of high-metallicity environments
5.1 Fractional abundances
In this section, we attempt to identify the best chemical tracers of high-metallicity environments and to provide corresponding line brightnesses (in erg s-1 cm-2 sr-1) useful for future observational programmes. We restrict the number of species we analyse to those (i) belonging to the list of the most sensitive species seen in Subsection 4.2 and 4.3 i.e. to those having a fractional abundance changing by more than a factor of 5 with changes in metallicity or in elements; to those (ii) having a fractional abundance at least 10 times higher than our arbitrarily fixed limit of detectability; and to those (iii) having at least one transition previously observed in extragalactic environments. This leads to the detailed study of C+, C, CO, C2H, CN, HCN, HNC, OCS, CS, SO, SO2 and H2O.
From Subsection 4.2, species likely to be the best at probing changes in metallicity are C+, C2H, CN, HCN, HNC, OCS, CO. Similarly, the most likely chemical tracers for determining whether there is an enhancement in elements are C+, C, CN, HCN, HNC, SO, SO2, H2O and CS. Potentially, a non-detection of C2H may also be used to indicate the presence of an enhanced elements environment.
In Table 4, we provide values of fractional abundance ratios involving the above species with CS and CO for Models 0,8 and 12 at 5 different extinctions. The fractional abundance of CS and CO have been selected as denominators for the ratios because CS is shown to be rather insensitive to changes in metallicity and CO insensitive to the presence of an element enhancement (see Section 4).
There is no strong variation seen in the ratios for A mag. Therefore, this range of extinctions does not have an observational interest. The ratios showing the largest variations when the metallicity increases are C+/CO, SO/CO, CN/CO and CN/CS, with a factor of differences between Models 0, 8 and 12, at A mag, of 160, 36, 22 and 16, respectively. These ratios thus might be considered as the best and most likely observable probes of the metallicity changes in metal-rich environments. In addition, the ratios showing the largest variations when there is an element enhancement are C2H/CS, SO2/CO, SO/CO, HCN/CS and HNC/CS with factors of difference between Models 8 and 19, at A mag, of 5000, 1049, 669, 117 and 71, respectively. At higher Av, C/CO becomes also a good indicator as it differs between Models 8 and 19 by more than a factor of 55. These ratios might thus be considered as the most reliable probes of an element enhancement in metal-rich environments.
5.2 Line brightness ratios
The LVG treatment used in the UCL_PDR code to calculate the line brightness requires collisional rates for the studied species (typically with H2). Unfortunately, for C2H, these collisional rates are not available. We therefore do not have line brightness predicted by our models for this species. We also do not calculate line brightness for SO2 and H2O because they contain a very large number of level populations which are required for a proper treatment, and, as a consequence, an unreasonable amount of computational time.
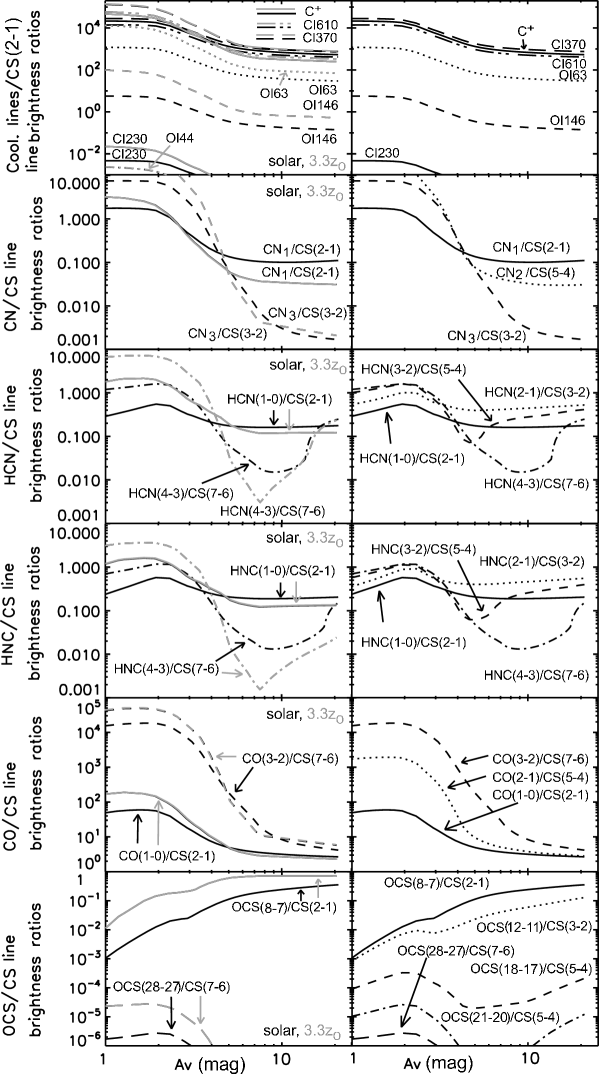
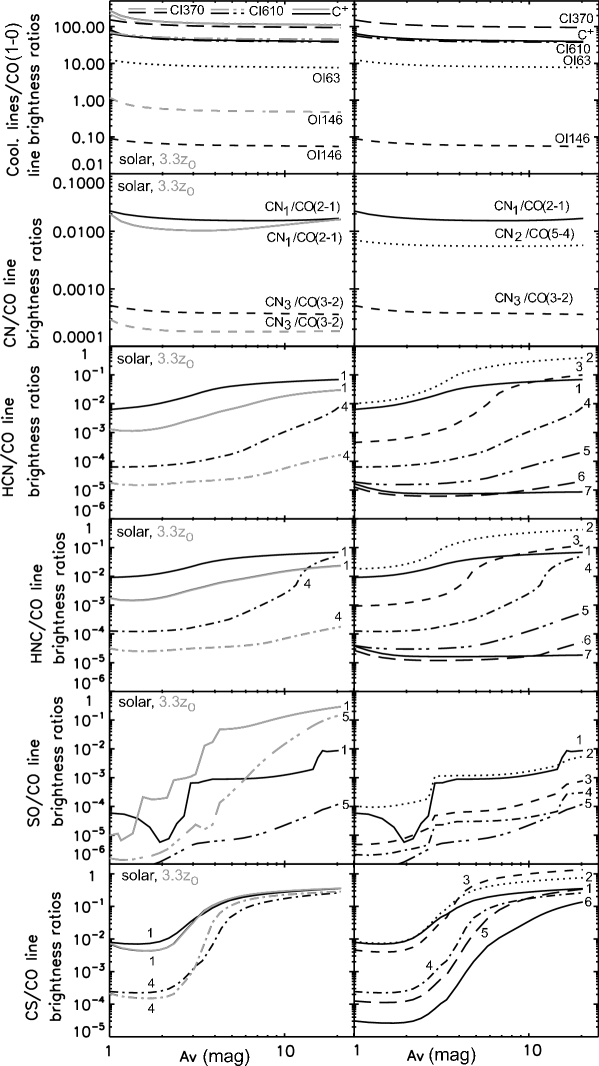
In Fig. 4, for Models 0 and 12, we have therefore plotted line brightness ratios for C+/CS, CN/CS, HCN/CS, HNC/CS, CO/CS and OCS/CS as a function of Av. We restricted our plots to line ratios involving transitions observable simultaneously using large backends on telescopes such as IRAM-30m or ALMA, i.e. to those with close frequencies such as HCN(1-0)/CS(2-1), HNC(3-2)/CS(5-4), OCS(28-27)/CS(7-6), etc. In the right hand side of Fig. 4, we see the distribution of the line brightness ratios with respect to Av for Model 0 only. On the left hand side of Fig. 4, we see the comparison between Models 0 (black lines) and 12 (grey lines) i.e. the comparison between solar and 3.3 z⊙ metallicity, for only a selected number of line brightness ratios. In Fig. 5, we have plotted the C+/CO, C/CO, CN/CO, HCN/CO, HNC/CO and CS/CO ratios. Similarly to figure 4, on the right hand side of Fig. 5, the results from Model 8 are displayed whereas on the left hand side of Fig. 5, we see the comparison between Model 8 (black lines, without element enhancement) and Model 19 (grey lines, with element enhancement). The top panels in both figures present the ratios between well-known ISM cooling lines i.e. C+, OI (146 m), OI (63 m) , OI (44 m), CI (610 m), CI (370 m) and CI(230 m) and the CS(2-1) line (Fig 4) or the CO(1-0) transition (Fig 5). The CS(2-1) and CO(1-0) transitions were selected as denominators firstly because the CS and CO fractional abundances are insensitive to changes in metallicity and presence of elements, respectively, and secondly, because these two lines have easily detectable emission at 3mm in external galaxies (see e.g. Israel & Baas 2001, 2003; Bayet et al. 2004, 2006, 2009a; Aladro et al. 2011). One notes that OI is not amongst the species respecting conditions i), ii) and iii), but we have nevertheless plotted its OI (146 m), OI (63 m) and OI (44 m) line brightnesses because they are routinely observed in extragalactic environments. Additional line ratios will soon be available online (see http://www.homepages.ucl.ac.uk/ ucapdwi/interface).
The results derived from figures 4 and 5 can be summarized as follow:
-
•
The increase in metallicity impacts similarly for all the ratios involving the well-known ISM cooling lines with respect to the CS(2-1) line, i.e. these ratios have higher values up to a factor of 20 (for OI (44 m)/CS(2-1)) as compared to their value in the case of solar metallicity (i.e. Model 0). Similarly, the OCS/CS line brightness ratios increase with the increase of metallicity, whatever the transition considered. For well-known ISM cooling line ratios, the increase between solar and 3.3 z⊙ is constant with respect to the Av whereas for the OCS/CS ratio, this increase decreases when Av increases. This allow us to propose this ratio as powerful diagnostics of either the metallicity or the opacity. Indeed, if the OCS(8-7)/CS(2-1) line brightness ratio is measured in external galaxies to be for instance 0.1, this corresponds either to a gas metallicity of 3.3 solar and a rather translucent gas (with an A mag) or the metallicity of the gas is solar and the A 4 mag. To break this metallicity-opacity degeneracy, independent estimates of the Av are required. To do so, molecular isotopologues detections are essential. Possible way to break this degeneracy is to use a set of line ratios, providing they involve lines with similar critical densities, allowing us to assume they originate from the same gas component. For example, a combination of H2CS(7-6), HCO+(3-2), H2CO(3-2), SO(5-4) and C2H(3-2) compared with CS(5-4) would be useful since those lines, close in frequency to the CS(5-4) transition, have also similar critical densities (of about cm-3). For the other ratios seen in Fig. 4 (i.e. CN/CS, HCN/CS, HNC/CS and CO/CS), but excluding OCS(8-7)/CS(2-1) the metallicity boost to 3.3 z⊙ increases the ratios as compared to the solar case for A mag up to a factor of 8 for HCN(1-0)/CS(2-1) and HCN(4-3)/CS(7-6). Then, at A mag (A mag for the CN_1/CS(2-1)), the two metallicity models give similar ratios. At these extinctions, it will thus not be possible to use the models predictions for estimating the gas metallicity. Finally, at A mag, the ratios for the solar and 3.3 z⊙ metallicities are decoupled again, with lower ratio values for the 3.3 z⊙ metallicity case than for the solar one. At high extinctions, however the difference between the two modelled ratios might not be large enough to be detectable, leading to a rather uncertain estimate of the metallicity. Here, we have considered observational uncertainties (calibration, pointing, etc) of 20%, i.e. to be detectable, we need a difference between ratios greater than a factor of 5. Two exceptions stand in the HCN/CS and HNC/CS ratios involving transitions at about 300 GHz frequency: if the Av is estimated independently to be of about 8 mag, then the metallicity can be determined (factor of 8 difference between the ratios at solar and 3.3 solar metallicity). One notes that line brightness CO/CS ratios are not the best ratios to use for estimating the metallicity since the difference between the two model predictions are not as large as those seen for the HNC/CS and HCN/CS ratios (the latter ones being a much better indicator of metallicity).
-
•
In high-metallicity environments such as ETGs (here we assume the metallicity to be at 2.5 z⊙ - see Fig. 5), it may possible to confirm the presence of element enhancements by measuring line brightness SO/CO ratios. Indeed these ratios show the strongest increase of values between Models 8 and 19, especially for A mag and this, whatever the transition studied. An element enhancement decreases the rest of the line brightness ratios by a factor 0.5 to 5. One notes that the decrease of the ratios in the case of low frequency ratios such as HCN(1-0)/CO(1-0), HNC(1-0)/CO(1-0) and CN_1/CO(1-0) is not large enough for ensuring a confirmation of element enhancement whereas for the ratio involving higher frequency line brightnesses such as HCN(4-3)CO(3-2), HCN(4-3)/CO(3-2), especially for A mag, this is becoming possible.
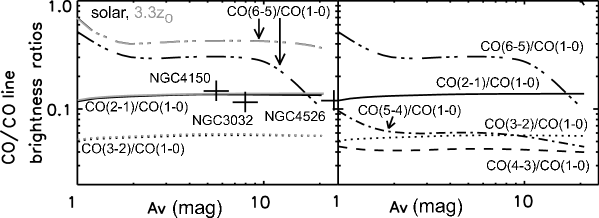
In Figure 6, we plot theoretical and observed CO line ratios for ETGs. CO(1-0), CO(2-1), 13CO(1-0), 13CO(2-1), HCO+(1-0) and HCN(1-0) data have been published for a limited number of gas-rich ETGs (Krips et al., 2010; Young et al., 2011). From the 12CO/13CO ratio and assuming a Milky Way value of the abundance ratio 12C/13C=70 (see Martín et al. 2010 and references therein), using the Eq. 8 in Bayet et al. (2004), we have obtained an Av for the 12CO gas of 5.5 mag, 8.0 mag, 22 mag and 23.7 mag for NGC4150, NGC3032, NGC4526 and NGC4459, respectively from 12CO(1-0)CO(1-0) ratios of 13.67, 9.46, 3.46 and 3.20, respectively from Krips et al. 2010 and Young et al. 2011.
On the left hand side of Fig. 6, we compare the CO beam-dilution corrected observations to our model predictions. In this plot, we have plotted the variations of the CO(2-1)/CO(1-0) line brightness ratio with respect to Av for a solar (black line) and a 3.3z⊙ metallicity (grey lines). Crosses represent the current observed CO(2-1)/CO(1-0) line brightness ratios for four observed gas-rich ETGs (derived from the beam corrected velocity-integrated line intensity ratios displayed in Krips et al. 2010 data. For Young et al. 2011 data, we used beam dilution correction method described in Crocker et al. 2011). We can see that the variation of the CO(2-1)/CO(1-0) ratio with the increase of metallicity is not significant enough to reliably constrain the metallicity of these gas-rich ETGs, even if the Av has been determined using 13CO(1-0) data. However, one sees that the line brightness CO(6-5)/CO(1-0) ratio can be useful as a CO line ratio alternative to estimate metallicity. The typical error on each observed CO(2-1)/CO(1-0) ratio is of 12% (see Krips et al. 2010; Young et al. 2011). If similar error can be obtained on the line brightness CO(6-5)/CO(1-0) ratio, then, from Fig 6, reliable metallicity estimate may be possible to obtain, especially if the gas is strongly opaque as in NGC4526 and NGC4459 (whose Av is outside the plot). CO(J–J-1)/CO(1-0) lines at high frequency seem thus a better indicator of the metallicity in high metallicity environments than lower frequency CO line ratios, but, in any case, ratios such as HCN/CS and HNC/CS are more powerful diagnostics. Future work (Davis et al., 2012) will explore this issue with new and recently released observational data (Crocker et al., 2011).
6 Conclusions
The main results of this theoretical study are contained in Section 4 which shows how the chemistry evolves with respect to the changes in various parameters likely to be appropriate for high-metallicity environments such as ETGs: FUV radiation field, density, cosmic-ray ionisation rate, metallicity (increase up to 3 times solar), and an enhancement in the elements. The impact of the last two parameters on the chemistry have never been investigated so far in such detail. Table 4 and Figs. 2-6 are thus of particular interest, especially when considering the fact that at high metallicity the influence of the FUV radiation field, density and cosmic-ray ionisation rate on the chemistry does not differ significantly from what has been previously shown by e.g. Bayet et al. (2009b); Papadopoulos (2010); Meijerink et al. (2011); Bayet et al. (2011).
From our study, it appears that the best observable tracers of metallicity are C+, C2H, CN, HCN, HNC, OCS and CO whereas the most likely observable chemical tracers for probing enhancement in elements are C+, C, CN, HCN, HNC, SO, SO2, H2O and CS. Fractional abundances and line brightness ratios with respect to CS (insensitive to metallicity changes) and to CO (insensitive to element changes) provide more quantitative values, useful for future follow-up observational programmes. Powerful tracers of metallicity changes have been identified (from the most sensitive to the least): the HCN/CS and HNC/CS line brightness ratios at all frequency for a gas with Av either smaller than 3 mag or of about 8 mag, line brightness OI/CS(2-1) ratios for a gas with A 4 mag and OCS/CS line brightness ratios at all frequencies for gas with A 4 mag. The ideal line brightness ratio for probing the enhancement of elements is the SO/CO whatever the optical extinction and the frequency of the lines involved. One notes that ratios involving two CO lines are not the best probes of either metallicity or element enhancement. However when CO(6-5)/CO(1-0) line brightness ratio is used and the error on the ratio is small, some reasonable estimate of the metallicity can be obtained. This however may be difficult without a good treatment of beam dilution effects.
To conclude, if CS data are obtained in sources like ETGs, HCN/CS line brightness ratios can be calculated and from the results displayed here, we may be able to estimate the molecular gas metallicity in these sources which could put strong constraints on the origin of the gas in ETGs. This work can also be useful in predicting metallicity independently from previously used (i.e. mainly optical) methods in other high metallicity environments such as galaxy centres, etc. Telescopes such as ALMA and the IRAM-30m telescope are amongst the most privileged instruments to use for this study since large backends are available, hence observing simultaneously several molecular lines of CS, HCN, etc is possible.
| ratio | C+/CS | C2H/CS | CN/CS | HCN/CS | HNC/CS | OCS/CS | CO/CS | C+/CO | C/CO | CN/CO | HCN/CO | HNC/CO | SO/CO | SO2/CO | H2O/CO | |
|---|---|---|---|---|---|---|---|---|---|---|---|---|---|---|---|---|
| A 1 mag | ||||||||||||||||
| Model 0 | 1.40(1) | 4.97(-1) | 3.98 | 5.57 | 3.44 | 4.10(-1) | 2.68(5) | 5.23(-5) | 3.70(-1) | 1.49(-5) | 2.08(-5) | 1.29(-5) | 5.79(-7) | 9.76(-10) | 1.41(-5) | |
| Model 8 | 2.87 | 2.10(-1) | 1.31 | 9.69 | 4.49 | 1.53 | 3.50(5) | 8.21(-6) | 2.50(-1) | 3.75(-6) | 2.77(-5) | 1.28(-5) | 2.58(-7) | 1.20(-9) | 6.47(-6) | |
| Model 12 | 3.15 | 3.00(-1) | 1.26 | 1.11(1) | 4.81 | 1.37 | 2.85(5) | 1.11(-5) | 4.20(-1) | 4.42(-6) | 3.91(-5) | 1.69(-5) | 1.96(-7) | 1.07(-8) | 5.17(-6) | |
| Model 19 | 2.76 | 1.00(-2) | 6.50(-1) | 1.29 | 5.50(-1) | 7.30(-1) | 2.32(5) | 1.19(-5) | 2.30(-1) | 2.81(-6) | 5.54(-6) | 2.39(-6) | 1.32(-6) | 9.98(-9) | 3.05(-5) | |
| A 3 mag | ||||||||||||||||
| Model 0 | 2.1(-2) | 1.02(-2) | 4.26(-2) | 3.14(-1) | 2.06(-1) | 2.06(-1) | 2.81(3) | 7.40(-6) | 1.23(-1) | 1.52(-5) | 1.12(-4) | 7.34(-5) | 4.29(-6) | 4.30(-7) | 9.56(-4) | |
| Model 8 | 5.07(-3) | 2.06(-4) | 9.33(-3) | 7.19(-1) | 3.29(-1) | 1.05 | 4.98(3) | 1.15(-6) | 5.23(-2) | 1.87(-6) | 1.44(-4) | 6.61(-5) | 1.67(-6) | 4.56(-7) | 5.42(-4) | |
| Model 12 | 4.71(-3) | 1.48(-4) | 7.50(-4) | 8.36(-1) | 3.52(-1) | 1.61 | 6.96(3) | 6.76(-7) | 4.19(-2) | 1.08(-6) | 1.20(-4) | 5.06(-5) | 1.29(-6) | 3.77(-7) | 3.55(-4) | |
| Model 19 | 1.37(-3) | 1.33(-6) | 6.20(-3) | 1.16(-2) | 5.23(-3) | 1.22(-1) | 7.55(2) | 1.81(-6) | 3.62(-2) | 8.21(-6) | 1.54(-5) | 6.92(-6) | 5.37(-5) | 2.91(-5) | 2.99(-3) | |
| A 5 mag | ||||||||||||||||
| Model 0 | 1.32(-3) | 5.83(-5) | 4.10(-3) | 4.52(-2) | 3.17(-2) | 8.68(-2) | 2.25(2) | 5.89(-6) | 9.54(-2) | 1.82(-5) | 2.01(-4) | 1.41(-4) | 8.38(-6) | 4.55(-6) | 7.31(-3) | |
| Model 8 | 3.54(-4) | 1.34(-5) | 5.62(-4) | 1.17(-1) | 5.71(-2) | 5.07(-1) | 3.26(2) | 1.09(-6) | 5.27(-2) | 1.72(-6) | 3.58(-4) | 1.75(-4) | 9.56(-7) | 2.03(-6) | 5.19(-3) | |
| Model 12 | 2.15(-4) | 7.23(-6) | 2.62(-4) | 1.19(-1) | 5.37(-2) | 7.21(-1) | 3.18(2) | 6.78(-7) | 4.61(-2) | 8.23(-7) | 3.72(-4) | 1.69(-4) | 2.35(-7) | 7.73(-7) | 3.88(-3) | |
| Model 19 | 6.27(-5) | 2.53(-9) | 6.60(-4) | 1.00(-3) | 8.01(-4) | 4.27(-2) | 5.39(1) | 1.16(-6) | 5.46(-3) | 1.23(-5) | 1.86(-5) | 1.49(-5) | 6.40(-4) | 2.13(-3) | 2.94(-2) | |
| A 8 mag | ||||||||||||||||
| Model 0 | 7.25(-4) | 2.50(-5) | 2.83(-3) | 2.23(-2) | 1.56(-2) | 4.75(-2) | 1.39(2) | 5.19(-6) | 7.28(-2) | 2.03(-5) | 1.60(-4) | 1.12(-4) | 1.58(-5) | 7.68(-6) | 8.66(-3) | |
| Model 8 | 2.58(-4) | 8.83(-6) | 5.92(-4) | 7.57(-2) | 3.64(-2) | 3.41(-1) | 2.56(2) | 1.01(-6) | 4.61(-2) | 2.31(-6) | 2.96(-4) | 1.42(-4) | 2.60(-6) | 4.68(-6) | 5.48(-3) | |
| Model 12 | 1.71(-4) | 5.80(-6) | 2.71(-4) | 9.20(-2) | 4.13(-2) | 5.50(-1) | 2.61(2) | 6.53(-7) | 4.33(-2) | 1.03(-6) | 3.51(-4) | 1.58(-4) | 7.71(-7) | 2.24(-6) | 4.68(-3) | |
| Model 19 | 3.59(-5) | 5.03(-11) | 7.78(-5) | 2.62(-4) | 1.93(-4) | 1.63(-2) | 3.48(1) | 1.03(-6) | 7.75(-4) | 2.23(-6) | 7.52(-6) | 5.53(-6) | 6.02(-3) | 1.68(-2) | 3.61(-2) | |
| A 20 mag | ||||||||||||||||
| Model 0 | 6.74(-4) | 2.05(-5) | 2.63(-3) | 2.11(-2) | 1.47(-2) | 3.61(-2) | 1.38(2) | 4.88(-6) | 6.20(-2) | 1.90(-5) | 1.55(-4) | 1.06(-4) | 1.89(-5) | 7.20(-6) | 8.53(-3) | |
| Model 8 | 1.65(-4) | 4.10(-6) | 6.02(-4) | 3.80(-2) | 1.76(-2) | 1.82(-1) | 1.91(2) | 8.64(-7) | 3.38(-2) | 3.14(-6) | 1.99(-4) | 9.21(-5) | 7.12(-6) | 9.41(-6) | 5.42(-3) | |
| Model 12 | 1.16(-4) | 2.97(-6) | 3.68(-4) | 4.83(-2) | 2.07(-2) | 3.03(-1) | 2.12(2) | 5.49(-7) | 3.17(-2) | 1.74(-6) | 2.27(-4) | 9.77(-5) | 3.93(-6) | 7.84(-6) | 4.63(-3) | |
| Model 19 | 3.37(-5) | 3.72(-11) | 4.15(-5) | 1.27(-4) | 4.91(-5) | 1.11(-2) | 3.27(1) | 1.03(-6) | 6.54(-4) | 1.27(-6) | 3.88(-6) | 1.50(-6) | 7.59(-3) | 1.63(-3) | 3.57(-2) |
Acknowledgments
EB would like to thank Prof. David Williams and Dr S. Kaviraj for useful comments, discussion and help during the preparation and redaction of this work. EB acknowledges the rolling grants ’Astrophysics at Oxford’ PP/EE/E001114/1 and ST/H504862/1 from the UK Research Councils and the John Fell OUP Research fund, ref 092/267. We also thank the referee for providing very useful comments which improved significantly the paper. TAB thanks the Spanish MICINN for funding support through grants AYA2009-07304 and CSD2009-00038. TAB is supported by a CSIC JAE-DOC research contract.
References
- Aladro et al. (2011) Aladro R., Martín-Pintado J., Martín S., Mauersberger R., Bayet E., 2011, A&A, 525, A89+
- Aller & Greenstein (1960) Aller L. H., Greenstein J. L., 1960, ApJS, 5, 139
- Asplund et al. (2009) Asplund M., Grevesse N., Sauval A. J., Scott P., 2009, Annu. Rev. A&A, 47, 481
- Bayet et al. (2009a) Bayet E., Aladro R., Martín S., Viti S., Martín-Pintado J., 2009a, ApJ, 707, 126
- Bayet et al. (2012) Bayet E., Bureau M., Davis T., Crocker A., 2012, MNRAS, in prep.
- Bayet et al. (2004) Bayet E., Gerin M., Phillips T. G., Contursi A., 2004, A&A, 427, 45
- Bayet et al. (2006) —, 2006, A&A, 460, 467
- Bayet et al. (2009b) Bayet E., Viti S., Williams D. A., Rawlings J. M. C., Bell T., 2009b, ApJ, 696, 1466
- Bayet et al. (2011) Bayet E., Williams D. A., Hartquist T. W., Viti S., 2011, MNRAS, 414, 1583
- Bell, Bayet & Viti (2012) Bell M. B., Bayet E., Viti S., 2012, MNRAS, in prep.
- Bell et al. (2006) Bell T. A., Roueff E., Viti S., Williams D. A., 2006, MNRAS, 371, 1865
- Bell et al. (2005) Bell T. A., Viti S., Williams D. A., Crawford I. A., Price R. J., 2005, MNRAS, 357, 961
- Combes, Young & Bureau (2007) Combes F., Young L. M., Bureau M., 2007, MNRAS, 377, 1795
- Crocker et al. (2011) Crocker A., Krips M., Bureau M., Young L. M., 2011, MNRAS, in prep.
- Davis et al. (2011a) Davis T. A. et al., 2011a, MNRAS, 417, 882
- Davis et al. (2012) Davis T. A., Bayet E., Bureau M., Viti S., 2012, MNRAS, in prep.
- Davis et al. (2011b) Davis T. A. et al., 2011b, MNRAS, 683
- Habing (1968) Habing H. J., 1968, Bul. of the Astron. Inst. of the Netherland, 19, 421
- Israel & Baas (2001) Israel F. P., Baas F., 2001, A&A, 371, 433
- Israel & Baas (2003) —, 2003, A&A, 404, 495
- Kaviraj et al. (2009) Kaviraj S., Devriendt J. E. G., Ferreras I., Yi S. K., Silk J., 2009, A&A, 503, 445
- Kaviraj et al. (2011) Kaviraj S. et al., 2011, ArXiv e-prints
- Krips et al. (2010) Krips M., Crocker A. F., Bureau M., Combes F., Young L. M., 2010, MNRAS, 407, 2261
- Kuntschner et al. (2010) Kuntschner H. et al., 2010, MNRAS, 408, 97
- Lequeux (1979) Lequeux J., 1979, RMxAA, 4, 325
- Martín et al. (2010) Martín S., Aladro R., Martín-Pintado J., Mauersberger R., 2010, A&A, 522, A62
- McDermid et al. (2011) McDermid R. et al., 2011, in Bulletin of the American Astronomical Society, Vol. 43, American Astronomical Society Meeting Abstracts 217, p. 422.04
- Meijerink et al. (2011) Meijerink R., Spaans M., Loenen A. F., van der Werf P. P., 2011, A&A, 525, A119+
- Omukai et al. (2005) Omukai K., Tsuribe T., Schneider R., Ferrara A., 2005, ApJ, 626, 627
- Origlia et al. (2004) Origlia L., Ranalli P., Comastri A., Maiolino R., 2004, ApJ, 606, 862
- Papadopoulos (2010) Papadopoulos P. P., 2010, ApJ, 720, 226
- Peletier (1989) Peletier R. F., 1989, PhD thesis, , University of Groningen, The Netherlands, (1989)
- Ranalli et al. (2003) Ranalli P., Origlia L., Maiolino R., Comastri A., 2003, in IAU Joint Discussion, Vol. 17, IAU Joint Discussion
- Röllig et al. (2007) Röllig M. et al., 2007, A&A, 467, 187
- Ryan, Norris & Bessell (1991) Ryan S. G., Norris J. E., Bessell M. S., 1991, Aj, 102, 303
- Sage & Welch (2006) Sage L. J., Welch G. A., 2006, ApJ, 644, 850
- Sage, Welch & Young (2007) Sage L. J., Welch G. A., Young L. M., 2007, ApJ, 657, 232
- Salaris & Weiss (1998) Salaris M., Weiss A., 1998, A&A, 335, 943
- Santoro & Shull (2006) Santoro F., Shull J. M., 2006, ApJ, 643, 26
- Schöier et al. (2005) Schöier F. L., van der Tak F. F. S., van Dishoeck E. F., Black J. H., 2005, A&A, 432, 369
- Thomas (1999) Thomas D., 1999, MNRAS, 306, 655
- Tumlinson (2007) Tumlinson J., 2007, ApJ, 665, 1361
- van der Tak et al. (2007) van der Tak F. F. S., Black J. H., Schöier F. L., Jansen D. J., van Dishoeck E. F., 2007, A&A, 468, 627
- van Dokkum & Conroy (2011) van Dokkum P. G., Conroy C., 2011, ApJ Letter, 735, L13
- Weiss et al. (2004) Weiss A., Schlattl H., Salaris M., Cassisi S., 2004, A&A, 422, 217
- Welch & Sage (2003) Welch G. A., Sage L. J., 2003, ApJ, 584, 260
- Young et al. (2011) Young L. M. et al., 2011, ArXiv e-prints