New Perspectives for Cuprate Research: (CaxLa1-x)(Ba1.75-xLa0.25+x)Cu3Oy Single Crystals
Abstract
We report the successful growth of a large (CaxLa1-x)(Ba1.75-xLa0.25+x)Cu3Oy (CLBLCO) single crystal. In this material, controls the maximum of (), with minimal structural changes. Therefore, it allows a search for correlations between material properties and . We demonstrate that the crystals are good enough for neutron scattering and cleave well enough for Raman scattering. These results open new possibilities for cuprate research.
Although high quality single crystals of cuprate superconductors have been available for quite some time, comparing the properties of different crystals often raised more questions than answers. The main problem is that many parameters differ between various cuprates simultaneously, and it is difficult to understand which material property is responsible for which physical property. A proper understanding of cuprate superconductivity can emerge only when it is possible to vary the material parameters one at a time preferably in single crystals. Here we describe the growth and characterization of large single crystals of a (CaxLa1-x)(Ba1.75-xLa0.25+x)Cu3Oy (CLBLCO) superconductor, in which it was previously demonstrated that the variable changes only the Cu-O-Cu buckling angle and bond distance, and hence the super-exchange OferPRB08 . We also demonstrate that experiments such as neutron scattering, Raman scattering, and more can be performed on these crystals.
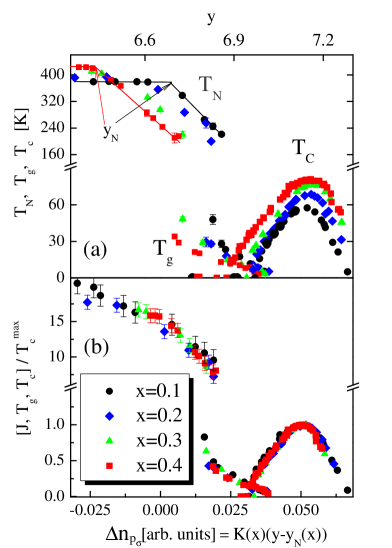
The phase diagram of CLBLCO for various values of and is presented in Fig. 1(a) AmitPRB10 . When varying , the amount of Lanthanum in the chemical formula remains constant, and therefore stands for the Calcium-to-Barium ratio. The parameter controls the oxygen level and moves the system between the different phases. At around each family has its maximum []. Changing from 0.1 to 0.4 varies from 58 K to 80 K Yaki99 ; roughly a 30% increase. This variation is achieved with no apparent structural changes.
All CLBLCO compounds have YBCO-like structure with two CuO2 planes and two disordered “chain” layers per unit cell. The symmetry is tetragonal for all values of and KellerPhysicaC89 . The level of disorder is also similar for all families KerenNJP09 . Therefore, a priori, there is no reason for to depend on . However, increasing increases the amount of the Ca2+ in the Y site of YBCO at the expense of La3+. This charge transfer is equivalent to reducing the positive charge on the (YBCO) Y site and increasing it on the (YBCO) Ba site, and could alter the Cu-O-Cu buckling angle. Indeed, it was found by high resolution neutron diffraction that as increases the Cu-O-Cu bond becomes shorter and straighter OferPRB08 , while other structural properties remain intact KerenNJP09 . The bond length and buckling are the major factors that control the orbital overlap and, in turn, the hopping parameter or the super-exchange . Thus, the newly grown CLBLCO crystal can shed new light on the impact of or on properties such as: , the structure of the Fermi surface, the magnetic resonance, the size of the gap/pseudogap, and more.
For example, early muon spin rotation (SR) measurements using compressed CLBLCO powder samples in the anti-ferromagnetic phase, combined with theoretical calculations, revealed that is -dependent, as expected, and that OferPRB06 . Similarly, NMR established that simple valence counting does not represent the true doping of the CuO2 planes and that a doping efficiency parameter should be introduced; the number of holes in the oxygen 2pσ orbital is given by where is defined in Fig. 1(a) AmitPRB10 . Interestingly, when plotting , , and normalized by as a function of a unified phase diagram is generated, as depicted in Fig. 1(b) OferPRB06 ; AmitPRB10 .
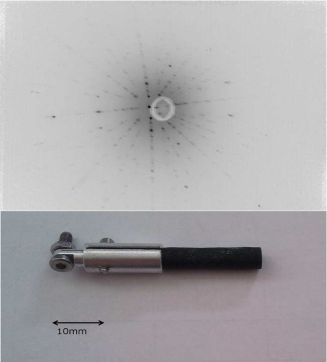
However, SR is not a direct probe of and more profound work is needed to clarify the relation between the superconducting and magnetic energy scales. Inelastic neutron or Raman scattering are more appropriate for direct determination. Equally, NMR does not measure the Fermi surface size directly and a proper ARPES measurement is needed. These advanced measurements require large single crystals with specific orientation or high quality surfaces. Here we report the production of such crystals by the Traveling Solvent Floating Zone method. Details of the growth and characterization are given in the Appendix material. An optical image and a Laue diffraction pattern of one of the crystals are shown in Fig. 2. We also demonstrate the applicability of several experimental techniques to these crystals. It should be pointed out that small crystals were grown before but only their chemical properties where analyzed Noji99 .
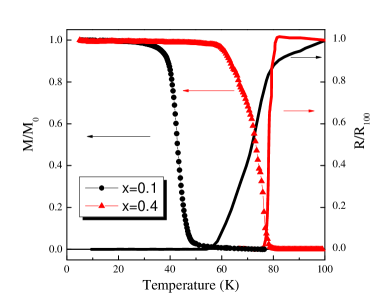
The bulk superconducting properties of this crystal were tested by transport and magnetization measurements. The and crystals are cut into a rectangular shape and post-annealed in oxygen to achieve optimal doping. The is annealed at a temperature of 300 C∘ and ambient pressure for hr. The is annealed at a temperature of C∘ and a pressure of bar for hr. Figure 3 shows normalized resistivity and normalized susceptibility. We found that and K for and respectively, which is in perfect agreement with powder sample measurements. is defined as the temperature where the resistivity vanishes upon cooling or the susceptibility vanishes upon warming. The transition into the superconducting state of the crystal is wide. It spans K in the susceptibility measurement and K in the resistivity measurement. This is probably due to very small traces of high values. The transition of the crystal is sharp in both susceptibility and resistivity measurements. Nevertheless, there are clear variations in between optimally doped crystal with different values. The superconducting volume fraction extracted from the magnetization measurement is approximately 100%.
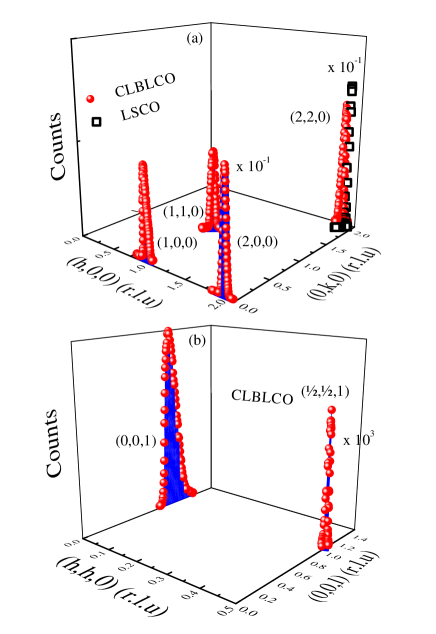
The most demanding requirements from single crystals are those of the neutron scattering experimental technique. For this technique the crystals must be of the order of 10 gr. To check the applicability of neutron scattering to our crystal we use the ORION beam-line at PSI, Switzerland. This beam-line provides neutrons with a wavelength of . The crystal is kept at room temperature. Using an (h,k,0) scan and the YBCO structure parameters taken from ISCD’s “Lazy Pulverix” website, we detect the (100), (200), (110), (220) nuclear Bragg peaks as presented in Fig. 4(a). For comparing crystal qualities we also present the strongest LSCO nuclear Bragg peak, namely, the (220) from a sample of equal size. The intensity of the strongest LSCO peak, (2,2,0), and the strongest CLBLCO peak, (2,0,0), is similar.
In Fig 4(b) we show neutron scattering data acquired on the MORPHEUS beam-line. This beam line has a higher flux and a wavelength of which enables us access to the first allowed magnetic Bragg peak of CLBLCO. Indeed, using an (h,h,l) scan we are able to detect the nuclear and the magnetic Bragg peaks of our CLBLCO crystal as well. The magnetic peak intensity in the figure is multiplied by for clarity.
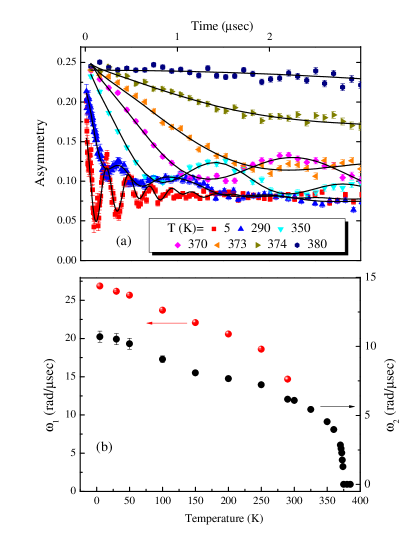
We also check the major magnetic properties of our crystal by performing a ZF-SR experiment, at PSI, Switzerland. Figure 5(a) shows the SR asymmetry data of an crystal by symbols, and the fit of the function
| (1) |
to the data by solid lines. Here is fixed at , and and stand for high and low frequencies, respectively. The two frequencies extracted from the fit are presented in Fig 5(b). They result from two different muon sites, common to most cuprates. Above 300 K the two frequencies merge into one. The Néel temperature is determined from the limit giving K, which is the same as the powder sample.
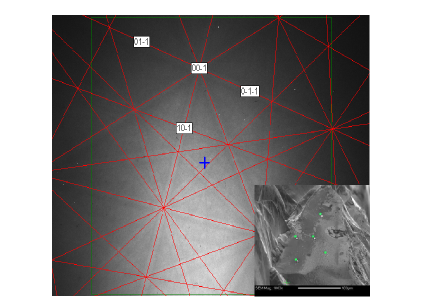
For a variety of experimental techniques having single crystals is insufficient; these crystals must also cleave with high quality exposed surfaces. To test this requirement, we cleave one of our samples and examine the surface by a scanning electron microscope (SEM) equipped with an electron backscatter diffraction module (EBSD). A SEM micrograph taken at an acceleration voltage of 25 kV is shown in the inset of Fig. 6. A 100x200 crystal facet is clearly visible. The EBSD diffraction patterns from one point on the surface is shown in Fig. 6. Clear Kikuchi lines can be seen in the diffraction kikichi . A fit to the expected Kikuchi lines from the YBCO structure is also presented. The patterns reveal that the surface of the facet is perpendicular to the crystal -axis. We repeat the EBSD measurements at all the (green) points in the inset, and find the same Kikuchi pattern. This indicates that all points share the same crystal orientation and that the surface is perpendicular to the crystallographic -axis. This finding is also confirmed by the Raman scattering experiment described below.
Raman spectra of an under- and optimally doped CLBLCO samples are shown in Fig 7. The samples are freshly cleaved and cooled in an evacuated cryostat to K. One surface is shown in the inset of Fig 7. The spectra are obtained by a Jobin-Yvon micro-Raman spectrometer (LabRam-HR 800) with a nm solid state laser and a power of less than 1 mW to avoid overheating. The laser is focused by a microscope objective lens with 50 magnification to a spot of about 10 diameter. The scattered light is collected in backscattering geometry and dispersed by a diffraction grating with 1800 grooves/mm onto a liquid nitrogen cooled CCD array. Polarized Raman spectra are obtained with a Polaroid polarizer and analyzer placed after the laser and before the grating.
Since CLBLCO belongs to the tetragonal space group , symmetry analysis bilbao yields Raman active optical phonons for scattering in the plane. In polarization (i.e. both polarizer and analyzer rotated by 45∘ from the crystallographic axis), only phonons are allowed, while in polarization (with the analyzer set perpendicular to the polarizer and 45∘ from the crystallographic axis) only phonons are allowed. In the underdoped crystal, four of the five phonons are clearly observed at 145, 298, 423, 446 . The fifth optical phonon is either at 209 where a very shallow peak is observed, or it overlaps with the multi-phonon peaks starting around 500 . For comparison, YBCO6 has five phonons phononofYBCO at about 140, 230, 335,435, 500 .
Using the rotational anisotropy of the 298 phonon with respect to the electric field, the and direction of the crystal are found. The center inset of Fig. 7 shows the phonon intensity as a function of the polarizer angle from . The crystal direction are depicted on the cleave surface in Fig. 7.
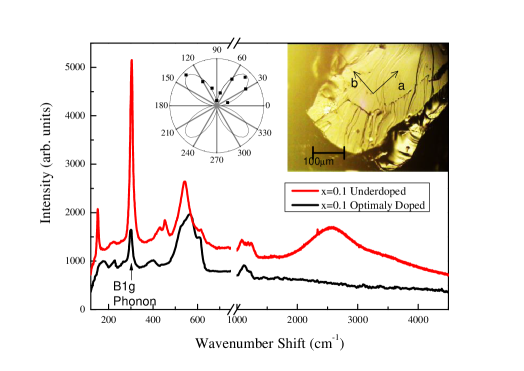
Another feature of the underdoped crystal, common to all cuprates, is the broad peak centered at . This peak is attributed to two-magnon scattering. The Heisenberg exchange constant is roughly given by K CanaliPRB92 . This estimation is in good agreement with the SR data given in Fig. 1(a) and (b); for the most underdoped sample, we have and K, giving K. Achieving a better agreement between the two values requires further investigations. Finally, the two-magnon peak is absent from the spectrum of the optimally doped crystal due to an overdamping of the spin excitations, which is also depicted in Fig 7; the spectra are shifted in intensity for clarity.
Our data indicate that CLBLCO can be grown as large single crystals. The crystals are large enough for neutron scattering. The crystals are cleavable, giving high quality surfaces, which make them suitable for surface probes. Within the realm of our experiments, the crystals have the same properties as the original powder. These properties, combined with the unique phase diagram of CLBLCO open new perspectives for cuprate research.
Acknowledgments: One of us (AK) would like to thank John Tranquada and Genda Gu for a two month visit to their lab and excellent tutorial on single crystal growth, and to Kazimierz Conder and Ekaterina Pomjakushina for helpful discussion. This research was funded by the Israeli Science Foundation and the ESF.
I Appendix
The crystals are grown using a Crystal System Corp. optical furnace (FZ-T-4000-H) equipped with four parabolic mirrors and 300W lamps. CLBLCO powder is first prepared using solid state reaction from stoichiometric proportions of La2O3 (99.99%), CaCO3 (99.9%), BaCO3 (99.9%) and CuO(99%). The starting materials are mixed, calcined, and ground repeatedly at 900, 925, 950, 950 C∘ for 24 hours, then tested for impurities using XRD. The CLBLCO powder is then packed into rubber tubes and hydrostatically pressed at 400 MPa, producing 15-20 cm 7 mm cylindrical rods. The density of the rods reaches more than 90% after sintering them at 1040 C∘ for 24 hours ensuring stable uninterrupted growth. The growth is carried out at a rate of 0.35 mm/h in argon atmosphere with 0.05-0.1% oxygen, with both feed and seed rotating in opposite directions at 15 rpm. The growth lasts up to 10 days resulting in 50-100 mm long crystals. The grown crystals are annealed in argon at 850 C∘ for 120 hours to relieve thermal stress, and, when needed, to remove excess oxygen for magnetic measurement (SR and elastic neutron scattering). It is important to mention that we do not find any traces of copper on the furnace quartz tube as usually happens with LSCO growth. Therefore, we do not add any excess copper to the initial powder.
We also perform Inductively-coupled plasma atomic-emission spectroscopy (ICP-AES)ICP measurements on the crystals and the starting powders. For ICP we prepare 10 test tubes with the 100 mg of crystal dissolved in ”Trace Select” grade Nitric Acid, as well as 5 test tubes of the starting powder. ICP allows us to measure the molar ratio of Ca, Ba, and La to Cu in the mixture. Knowing that we have 3 Cu atoms per unit cell, we found Ca , Ba and La atoms per unit cell in the powder case. The nominal values should be Ca , Ba and La . This sets the sensitivity of the ICP technique. For the crystal we find that Ca , Ba and La atoms per unit cell. Therefore, there is no difference in the Ca, Ba, or La content, between the crystals and powders within the accuracy of the measurement.
References
- (1) R. Ofer, A. Keren, O. Chmaissem, and A. Amato, Phys Rev. B 78, 140508(R) (2008).
- (2) E. Amit and A. Keren, Phys. Rev. B 82, 172509 (2010).
- (3) D. Goldschmidt, G. M. Reisner, Y. Direktovitch, A. Knizhnik, E. Gartstein, G. Kimmel, and Y. Eckstei, Phys. Rev B 48, 532 (1993); A. Kniznik, Y. Direktovich, G. M.Reisner, D. Goldschmidt, C.G. Kuper and Y. Eckstein Physica C 321, 199, (1999).
- (4) F. Keller-Berest, S. Megtert, G. Collin, P. Monod, and M. Ribault, Physica C 161, 150 (1989).
- (5) A. Keren, New J. Phys. 11 065006 (2009).
- (6) R. Ofer, G. Bazalitsky, A. Kanigel, A. Keren, A. Auerbach, J. S. Lord, and A. Amato, Phys. Rev. B 74, 220508(R) (2006).
- (7) Noji T, Akagawa H, Oikawa T, Ono Y, Koike Y ,JLTP 117, 705 (1999). Noji T, Akagawa H, Ono Y, Koike Y, JLTP 131, 699 (2003). C. Chen et al., JMS - Materials in Electornics 10, 581-584 (1999).
- (8) T. Maitland and S. Sitzman, ”Scanning Microscopy for Nanotechnology”, p. 41-75, (2007).
- (9) E. Kroumova, M. I. Aroyo, J. M. Perez Mato, A. Kirov, C. Capillas, S. Ivantchev H. Wondratschek. Phase Transitions (2003), 76, Nos. 1-2, 155-170.
- (10) D. M. Krol, M. Stavola, W. Weber, L. F. Schneemeyer, J. V. Waszczak, S. M. Zahurak, and S. G. Kosinski, Phys. Rev. B 36, 8325 (1987), C. Thomsen, R. Liu, M. Bauer, A. Wittlin, L. Genzel, M. Cardona, E. Schönherr, W. Bauhofer, and W. König, Solid State Comm. 65, 55 (1988).
- (11) W. H. Weber and G. W. Ford, Phys. Rev. B 40, 6890, (1989); C.M. Canali and S.M. Girvin, Phys. Rev. B 45, 7127 (1992).
- (12) Steve J. Hill, Inductively Coupled Plasma Spectrometry and its Applications, 2nd Edition, (2007).