A new infrared color criterion for the selection of AGN: application to deep fields and implications for JWST surveys.
Abstract
It is widely accepted that observations at mid-infrared (mid-IR) wavelengths enable the selection of galaxies with nuclear activity, which may not be revealed even in the deepest X-ray surveys. Many mid-IR color-color criteria have been explored to accomplish this goal and tested thoroughly in the literature. Besides missing many low-luminosity active galactic nuclei (AGN), one of the main conclusions is that, with increasing redshift, the contamination by non-active galaxies becomes significant (especially at ). This is problematic for the study of the AGN phenomenon in the early Universe, the main goal of many of the current and future deep extra-galactic surveys. In this work new near- and mid-IR color diagnostics are explored, aiming for improved efficiency — better completeness and less contamination — in selecting AGN out to very high redshifts. We restrict our study to the James Webb Space Telescope wavelength range (0.6–27 m). The criteria are created based on the predictions by state-of-the-art galaxy and AGN templates covering a wide variety of galaxy properties, and tested against control samples with deep multi-wavelength coverage (ranging from the X-rays to radio frequencies). We show that the colors , , and are ideal as AGN/non-AGN diagnostics at, respectively, , , and . However, when the source redshift is unknown, these colors should be combined. We thus develop an improved IR criterion (using and IRAC bands, KI) as a new alternative at . KI does not show improved completeness (50–60% overall) in comparison to commonly used IRAC-based AGN criteria, but is less affected by non-AGN contamination (revealing a 50–90% level of successful AGN selection). We also propose KIM (using , IRAC, and MIPS-24 m bands, KIM), which aims to select AGN hosts from local distances to as far back as the end of reionization () with reduced non-AGN contamination. However, the necessary testing-constraints and the small control-sample sizes prevent the confirmation of its improved efficiency at . Overall, KIM shows a 30–40% completeness and a 70–90% level of successful AGN selection. KI and KIM are built to be reliable against a 10–20% error in flux, are based on existing filters, and are suitable for immediate use.
Subject headings:
galaxies: active; galaxies: high-redshift; Infrared: galaxies1. Introduction
The active galactic nucleus (AGN) phenomenon in galaxies is currently the focus of a substantial amount of attention, due to its role in altering the path of galaxy evolution (e.g., Granato et al., 2004; Springel et al., 2005; Croton et al., 2006; Hopkins et al., 2006; Bower et al., 2006; Somerville et al., 2008). The quest to find these sources and the techniques used in identifying them are constantly shaping our understanding of the underlying physics of AGN, which are currently believed to be the result of mass accretion onto super massive black holes at the very centre of galaxies (e.g., Laor, 1999; Melia & Falcke, 2001). To identify AGN, a miriad of techniques have been developed, spanning essentially the full electromagnetic spectrum (e.g., X-rays, Szokoly et al. 2004; optical, Richards et al. 2002; infrared, see references below; radio, Tielens et al. 1979; Chambers et al. 1996).
A wide variety of both intrinsic and observational effects, make the identification of large, statistically robust, but also complete and reliable, populations of AGN galaxies challenging. Such effects encompass obscuration, accretion rate, variability, host galaxy light, viewing angle, and more. Different aspects of AGN radiation may be observed across the entire electromagnetic spectrum (from direct light at high energies to synchrotron radiation dominating at radio frequencies, Treister & Urry, 2011). It is common, though, to observe and analyze aspects of AGN activity limited to only one spectral regime. This has been verified in extreme radio sources (Afonso et al., 2006; Simpson et al., 2006; Morganti et al., 2011; Norris et al., 2011) and in some X-ray sources (e.g., Loewenstein et al., 2001; Ho et al., 2003; Maiolino et al., 2003; Polletta et al., 2006). These specific sources, show an ultraviolet-to-infrared spectrum with no evidence for AGN activity, and some of these AGN may not even present any counterpart at those wavelengths (as a result of, for instance, extreme obscuration). Even more generally, there is strong evidence for a large population of obscured AGN, which still remain unidentified at high-energy spectral-bands (e.g., Comastri et al., 2001; Ueda et al., 2003; Gilli, 2004; Worsley et al., 2004, 2005; Treister & Urry, 2005; Martínez-Sansigre et al., 2005; Draper & Ballantyne, 2009). If large dust column densities are the driver for such extreme obscuration (instead of just gas), then infrared (IR) wavelengths, at which the obscuring dust emits, are an obvious choice in the search for such extreme objects.
Based on data from the Infrared Astronomical Satellite (IRAS, Neugebauer et al., 1984), de Grijp et al. (1985) and Miley et al. (1985) realized that simple spectral-index or color-color diagnostics could be efficient ways to select Seyfert- and QSO-type galaxies. More recently, with the launch of Spitzer (Werner et al., 2004), the same techniques were applied at the shorter wavelengths (m) of the Infrared Array Camera (IRAC, Fazio et al., 2004), where hotter dust temperatures are probed. Lacy et al. (2004), Hatziminaoglou et al. (2005), and Stern et al. (2005) proposed different IRAC color-color plots to select AGN (see also Sajina et al., 2005), while Alonso-Herrero et al. (2006) and Donley et al. (2007) proposed spectral-index diagnostics to select sources revealing power-law () spectral energy distributions (SEDs) characteristic of AGN (Neugebauer et al., 1979; Elvis et al., 1994; Ivezić et al., 2002). Later, by comparison of the optical spectral regime with IR wave-bands, other techniques were proposed. Either through SED fitting (Daddi et al., 2007) or extreme color cuts at different 24 m fluxes (Polletta et al., 2008; Dey et al., 2008; Fiore et al., 2008; Donley et al., 2010), the selected galaxies are too red and bright for a normal star-forming SED, and hence indicative of AGN activity.
However, some critical shortcomings have been highlighted specially regarding the IRAC color-color AGN selection technique (e.g., Barmby et al., 2006; Donley et al., 2008; Eckart et al., 2010; Donley et al., 2012). Having been developed based on the shallow first generation IRAC surveys, these techniques fail in deeper IRAC surveys, where higher redshift non-AGN sources pollute the adopted selection criteria (Barmby et al., 2006; Papovich et al., 2006; Donley et al., 2008; Messias et al., 2010; Donley et al., 2012). Also, this technique is strongly biased against selecting low-luminosity AGN (Treister et al., 2006; Cardamone et al., 2008; Donley et al., 2008; Eckart et al., 2010; Petric et al., 2011; Donley et al., 2012), an evolutionary phase where AGN are believed to spend most of their life span (e.g., Hopkins et al., 2005, 2006; Fu et al., 2010). Furthermore, while the IR selection techniques return a variety of AGN populations, there seems to be a bias toward the selection of unobscured over obscured sources (Stern et al., 2005; Donley et al., 2007; Cardamone et al., 2008; Eckart et al., 2010), which, strikingly, is the opposite of the goal that drives IR AGN selection in the first place.
More recently, alternative diagnostics have been proposed either tuned to specific samples (e.g., Garn et al., 2009; Messias et al., 2010; Donley et al., 2012), or to newly available filter sets (Assef et al., 2010), or in combination with other techniques (Richards et al., 2009; Edelson & Malkan, 2012). Such work is crucial and the quest for revised and/or improved color-color criteria should continue, as it is important to identify key filter sets in order to maximize survey efficiency, as well as current (e.g., Salvato et al., 2009, 2011; Hainline et al., 2011; Pozzi et al., 2012) and future SED fitting procedures aiming to break down the strong degeneracy between AGN and non-AGN SEDs.
In this work, we explore new IR color selections with the goal to achieve improved efficiency (better completeness and less non-AGN contamination). In Section 2 different possibilities for the mechanisms behind the IR emission are discussed, and the new criteria are presented in Section 3. A series of tests of these new criteria are explored in Section 4 using a broad set of deep multi-wavelength control samples (selected at wavelengths ranging from X-ray to radio). Implications for and expectations from James Webb Space Telescope (JWST) surveys are highlighted in Section 5, followed by the conclusions of this work in Section 6.
Throughout this paper we use the AB magnitude system111When necessary the following relations are used: (K, [3.6], [4.5], [5.8], [8.0])AB = (K, [3.6], [4.5], [5.8], [8.0])Vega + (1.841, 2.79, 3.26, 3.73, 4.40) (Roche et al., 2003, and http://spider.ipac.caltech.edu/staff/gillian/cal.html)., assuming a CDM model with H km s-1 Mpc-1, , .
2. Distinguishing AGN from non-AGN IR contributions
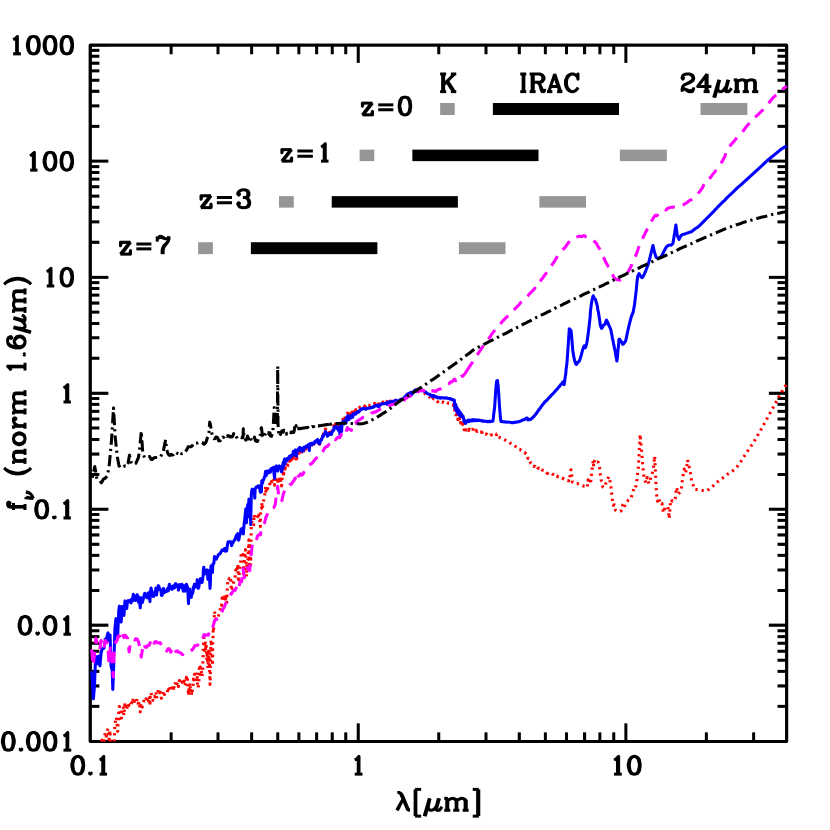
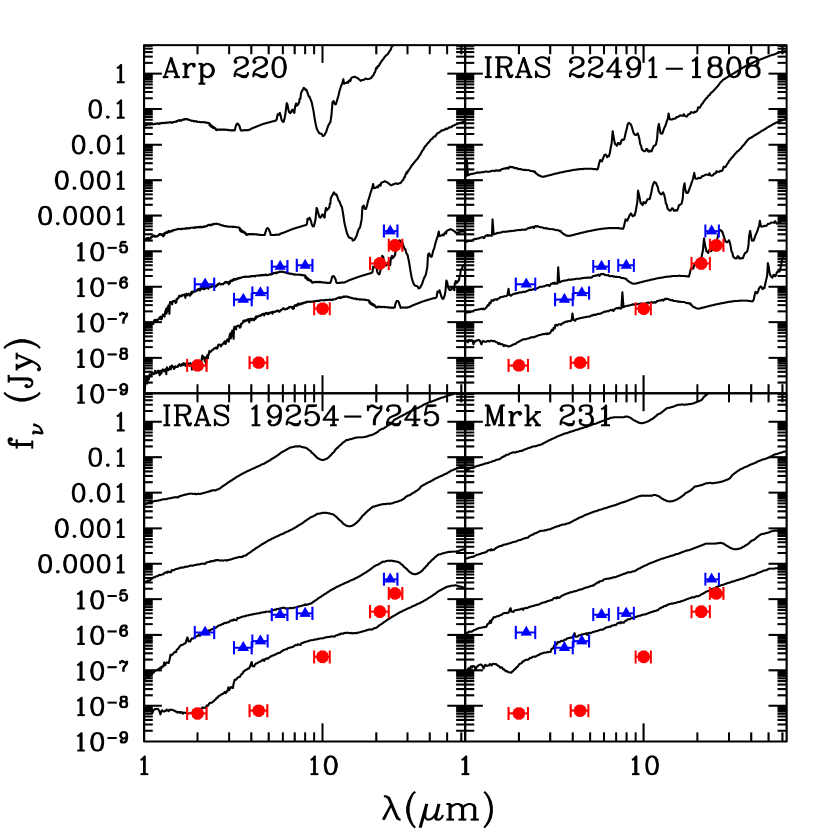
The SEDs of stellar and/or star-formation (SF) dominated systems (henceforth referred to as normal galaxy SEDs) have some distinctive characteristics, allowing the separation of this population from AGN host galaxies through the use of IR colors alone. Figure 1 illustrates a few examples using galaxy templates taken from the SWIRE Template Library (Polletta et al., 2007). In normal galaxy SEDs, a dip in the 1–6 m rest-frame range is expected. The overall blackbody emission from the stellar population combined with the minimum in the opacity of the H- ion in stellar photospheres, peaks at m, which is generally observed, as is the CO absorption at 2.35–2.5 m from red supergiants. Emission from hot dust surrounding stars in the asymptotic giant branch (AGB) phase is expected in young systems (Gyr) and to peak at m (Sajina et al., 2005; Maraston, 2005; Henriques et al., 2011). Furthermore, the strength of the polycyclic aromatic hydrocarbons (PAH) features, seen mostly beyond 6 m, increases with star formation activity and metallicity (Calzetti et al., 2007; Engelbracht et al., 2008; Hunt et al., 2010). It is in this spectral region (1–6 m) that the difference between normal galaxies and AGN dominated SEDs is the greatest. The existence of an AGN is frequently accompanied by a power-law continuum (, e.g., Neugebauer et al., 1979; Elvis et al., 1994; Ivezić et al., 2002) rising in flux beyond m. This is a consequence of X-ray-to-optical AGN radiation being reprocessed to IR wavelengths by dust surrounding the central region of an active galaxy (Sanders et al., 1989, 1999; Pier & Krolik, 1992). This feature, being different from the dip observed in normal galaxy SEDs, is unique for AGN hosts and enables their selection through SED inspection.
2.1. The template set
The templates used throughout this paper come from published work as follows: 10 templates covering early to late galaxy types, five starbursts, four hybrids222By hybrids we refer to SEDs simultaneously including stellar/SF and AGN emission., and six AGN, all from Polletta et al. (2007); nine starburst Ultra-Luminous IR Galaxies (ULIRGs) from Rieke et al. (2009); one blue starburst and 18 hybrid SEDs from Salvato et al. (2009); and one extremely obscured hybrid from Afonso et al. (2001).
All templates have been fully characterized in the papers which introduce them (see above). We assume that they sample adequately the color- space, based on the results by Salvato et al. (2009, 2011). In these works, the templates above (except those from Afonso et al. 2001, and Rieke et al. 2009) were used to compute reliable photometric redshift estimates (reaching an accuracy of , where ) for both bright, nearby objects and faint, high- sources (). By further adopting the models from Afonso et al. (2001) and Rieke et al. (2009), the whole template set aims to account for a wide range of mixtures between star-formation and AGN emission in galaxy SEDs and their evolution across cosmic time, as evidenced by observations (e.g., Farrah et al., 2007; Papovich et al., 2007; Rigby et al., 2008; Pope et al., 2008; Fiore et al., 2008; Donley et al., 2010; Fu et al., 2010; Elbaz et al., 2011). This is a valid assumption given that local templates are successful in fitting some of the most extreme high redshift sources (for instance, the case of Arp220 as a local analog of HR10, an extremely red galaxy at , Hu & Ridgway 1994 and Elbaz et al. 2002, or M82 as an analog for star-formation dominated sub-millimeter galaxies, Pope et al. 2008).
Five ULIRGs (IRAS sources 12112+0305, 14348-1447, 17208-0018, 20551-4250, and 22491-1808) which were previously considered as pure-starbursts in the literature, are labelled as hybrid sources in this work. This is based on the findings by Veilleux et al. (2009) and the review by Sani & Nardini (2011), where IR spectroscopy is shown to reveal significant AGN contribution (6–30% at 8–1000 m, 8–40% at 5–8 m) in these ULIRGs.
Table 1 lists the adopted template set. The SED templates are organized in four groups: (a) Early to Late-type galaxies, (b) Starbursts, (c) Hybrids, and (d) AGN. The following investigation will focus on how these groups populate near-to-mid IR color-color spaces, aiming to separate the AGN/Hybrid population, (c) and (d) above, from normal galaxies, i.e., (a) and (b).
| Class | template | RefaaReference work from which the template was retrieved, and, if present, reference work revealing the presence of hidden or non-dominant AGN (right column): [1] Afonso et al. (2001), [2] Polletta et al. (2007), [3] Salvato et al. (2009), [4] Rieke et al. (2009), [5] Veilleux et al. (2009), [6] Sani & Nardini (2011). |
|---|---|---|
| Early/Late | Ell13 | [2] |
| Ell2 | ” | |
| Ell5 | ” | |
| S0 | ” | |
| Sa | ” | |
| Sb | ” | |
| Sc | ” | |
| Sd | ” | |
| Sdm | ” | |
| Spi4 | ” | |
| Starburst | M82 | [2] |
| Arp 220 | ” | |
| NGC 6090 | ” | |
| ESO 0320-g030 | [4] | |
| NGC 1614 | ” | |
| NGC 2369 | ” | |
| NGC 3256 | ” | |
| NGC 4194 | ” | |
| Zw049.057 | ” | |
| CB1_0_LOIII4 | [3] | |
| Hybrid | IRAS 12112+0305 | [4,5] |
| IRAS 14348-1447 | ” | |
| IRAS 17208-0018 | ”bbVeilleux et al. (2009) do not present results for IRAS 17208-0018 specifically, but Rieke et al. (2009, the work where that template comes from) use Spitzer-IRS spectroscopy on IRAS 22491-1808 (studied by Veilleux et al., 2009) to complete ISO observations on IRAS 17208-0018, invoking similarities between the two in the 5–11 m range, where the analysis by Veilleux et al. (2009) is done. | |
| IRAS 22491-1808 | [2,5] | |
| IRAS 20551-4250 | [2,6] | |
| IRAS 19254-7245 | ” | |
| NGC 6240 | ” | |
| Seyfert 2.0 | ” | |
| Seyfert 1.8 | ” | |
| ERO | [1] | |
| pl_I22491_10_TQSO1_90 | [3] | |
| pl_I22491_20_TQSO1_80 | ” | |
| pl_I22491_30_TQSO1_70 | ” | |
| I22491_40_TQSO1_60 | ” | |
| I22491_50_TQSO1_50 | ” | |
| I22491_60_TQSO1_40 | ” | |
| I22491_70_TQSO1_30 | ” | |
| I22491_80_TQSO1_20 | ” | |
| I22491_90_TQSO1_10 | ” | |
| S0_10_QSO2_90 | ” | |
| S0_20_QSO2_80 | ” | |
| S0_30_QSO2_70 | ” | |
| S0_40_QSO2_60 | ” | |
| S0_50_QSO2_50 | ” | |
| S0_60_QSO2_40 | ” | |
| S0_70_QSO2_30 | ” | |
| S0_80_QSO2_20 | ” | |
| S0_90_QSO2_10 | ” | |
| AGN | Mrk 231 | [2] |
| BQSO1 | ” | |
| QSO1 | ” | |
| TQSO1 | ” | |
| QSO2 | ” | |
| Torus | ” |
3. The new approach
3.1. An enhanced wedge diagram: the KI criterion
In Figure 2 the color tracks (spanning the range ) for the template SEDs considered are presented on the L07 (left plot) and S05 (right plot) criteria color-color spaces. The criterion recently proposed by Donley et al. (2012, D12 henceforward) is also shown in the L07 color-color space, with the caveat that the D12 criterion requires a monotonically increasing red SED in addition to the color cuts shown in the figure. These criteria consider the 3.6–8.0 m observed-frame (the IRAC-frame) to select AGN candidates. This is the spectral range where AGN-dominated SEDs are better distinguishable from normal galaxy SEDs at rest-frame wavelengths, meaning that redshift will play a role in the selection efficiency. In both color-color spaces, the nominal AGN regions encompass most of the AGN and hybrid tracks for a large range of redshifts, as they were built to do (the D12 criterion focus only on the most SED-dominant AGN).
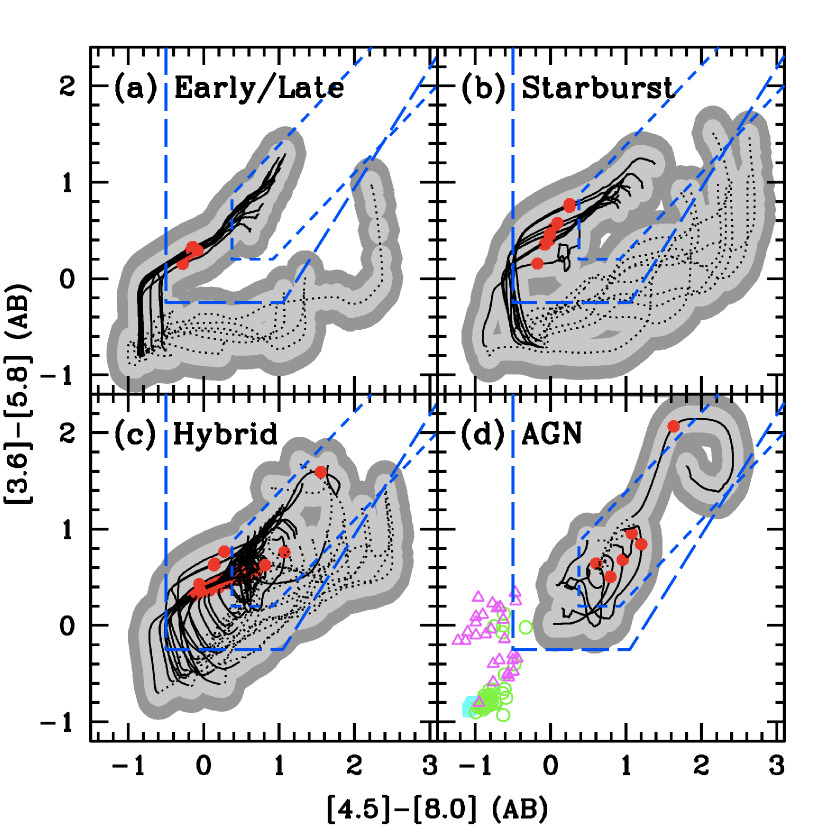
We note, however, that the use of a very diverse SED template set already shows some shortcomings of these diagnostic plots. In both plots, the two upper panels (early/late and starburst galaxies) show a significant contamination of the nominal AGN region of L07 and S05 (and D12 to a smaller degree) by normal (non-AGN) galaxies. Each criterion is differently affected at different redshifts. Even when ignoring photometric scatter (shaded regions in the figures), one observes non-AGN contamination in at least one criterion throughout the whole range. This has been noted by previous studies testing the L07, S05, and D12 criteria (Barmby et al., 2006; Donley et al., 2008; Cardamone et al., 2008; Donley et al., 2012), but it is also found for other IR techniques at higher redshifts (; e.g., Pope et al., 2008; Donley et al., 2008, 2010; Fadda et al., 2010; Narayanan et al., 2010). While at low-redshifts (), the contamination is due to strong PAH emission as well as extreme obscuration differently affecting each IRAC channel, at higher redhifts (), the contamination is mostly driven by the limitation in observed wavelengths (the IRAC frame, ). At these redshifts, IRAC bands mostly probe the rest-frame m, where obscured star-forming systems (frequently identified at those redshifts) present red colors mimicking those of AGN. The clear implication is that any AGN criteria restricted to the IRAC-frame will never be able to disentangle AGN from non-AGN populations at . In Figure 2, the highest redshift where non-AGN templates are restricted to lying outside the S05 and D12 selecting regions is . At higher redshifts, L07, S05, and D12 are all contaminated to the same degree. At , the D12 criteria is the least contaminated (as shown in Donley et al., 2012), but being restricted to such a narrow color-color space, it will miss a significant number of low- and intermediate-luminosity AGN (). In addition, cool dwarf stars may fall inside or close to the L07 and S05 regions, thus being potential (point-like) contaminants.
In order to enhance these wedge diagrams, one can extend the wavelength coverage to different wavebands. This is obviously outside the IRAC framework behind the original definition of such wedge diagrams, but suits the larger JWST wavelength coverage. For instance, by considering shorter wavelengths (m), one is probing a spectral region mostly dominated by stellar emission333However, AGN emission may also dominate at such short IR wavelengths. See, for example, Assef et al. (2011), Hainline et al. (2011). (see Figure 1). Such a scenario is an advantage as we now compare a stellar dominated wave-band with one at longer wavelengths (e.g., the IRAC-frame) that has contribution either from stellar or AGN light. Such a comparison will yield a large color dispersion, which is ideal for the separation of the two types of systems.
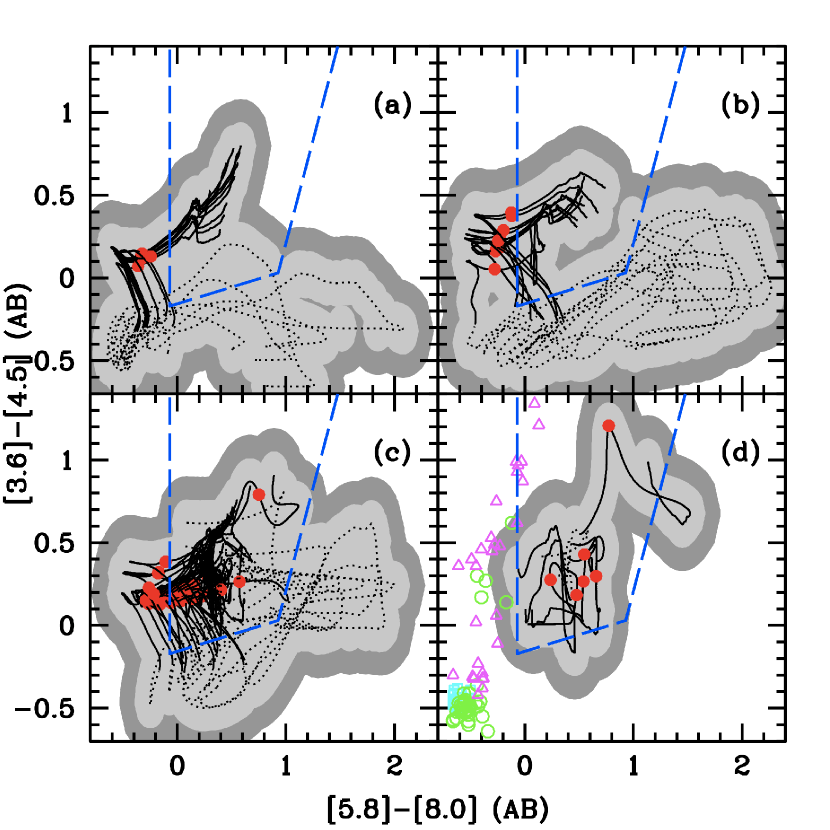
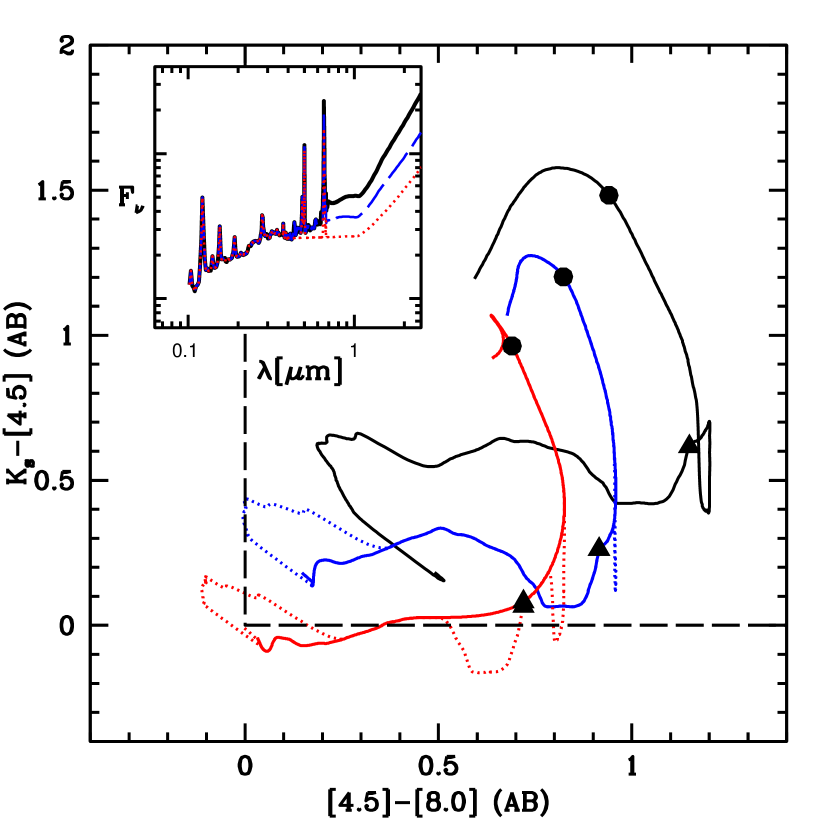
A particularly relevant combination of colors is versus (Figure 3). This +IRAC combination, henceforth called the KI criterion, is defined by the following simple conditions:
and
These color cuts result from a balance between rejecting the non-AGN 10–20% photometric scatter regions at and encompassing the pure-AGN color tracks and respective photometric scatter regions. Using a wide variety of templates and taking into account photometric errors we aim to limit possible selection effects resulting from wedges created a posteriori, for example, by using a sample of AGN spectroscopically confirmed such as in L07 and S05.
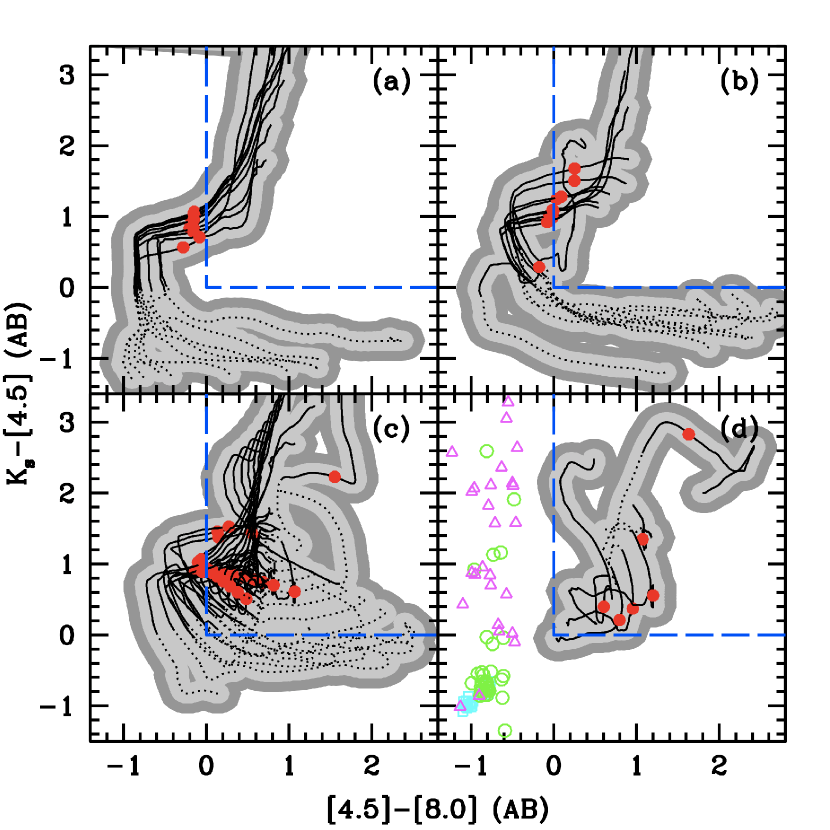
Similar to the L07, S05, and D12 criteria, the normal galaxy color tracks contaminate the KI selection region at . However, the KI contamination by normal galaxies at appears significantly reduced in comparison to L07 and S05, with no negative effect on the ability to select AGN (i.e., completeness). By avoiding the 10–20% error scatter region (light- and dark-grey regions) from starburst templates, the KI boundaries have improved efficiency on faint source classification. Another conceptual improvement of KI is the unbounded upper right AGN region. This avoids the loss of heavily obscured AGN (with extremely red colors). This is in contrast to the wedges defined in S05, for example, where the Torus template moves out of the selection region at the highest redshifts ().
One can also note the usefulness of the simple color in excluding low redshift normal galaxies: the condition is able to reject a large fraction of the non-AGN galaxies. Such a property also makes this simple color-cut of great use for the study of AGN and star-formation co-evolution in the latter half of cosmic history.
Not all the templates in Table 1 take into account prominent emission lines. These may affect the photometry and produce some degree of scatter in the color-color tracks. This is visible in Figure 4 where updated versions (highlighted as dotted lines) of the QSO1 and BQSO1 templates (Polletta et al., 2007) are considered, now with both H and OIII lines included (visible in the TQSO1 template, Polletta et al., 2007). Although in specific redshift intervals (when a certain emission line is redshifted into a given filter), AGN sources with smaller AGN contribution in the IR (like BQSO1) fall out of the AGN region of the KI criterion, the bulk of the AGN population is expected to remain inside the KI boundaries.
3.2. Extending to high redshifts: the KIM criterion
One serious problem for all criteria investigated so far is the contamination by normal galaxies at . All four (L07, S05, D12, and KI) fail to disentangle AGN dominated systems from normal galaxies at those redshifts. To avoid this problem, longer wavelength observed bands should be considered, allowing the observation of the rest-frame m regime, where AGN emission may dominate, at high redshifts. For this purpose, we extend our study to include the MIPS- band (see also Sajina et al., 2005).
The use of this waveband for AGN selection has additional shortcomings. Normal galaxies show a wide IRAC-MIPS color range (as a result of different PAH and dust emissions between galaxies), which is further increased by redshift (the PAH features are redshifted out of the 8.0 m band at low-, but redshifted into the 24 m band at ). This results in a considerable color overlap with AGNs, limiting the usefulness of a single IRAC-MIPS color to separate both populations (Lacy et al., 2004; Hatziminaoglou et al., 2005; Cardamone et al., 2008). Nevertheless, some authors have used the MIPS- band for unique, extreme objects (e.g., the IR-excess technique, Section 4.2) or in single, unconventional situations. For instance, while Garn et al. (2009) use against for a sample to identify those sources showing AGN activity, Treister et al. (2006) and Messias et al. (2010) use a single color cut at, respectively, and for the same purpose444Ivison et al. (2004) and Pope et al. (2008) also explore against to distinguish AGN from normal galaxies, but, in those works, only the color is effectively used for that purpose..
Colors involving the 24 m band are also usually avoided due to the large wavelength gap between this band and other commonly available MIR bands (usually the Spitzer-IRAC bands). At high- (e.g., ), however, the sampled rest-frame wavebands (2 and 6 m corresponding to observed 8 and 24 m, respectively) are not much more separated than the 3.6 and 8.0 IRAC bands for nearby galaxies. A different issue is the lower sensitivity and larger point spread function of the MIPS 24 m images when compared with those obtained with the IRAC channels, which affects the accuracy of color measurements using this longer wavelength band. Nevertheless, efficient photometry algorithms have been built to overcome these blending problems (Wuyts et al., 2008; Santini et al., 2009).
Figure 5 illustrates a color-color AGN diagnostic proposed for , with its boundaries avoiding a 10% photometric error scatter from normal galaxies. The criterion is defined by the following IRAC-MIPS (IM) conditions:
and
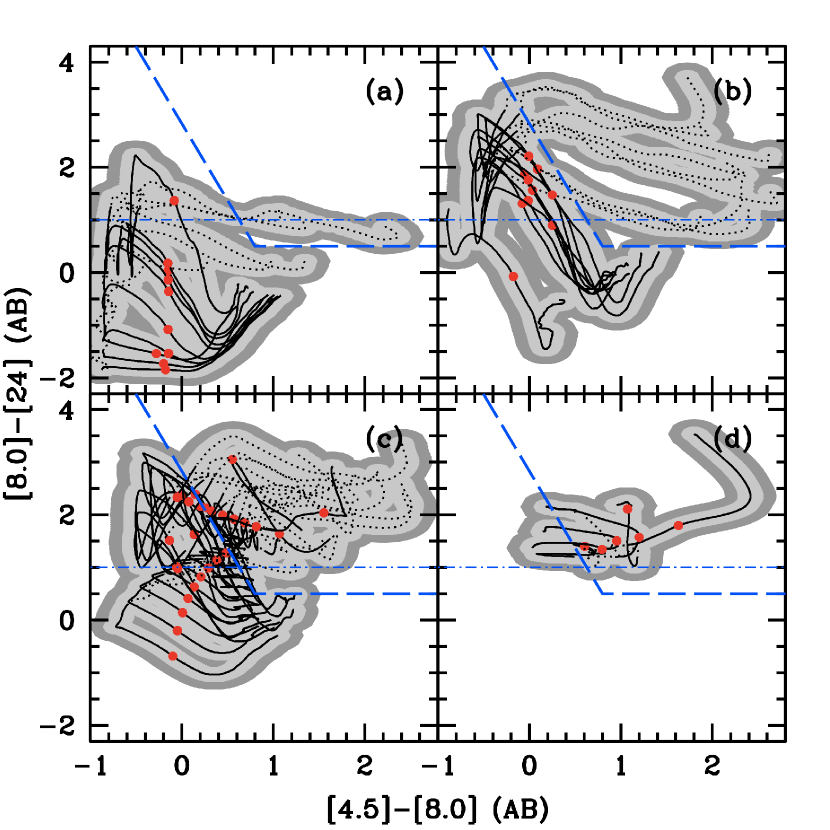
One can see that beyond , AGN (lower panels) and normal galaxies (upper panels) occupy essentially different regions in the [8.0]-[24] versus [4.5]-[8.0] space. This is of great interest for the characterization of high redshift galaxy populations, such as Lyman Break Galaxies (LBGs) and equivalents at (Steidel et al., 2003, 2004; Adelberger et al., 2004), or spectroscopically confirmed high- galaxies. We note, nevertheless, the incompleteness toward type-1 QSOs at 555However, type-1 QSOs with the largest optical-to-IR flux ratios migrate back in the AGN region at . or type-2 QSOs with strong Hα emission affecting the m band at (Figure 4). Note, however, that Mrk231 and torus-type AGN remain inside the region for the full redshift range studied ().
At low redshifts (), degeneracy exists in this IM color-color space, with AGN and normal galaxies occupying the same color-color region. A rejection of low-redshift () normal/star forming galaxies would, however, remove this overlap, allowing for a powerful AGN-selection criterion to be built. This can be achieved, as noted in the previous section, by using the color cut (Figure 3). This allows the rejection of a large fraction of the non-AGN galaxies, with AGN and hybrid galaxies in this redshift range remaining mostly unaffected.
The IRAC-MIPS (IM) conditions presented above, when considered together with the cut, which implements the rejection of normal galaxies, define what we will henceforth call the KIM (K+IRAC+MIPS) criterion.
We further note from Figure 5 that for , essentially all SEDs with are dominated by AGN emission. This happens because in this redshift range, the PAH features dominating a normal galaxy SED are redshifted out of the MIPS24μm filter. Figure 6 details this behavior, clearly showing that stellar dominated galaxies at show colors, as described by Messias et al. (2010). Such a color cut, if possible to apply (one has to know the source redshift), allows the recovery of H-emitting and/or rest-frame UV/optical blue QSOs expected to leave the IM region at (Figure 5).
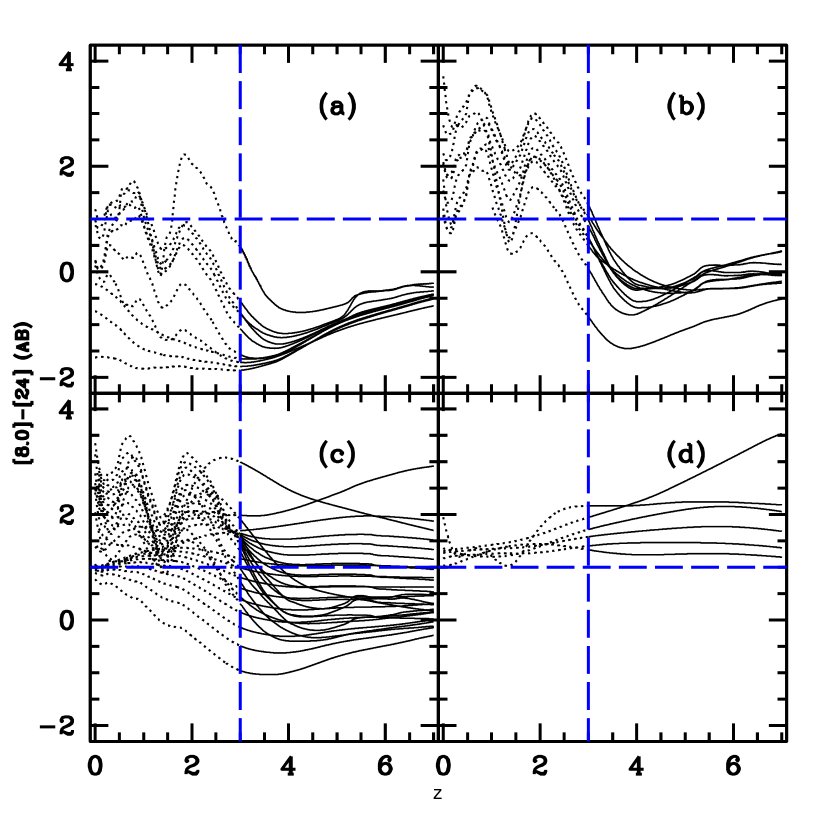
We acknowledge that by aiming at such a broad redshift range () KIM has its shortcomings. For instance, if the goal is to characterize sources at , the use of allows a reliable selection of AGN-hosts avoiding the need for longer wavelength bands. On the other hand, at , the color is enough to identify AGN dominated sources, avoiding the loss of sources undetected at shorter wavelengths. Finally, the colour is best at intermediate redshifts ().
However, a redshift estimate is frequently not available (incomplete spectroscopic sample coverage) nor reliable (photometric redshifts). Particularly for AGN-dominated sources, where a power-law SED is observed, the lack of spectral features (such as spectrum breaks) makes the photometric redshift solutions degenerate. In order to avoid such limitations, while still allowing AGN selection up to , the KIM criterion may be valuable.
4. Testing against multi-wavelength AGN samples
In the previous section we have proposed:
-
-
as an useful color for the efficient segregation of the galaxy population into AGN-dominated and normal SEDs at ;
-
-
KI criterion as an alternative to L07, S05, and D12; and
-
-
KIM (a 4 band, 3 color criterion), as a diagnostic which, according to the color tracks of the templates used, enables the selection of AGN sources at with little contamination by normal galaxies.
This is of great interest as it allows one to trace AGN activity since the epoch of reionization to the current time. The usefulness of these criteria can only be evaluated, however, by pursuing a test with well characterized control samples. Using various samples for which normal-galaxy and AGN classifications are obtained via other spectral regimes (from X-rays to radio), we can obtain some estimate of the efficiency of the new proposed diagnostics in comparison with commonly used ones.
Because an ideal sample, where all the sources are reliably split between AGN and non-AGN hosts, does not exist, we will perform these tests using five control samples. First, we use a sample of galaxies from the Chandra Deep Field South (CDFS, Giacconi et al., 2001) and another from the Cosmic Evolution Survey (COSMOS, Scoville et al., 2007), both with available AGN/non-AGN classification from X-rays and/or optical spectroscopy. Second, we assemble samples of IR-excess (IRxs) sources (Dey et al., 2008; Fiore et al., 2008; Polletta et al., 2008) found in CDFS and COSMOS fields. The QSO sample from the Sloan Digital Sky Survey (SDSS, Schneider et al., 2010), reaching , is also considered for the testing, as well as the High-z Radio Galaxy (HzRG) sample from Seymour et al. (2007). The first two samples (X-ray/optical selected in CDFS and COSMOS) allow for an indication of the completeness and non-AGN contamination of the IR AGN selection criteria, while the AGN samples (IRxs sources, SDSS QSOs and HzRGs) will allow for independent measures of their completeness up to the highest redshifts.
In the following subsections, Completeness () is defined as the fraction of the AGN population which a given IR criterion selects (AGNSEL/AGNTOT), while Reliability () refers to the fraction of the IR sources selected by a given criterion which are “true” AGN (, where -).
4.1. The CDFS and COSMOS samples
We have selected 2287 galaxies from MUSIC/CDFS catalog (Grazian et al., 2006; Santini et al., 2009) and 7217 from COSMOS (Ilbert et al., 2009) with an X-ray classification (based on source luminosity and spectral slope) and/or a good quality666Spectra flagged as 0 (very good) or 1 (good) in the MUSIC catalog, and estimates with probability of being correct in the COSMOS catalog. optical spectroscopic classification. Whenever a spectroscopic redshift was not available, the photometric estimates by Luo et al. (2010) and Salvato et al. (2011) were adopted.
The IR data used for the MUSIC catalog comes from Vandame (2002) and Dickinson et al. (in prep.), and that for COSMOS comes from Sanders et al. (2007), Le Floc’h et al. (2009), and McCracken et al. (2010). Regarding the X-rays, the 2 Ms Chandra Deep Field South (CDF-S, Luo et al., 2008) data was used, as well as the XMM data in COSMOS (Cappelluti et al., 2009; Brusa et al., 2010). The X-ray AGN classification is similar to that of Szokoly et al. (2004). There, the X-ray luminosity and hardness-ratio (HR) are used to identify the AGN population. The HR is a measure of the source obscuration and is defined as HR(H-S)/(H+S) with H and S being, respectively, the net counts in the hard, 2–8 keV, and soft, 0.5–2 keV, X-ray bands. However, this ratio becomes degenerated with redshift (Eckart et al. 2006 and Messias et al. 2010, but also Alexander et al. 2005 and Luo et al. 2010), and count measurements depend on array efficiency between telescopes. Hence we compute for each source the respective column densities () using the Portable, Interactive Multi-Mission Simulator777http://heasarc.nasa.gov/docs/software/tools/pimms.html (PIMMS, version 3.9k). The soft-band/full-band (SB/FB) and hard-band/full-band (HB/FB) flux ratios888The use of ratios based on FB flux instead of the commonly used SB/HB flux ratios, allows for an estimate of when the source is detected in the FB but no detection is achieved in either the SB or HB. were estimated for a range of column densities (, with steps of ), and redshifts (, with steps of ), considering a fixed photon index, (Tozzi et al., 2006). The comparison with the observed values results in the estimate of . However, it is known that this procedure systematically overestimates the intrinsic . The Appendix discusses this bias and how we attempted to correct it. The final value is then used to derive an intrinsic X-ray luminosity. The HR constraint used by Szokoly et al. (2004) () is equivalent to at , and this is the value considered throughout the whole redshift range.
Hence, an X-ray AGN is considered to have and , or . The remaining X-ray detections are regarded as non-AGN sources. The intrinsic X-ray (0.5–10 keV) luminosities are estimated as:
where is the obscuration-corrected X-ray flux in the 0.5–10 keV band, and is the observed photon index (when ) or (when ). In CDFS, the 0.5–8 keV luminosities are derived using Luo et al. (2008) catalogued 0.5–8 keV fluxes and converted to 0.5–10 keV considering the adopted . For simplicity, the luminosity ‘int’ label is dropped from now on, as we will always be referring to intrinsic luminosities, unless otherwise stated.
Regarding the spectroscopic sample, the AGN sources are those which display broad line features or high-ionization narrow emission lines characteristic of AGN activity (BLAGN or NLAGN, respectively). The remaining sources with a spectroscopic classification are regarded as part of the non-AGN population (e.g., SF galaxies, stars). The NLAGN classification comes from the MUSIC catalog in CDFS, and from Bongiorno et al. (2010) in COSMOS.
In both the CDFS and COSMOS final AGN samples, most sources have an X-ray AGN classification (82% and 80%, respectively), and a significant fraction has a spectroscopic AGN classification (21% in CDFS and 55% in COSMOS, the difference resulting from different spectroscopic completenesses between the two surveys).
4.1.1 KI/KIM efficiency in CDFS
For consistency, we only consider sources having photometry estimates with a flux error smaller than a third of the flux measurement (equivalent to an error in magnitude smaller than 0.36) in all -IRAC bands when testing L07, S05, D12, and KI. This requirement will remove many of the fainter objects, but the final sample is still among the deepest ever used to test these IR criteria. The magnitude distribution of the final sample considered is shown in Figure 7 (see open histograms). Among the 1440 sources composing the final sample, 166 (12%) are classified as AGN hosts (160 in X-rays, 38 through spectroscopy). The sample is further separated into redshift ranges: , , . The adopted threshold at is based on the discussion in section 3.1. This results in 801, 535, and 94 sources with -IRAC photometry at , , and , respectively.
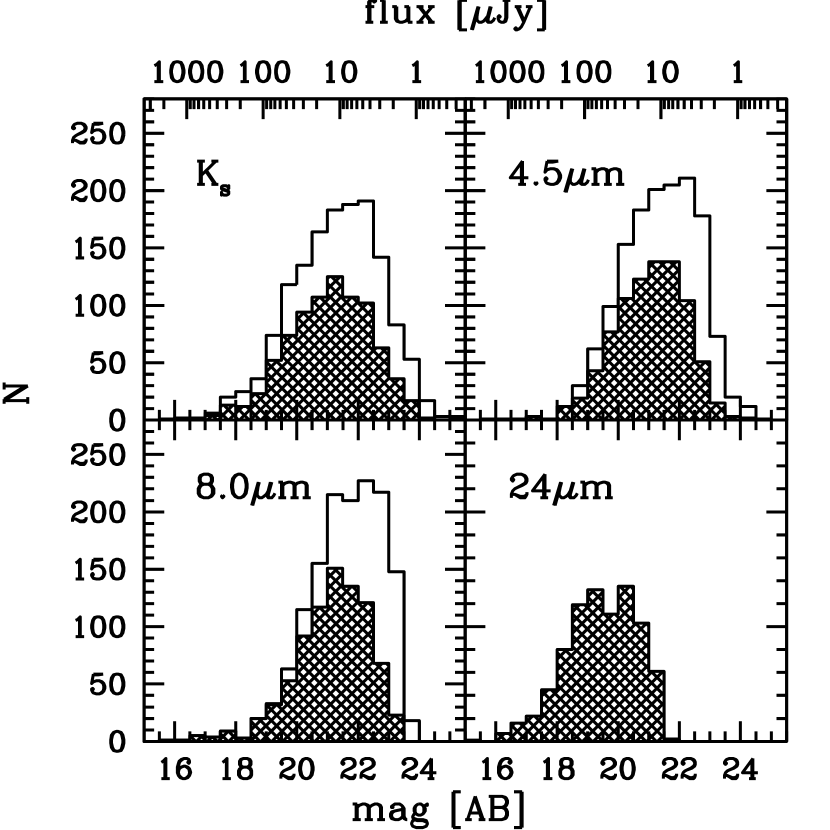
When testing KIM we also require reliable 24 m photometry (hatched histograms in Figure 7). However, this requirement restricts the sample to the brightest sources, unavoidably increasing the probability of finding AGN dominated sources (Brand et al., 2006; Treister et al., 2006; Donley et al., 2008). Although it can be considered a constraint by itself (which improves the criterion efficiency), this results in an unfair comparison of the actual color-color regions. Hence, when comparing KIM to L07, S05, and KI, we consider the sample of 834 sources (460/324/47 at , , and , respectively) with reliable -IRAC-MIPS photometry, of which 139 (17%) are classified as AGN hosts.
Tables 2, 3, and 4 summarize the final statistics for the application of each of the IR criteria to the CDFS control sample at different redshift ranges. In order to assess the significance of the results, two types of error are presented: Poisson and photometric. The latter is computed by scattering the source colors between the magnitude errors (which we limited to of the flux value) and evaluate how completeness () and reliability () vary as a result. However, there is a covariance between observational photometric and Poisson sampling errors, since the samples with the smallest photometric errors are the smallest in number, leading in turn to large sampling errors. Since our approach is based around testing colour-space boundaries that have already accounted for generous photometric variation around the SED templates in their definition, the current analysis is primarily limited by sampling (Poisson) errors. In general, the Poisson errors are larger than those that would be inferred from the photometric errors alone, so this approach is also conservative in the sense of erring in favour of the larger uncertainty. The discussion and results presented below are consequently based on a consideration of the Poisson errors associated with the sample sizes being used in the analysis of Completeness and Reliability.
| Sample | Criterion | NSELaaNumber of sources selected by a given criterion with an AGN/non-AGN classification from X-rays and/or spectroscopy. | AGNbbNumber of selected sources with an AGN classification, from either the X-rays or optical spectroscopy. | ccCompleteness () calculated as AGNSEL/AGNTOT. Reliability () calculated as AGNSEL/NSEL. Numbers in parenthesis refer, respectively, to the Poisson error and the photometric upper and lower error bars. | ccCompleteness () calculated as AGNSEL/AGNTOT. Reliability () calculated as AGNSEL/NSEL. Numbers in parenthesis refer, respectively, to the Poisson error and the photometric upper and lower error bars. |
|---|---|---|---|---|---|
| +IRAC | [none] | 801 | 42 | … | (51) |
| L07 | 105 | 21 | 50(13,) | 20(5,) | |
| S05 | 26 | 12 | 29(9,) | 46(16,) | |
| D12 | 5 | 4 | 10(5,) | 80(54,) | |
| KI | 24 | 12 | 29(9,) | 50(18,) | |
| +IRAC+ | [none] | 460 | 37 | … | (81) |
| MIPS | L07 | 76 | 18 | 49(14,) | 24(6,) |
| S05 | 20 | 11 | 30(10,) | 55(21,) | |
| D12 | 5 | 4 | 11(6,) | 80(54,) | |
| KI | 17 | 10 | 27(10,) | 59(23,) | |
| KIM | 10 | 7 | 19(8,) | 70(34,) |
Note. — This table is restricted to the CDFS sample. While in the upper group of rows reliable photometry is required — a magnitude error below 0.36 — in +IRAC bands, in the lower group of rows we also require reliable 24 photometry. The first row in each group refers to the total number of sources with reliable +IRAC (upper group) and +IRAC+24 m (bottom group) photometry. For reference, the value in parenthesis (with the corresponding Poisson error) in the column gives the overall fraction of identified AGN hosts, equivalent to the of a criterion selecting all sources in the field with reliable photometry in the considered bands.
| Sample | Criterion | NSEL | AGN | ||
|---|---|---|---|---|---|
| +IRAC | [none] | 535 | 80 | … | (152) |
| L07 | 170 | 50 | 62(11,) | 29(5,) | |
| S05 | 104 | 28 | 35(8,) | 27(6,) | |
| D12 | 18 | 15 | 19(5,) | 83(29,) | |
| KI | 60 | 32 | 40(8,) | 53(12,) | |
| +IRAC+ | [none] | 324 | 61 | … | (193) |
| MIPS | L07 | 110 | 39 | 64(13,) | 35(7,) |
| S05 | 70 | 25 | 41(10,) | 36(8,) | |
| D12 | 15 | 14 | 23(7,) | 93(35,) | |
| KI | 40 | 26 | 43(10,) | 65(16,) | |
| KIM | 25 | 16 | 26(7,) | 64(20,) |
Note. — This table is restricted to the CDFS sample. Table structure and column definition as in Table 2.
| Sample | Criterion | NSEL | AGN | ||
|---|---|---|---|---|---|
| +IRAC | [none] | 94 | 40 | … | (438) |
| L07 | 93 | 40 | 100(22,) | 43(8,) | |
| S05 | 54 | 29 | 72(18,) | 54(12,) | |
| D12 | 29 | 20 | 50(14,) | 69(20,) | |
| KI | 73 | 36 | 90(21,) | 49(10,) | |
| +IRAC+ | [none] | 47 | 33 | … | (7016) |
| MIPS | L07 | 47 | 33 | 100(25,) | 70(16,) |
| S05 | 32 | 24 | 73(20,) | 75(20,) | |
| D12 | 20 | 17 | 52(15,) | 85(28,) | |
| KI | 41 | 30 | 91(23,) | 73(18,) | |
| KIM | 24 | 20 | 61(17,) | 83(25,) |
Note. — This table is restricted to the CDFS sample. Table structure and column definition as in Table 2.
In the low redshift bin (), L07 is the most complete (selecting almost 50% of the AGN sample), but the least reliable as well, with less than a fifth of the sample being confirmed AGN hosts. This is understood given the large selection region set by the color constraints of L07 criterion, which despite selecting many AGN hosts (high ), also selects many non-AGN sources (low ). S05, KI, and KIM present almost comparable efficiencies, selecting around a quarter of the AGN population, and with 50–60% reliabilities. D12 retrieves the lowest values (10%, comparable with KIM, see also Section 4.1.2), but at the same time the highest values (80%, although with large Poisson errors).
At , L07 is still the criterion that provides the most complete AGN sample, but here it presents an value of , comparable to that of S05. Both KI and KIM present improved levels, with 50–60% of the sample being confirmed as AGN hosts. The improvement relative to the L07 and S05 criteria in this redshift range appears to be due to the color cut used. The D12 criterion is again the criterion that presents the lowest (20%) and the highest (80–90%). The D12 criterion is affected by small sample statistics, but it always recovers the highest values, supporting the scenario that it is in fact the most reliable of all the tested criteria.
At high- (), the fraction of “true” AGN hosts is already high (43%, increasing to 70% when restricting to the MIPS detected sample). As a result of the small number of sources (driven by the necessary quality constraints), no conclusion can be drawn regarding from this sample at such high redshifts, given that all criteria provide comparable results within the uncertainties. However, differences in completeness exist. D12 and KIM show the lowest values (), KI and L07 the highest (), while S05 gives intermediate values ().
One should also note the tendency for S05 and KIM to present the largest range between lower and upper photometric limits. While in KIM this relates to the use of the less sensitive MIPS band, the larger photometric error ranges in S05 are due to the use of bands close in wavelength (Figure 2), instead of bands widely separated in wavelength as in L07, KI and KIM. The large photometric errors found for the D12 criterion are probably related to the small sample statistics (see COSMOS results below, where these errors are close to zero).
Finally, Figure 8 details the application to the CDFS data of KI (upper panels) and KIM (lower panels), separated into redshift bins ( and ). For this exercise, we have required reliable photometry in the bands needed for KI or KIM. This figure shows that the KI and KIM criteria still miss a significant fraction (around two thirds) of the AGN population at . The high redshift panels show that most (around three quarters) of the overall population indeed falls inside the KI selection region (in agreement with Figure 3). The low number of blue sources is mainly a result of the photometric quality constraints applied to the sample. Knowing that the MIPS band is also the less sensitive waveband, at high redshifts, where sources tend to be fainter, blue sources will likely not be detected in the MIPS band and consequently will be absent from this exercise.

When no redshift estimate is available, the previous analysis, which separates the sample into redshift bins, would not be possible. Table 5 shows the results for the overall CDFS sample with no redshift constraint. The conclusions remain the same: KI and KIM are complete to 50% and 35% levels, respectively, and both show improved reliability () relative to L07 and S05 (KI and S05 error bars marginally overlap); and D12 is less complete (with values comparable to KIM, ), but the most reliable ().
| Sample | Criterion | NSEL | AGN | ||
|---|---|---|---|---|---|
| +IRAC | [none] | 1440 | 166 | … | (121) |
| L07 | 377 | 115 | 69(8,) | 31(3,) | |
| S05 | 188 | 73 | 44(6,) | 39(5,) | |
| D12 | 55 | 42 | 25(4,) | 76(16,) | |
| KI | 166 | 84 | 51(7,) | 51(7,) | |
| +IRAC+ | [none] | 834 | 134 | … | (161) |
| MIPS | L07 | 236 | 93 | 69(9,) | 39(5,) |
| S05 | 125 | 63 | 47(7,) | 50(8,) | |
| D12 | 42 | 37 | 28(5,) | 88(20,) | |
| KI | 101 | 69 | 51(8,) | 68(11,) | |
| KIM | 62 | 46 | 34(6,) | 74(14,) |
Note. — No redshift cut is considered in this table. Table structure and column definition as in Table 2.
4.1.2 KI/KIM efficiency in COSMOS
The same comparison is now performed for COSMOS. No redshift segregation is applied as there is no classified SF system at in this COSMOS sample. Among the 7216 sources with either a spectral or X-ray classification and adequate -IRAC photometry, 1423 are flagged as AGN hosts by X-ray and spectroscopy criteria. There are 2641 sources with MIPS24μm detection (842 AGN hosts). Table 6 reports the final statistics on the application of the various diagnostics. Note that 84% of this COSMOS sample is found at , implying that the statistics of this sample will be dominated by those of the population. Hence, it is fair to compare these results with those found for the CDFS sample at (Table 2). The COSMOS sample nevertheless provides a more numerous sample, giving smaller Poisson errors. The L07 criterion remains the most complete (), but also the least reliable (), as opposed to D12, which shows the highest reliability levels (). KI marginally retrieves a more reliable AGN sample than S05, but comparable completenesses ( and ). KIM shows a reliability of , but is likely the least complete criteria at .
| Sample | Criterion | NSEL | AGN | ||
|---|---|---|---|---|---|
| +IRAC | [none] | 7216 | 1423 | … | (201) |
| L07 | 2038 | 1115 | 78(3,) | 55(2,) | |
| S05 | 1102 | 921 | 65(3,) | 84(4,) | |
| D12 | 586 | 573 | 40(2,) | 98(6,) | |
| KI | 967 | 881 | 62(3,) | 91(4,) | |
| +IRAC+ | [none] | 2641 | 842 | … | (321) |
| MIPS | L07 | 1087 | 727 | 86(4,) | 67(3,) |
| S05 | 701 | 629 | 75(4,) | 90(5,) | |
| D12 | 464 | 454 | 54(3,) | 98(6,) | |
| KI | 643 | 588 | 70(4,) | 91(5,) | |
| KIM | 435 | 398 | 47(3,) | 91(6,) |
Note. — Table structure and column definition as in Table 2. No redshift range is adopted as there is no classified SF system at in the COSMOS sample.
It is difficult to directly compare in absolute value the results achieved with the CDFS and COSMOS samples, since many characteristics differ between the two surveys. As an example, by applying the COSMOS (IR and X-rays) flux limits to the CDFS sample, the and values for the different diagnostics are closer to those of COSMOS. Other issues may contribute to this, such as (a) different photometry extraction methods (ConvPhot by MUSIC team in CDFS and aperture photometry in COSMOS), (b) different spectral coverage depth and procedures for spectral classification, (c) the different photon indices used for the CDFS and COSMOS samples to convert from count rates to X-ray fluxes, (d) differences in relative sensitivity between soft and hard bands of the Chandra Space Telescope (in CDFS) and XMM-Newton (in COSMOS), and (e) cosmic variance. We stress, however, that the results on the relative efficiency between the criteria are not contradictory between the two fields.
4.2. IR-excess sources
Also known as IR bright galaxies, IR-excess (IRxs) sources are believed to be part of an extreme IR population — the compton-thick (type-2) AGN — frequently missed by optical/X-ray surveys. IRxs sources are always selected to have 24 m to -band flux ratio of (except in Daddi et al., 2007, who select this type of sources based on a template fit procedure). However, highly obscured star-forming galaxies may also present such colors (Dey et al., 2008; Fiore et al., 2008; Pope et al., 2008; Narayanan et al., 2010). It has been shown, nevertheless, that the AGN fraction increases as one restricts IRxs samples to brighter fluxes and/or redder NIR-to-optical colors. Dey et al. (2008) show that at , of the IRxs sample shows power-law SEDs (likely AGN-driven, but see Narayanan et al., 2010), and have detected X-ray counterparts (a higher fraction than that found for non-IRxs sources). Donley et al. (2010) consider 13 IRxs with , which show Spitzer-IRS spectra dominated by AGN emission (even though half shows detectable PAH emission), and their X-ray properties hint for heavily obscured (Compton-thick) AGN activity in 80% of the sample. Polletta et al. (2008) considered IRxs sources, which also presented extremely red NIR-to-optical colors. All selected sources show the 9.7m silicate feature in absorption, have extreme MIR luminosities (), and always require the presence of torus emission to explain their MIR SED. Finally, a simpler color combination was explored to fainter fluxes by Fiore et al. (2008, 2009) and Treister et al. (2009). Through means of X-ray stacking, the two groups showed that of IRxs sources with show evidences for heavily obscured (Compton-thick) AGN activity.
The diagnostics considered below rely on optical-to-IR color cuts, more precisely, and . However, -band photometry is not available in the MUSIC catalog. We thus convert those colors to equivalent ones using -band ( and ) considering a power-law spectrum (). We highlight three criteria. Dey et al. (2008, D08) select sources with and (equivalent to and ). Fiore et al. (2008, F08) select sources with ( and 999It should be noted, however, that the color is likely more efficient than in selecting AGN sources (Messias et al., 2010, see also Glikman et al. 2004 for a combination of the two).) at (). Finally, we also consider the brightest sources by adopting the flux cut of Polletta et al. (2008, P08), (corresponding to ).
These criteria were applied to the MUSIC and COSMOS catalogs and Table 7 details the numbers of the selected sources by each of the IR color criteria. In spite of the much smaller sample size in CDFS, the results agree remarkably well between the two surveys. In COSMOS, all criteria appear to select most of the brightest objects (P08) in a comparable way (within the error bars), as expected (Donley et al., 2008; Eckart et al., 2010). Regarding the fainter sources, L07 is the most complete, followed by KIM and KI, while S05 and D12 select the fewest IRxs sources.
| Region | F08 | D08 | P08 |
|---|---|---|---|
| CDFS | |||
| … | 77 | 10 | 1 |
| L07 | 72 (94,15,) | 9 (90,41,) | 1 (100,100,) |
| S05 | 29 (38,8,) | 5 (50,27,) | 1 (100,100,) |
| D12 | 18 (23,6,) | 5 (50,27,) | 1 (100,100,) |
| KI | 40 (52,10,) | 7 (70,34,) | 1 (100,100,) |
| KIM | 40 (52,10,) | 8 (80,38,) | 1 (100,100,) |
| COSMOS | |||
| … | 991 | 256 | 51 |
| L07 | 909 (92,4,) | 244 (95,9,) | 47 (92,19,) |
| S05 | 381 (38,2,) | 138 (54,6,) | 39 (76,16,) |
| D12 | 202 (20,2,) | 128 (50,5,) | 41 (80,17,) |
| KI | 493 (50,3,) | 179 (70,7,) | 46 (90,18,) |
| KIM | 606 (61,3,) | 212 (83,8,) | 50 (98,20,) |
Note. — Number of selected IRxs sources. The numbers in parenthesis give the equivalent fractions, the Poisson error, and the photometric upper and lower error bars.
4.3. SDSS QSOs
QSOs present in the Sloan Digital Sky Survey Quasar Catalogue Data Release 7 (SDSS-DR7, Schneider et al., 2010) were cross-matched (2” radius) with the IR catalogues from the COSMOS (S-COSMOS), Lockman Hole, ELAIS-N1, and ELAIS-N2 (SWIRE, Lonsdale et al., 2003) fields using GATOR101010http://irsa.ipac.caltech.edu/applications/Gator/ at IRSA-NASA/IPAC. The final sample is composed by 293 QSOs. -band photometry comes from 2MASS (for 21% of the sample, Skrutskie et al., 2006), UKIDSS-DXS DR8111111UKIDSS uses the UKIRT Wide Field Camera (WFCAM; Casali et al., 2007) and a photometric system described in Hewett et al. (2006). The pipeline processing and science archive are described in Irwin et al. (in preparation) and Hambly et al. (2008). We have used data from the 8th data release. (29%, Lawrence et al., 2007), and COSMOS (23%, Ilbert et al., 2009). Overall, there are 186 QSOs with reliable photometry in all IRAC channels. Of these, 140 have also MIPS24μm photometry, and 142 have -band photometry. We find 107 with full -IRAC-MIPS24μm coverage. To enhance the high- regime sampling, we further include 13 SDSS-DR3 QSOs at (Jiang et al., 2006). Of these, 12 are detected in all IRAC and MIPS24μm channels, while only five have 2MASS -band data.
Figure 9 shows the location of the QSO sample in the KI, IM (Section 3.2), L07, and S05 color-color spaces. Only sources with reliable photometry in the displayed bands are shown. While L07, S05, and KI select most of the displayed sample (), D12 and KIM select a smaller, yet large, portion of it, respectively, 84% and 65%. For QSOs, the IM completeness drops to 36%, in agreement with Figure 5, where QSO templates start to move out of the KIM region at . This is likely a result of both blue rest-frame optical SEDs, which most IRAC bands probe at these redshifts, low metallicity (consequently less dust) in these high redshift sources, and strong H emission. While blue rest-frame optical SEDs or strong H emission imply more objects in the blue side of , low metallicity results in some objects with bluer colors. Note that S05 and D12 retrieve opposite efficiencies in selecting QSOs, where S05 selects all and D12 selects none.
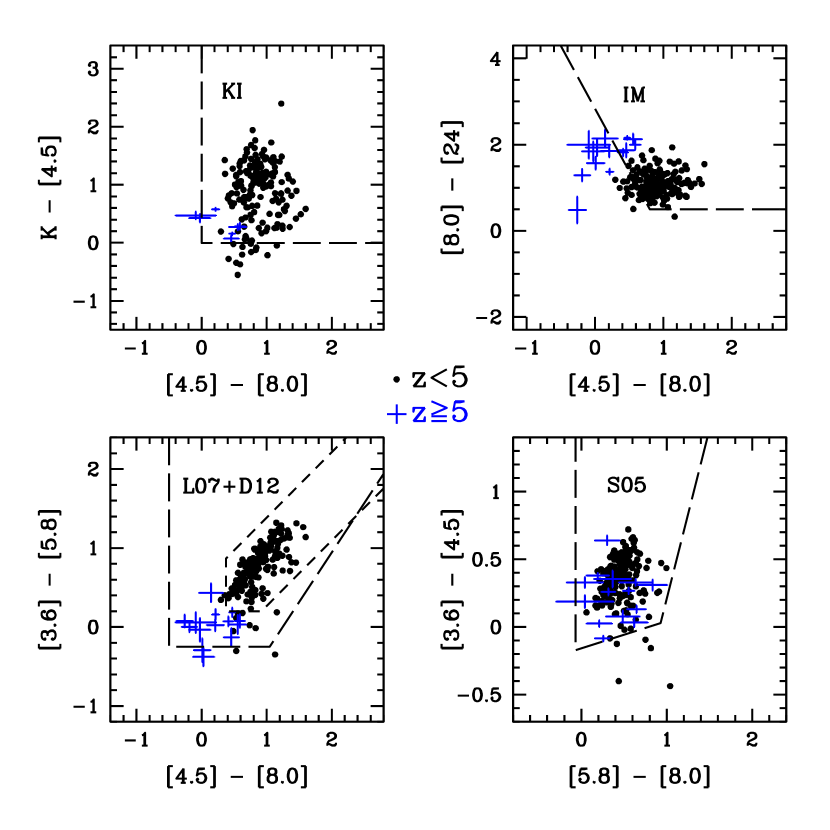
We note, however, that if there is a prior indication for such high redshifts ( based on spectroscopy or, e.g., on the LBG technique), then the [8.0]-[24] color can be used by itself and much more efficiently for the identification of AGN (cf. Figure 6). For QSOs, all but one show . The few QSOs with blue (top left panel) colors are explained in light of the discussion in Section 3.1: these are potentially AGN with smaller optical-to-IR flux ratios and/or sources possessing strong line emission.
The high completeness levels achieved with this optical selected sample show the eclectic selection of IR criteria. However, optically selected AGN are not the main targets of IR AGN diagnostics, as, by definition, optical surveys do detect them. The most interesting use of these criteria is to recover sources undetected at X-ray and optical wavelengths. Sections 4.2 (above) and 4.4 (below) are, in this respect, much more representative of the usefulness of IR AGN diagnostics.
4.4. High redshift Radio Galaxies
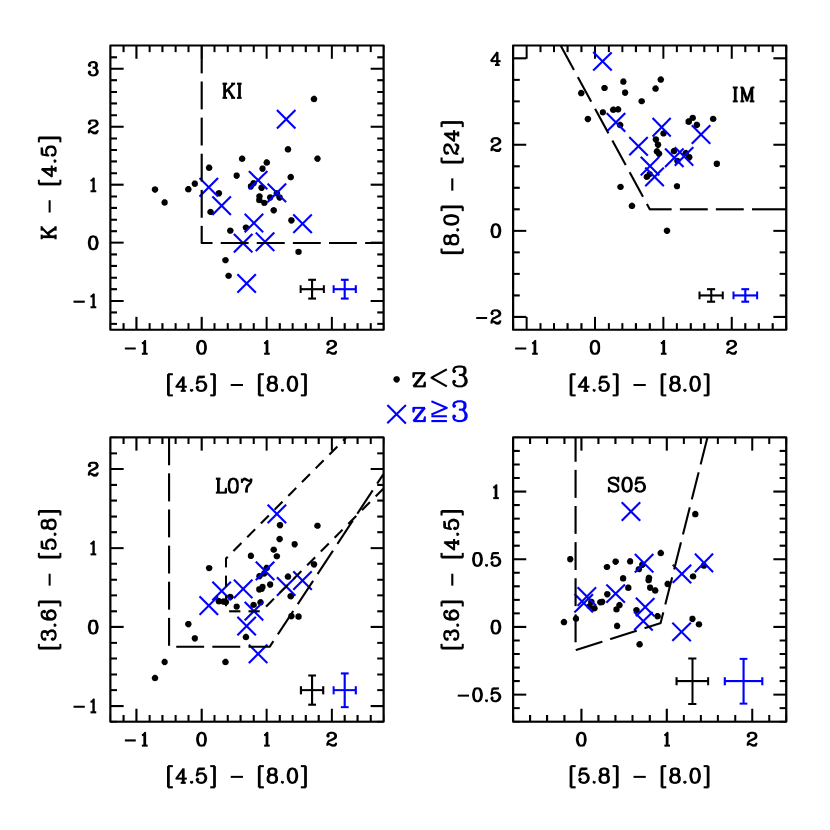
To test yet another AGN population, we now consider High-z Radio Galaxies (HzRGs). These are among the most luminous sources in the Universe and are believed to host powerful AGN. We use the sample of 71 HzRGs from Seymour et al. (2007). These are all at , a redshift range where no normal galaxy is believed to contaminate the AGN IM region proposed in Section 3.2. This is a classic example — such as that of LBGs or spectroscopically confirmed galaxies at — for the direct application of the IM boundaries. Having this, the color cut is not required to disentangle AGN/non-AGN dominated sources at (see Section 3.1), meaning that one may consider and colors alone to determine whether AGN or stellar emission dominates the IR spectral regime.
Figure 10 shows the location of 62 HzRGs in the IM color-color diagram (top right panel). Note the difference to SDSS QSOs (Figure 9), where HzRGs show predominantly redder colors. The AGN region correctly selects as AGN 88% (37 sources) of the sample with adequate photometry (42 sources detected at 4.5, 8.0, and 24m). If no redshift estimate was available, however, one would need the color cut to apply the IM AGN criterion, i.e., the KIM criterion. The application of KIM would result in a 78% completeness level (28 out of 36 sources). The remaining panels show that L07 selects 86% (38 out of 44 sources), D12 selects 27% (12 out of 44 sources), S05 selects 73% (32 out of 44 sources), and KI selects 78% (32 out of 41 sources).
4.5. Sub-Millimetre Galaxies
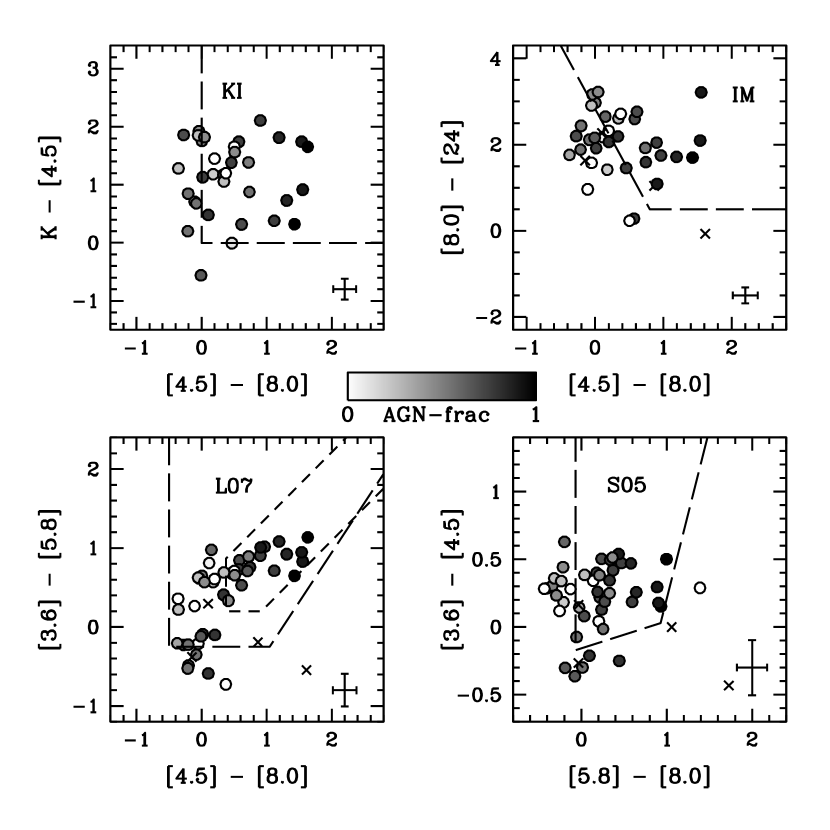
In Hainline et al. (2011) one can find estimates for the non-stellar contribution (shown in that work to be related to AGN activity) to the IR SED of Sub-Millimetre Galaxies (SMGs), showing that significant AGN emission is present even at m ( of the sample with an estimate shows AGN contributions of at these wavelengths). The estimates for the non-stellar contribution were obtained photometrically by fitting the SMGs SEDs with a combination of pure star-forming models and power-law spectra (, with or ). These non-stellar contribution estimates depend on whether one considers a constant star-formation history or an initial instant burst followed by passive evolution. These assumptions provide two extreme scenarios, and here we adopt the average between the two. The sample is that from Chapman et al. (2005), found to be at ( of the sample is at ). The -band photometry is presented in Smail et al. (2004), while the IRAC and MIPS photometry is presented in Hainline et al. (2009).
Figure 11 shows the distribution of SMGs in different color-color spaces. The intensity of each data point relates to the AGN contribution at observed m (the darker it is, the higher is the AGN contribution). Specifically in the IM plot (upper right panel), even though there are two sources with an estimated 0% contribution from AGN inside the selection region, all but one (with 25%) of the remainder (19 sources) have of AGN contribution. Overall, the IM selected sample shows an average of 121212The errors only consider the propagated errors associated to each individual estimate used for averaging. of AGN contribution at observed m. L07, S05, D12, and KI show131313Separately considering sources detected in bands involved in each criteria, hence subject to selection effects. For instance, 49 SMGs are detected in all four IRAC channels (used for L07, S05, and D12 statistics), while 34 are detected in -band, 4.5 m and 8.0 m (used for KI statistics)., respectively, averages of , , , and . Although all criteria select at least one SMG with an estimated 0% contribution from AGN, the average AGN contribution is always . This means that for many SMGs, although the AGN does not dominate the IR emission, the AGN contributes significantly to the IR SED of the galaxy. The same is expected for IR selected AGN, this is, although we see selected sources where the AGN does not dominate at IR wavelengths, the AGN is present and active, contributing enough for the source to be selected as an IR AGN.
5. Implications for JWST surveys
The start of scientific observations of JWST, the successor of at mid-IR wavelengths, is expected for 2018. It will be a 6.5 m space telescope which will operate from 0.6 to 27 m. As highlighted in this and previous work, this spectral regime has great potential for separating AGN from normal (non-AGN) galaxies.
The sensitivity will of course be better than ever before, and the high-z universe will be probed with unprecedented detail. Many galaxies will be studied with MIR spectroscopy, and signs of AGN activity will be naturally found that way (e.g., Laurent et al., 2000; Armus et al., 2007; Veilleux et al., 2009; Fu et al., 2010). When dealing with large surveys, however, with thousands of sources and many close to the detection limit, AGN selection will have to rely on photometric diagnostics such as the KI/KIM criteria presented here. By selecting AGN candidates over a broad range of redshifts, , the KIM criterion will enable the study of AGN phenomena to the earliest epochs.
While the KI/KIM criteria can already be applied to current data from , potentially more efficient MIR criteria will be possible with the large wavelength coverage of the JWST. Using planned JWST filter response curves141414Provided online at:
http://www.stsci.edu/jwst/instruments/
nircam/instrumentdesign/filters/index_html
http://www.stsci.edu/jwst/instruments/miri/
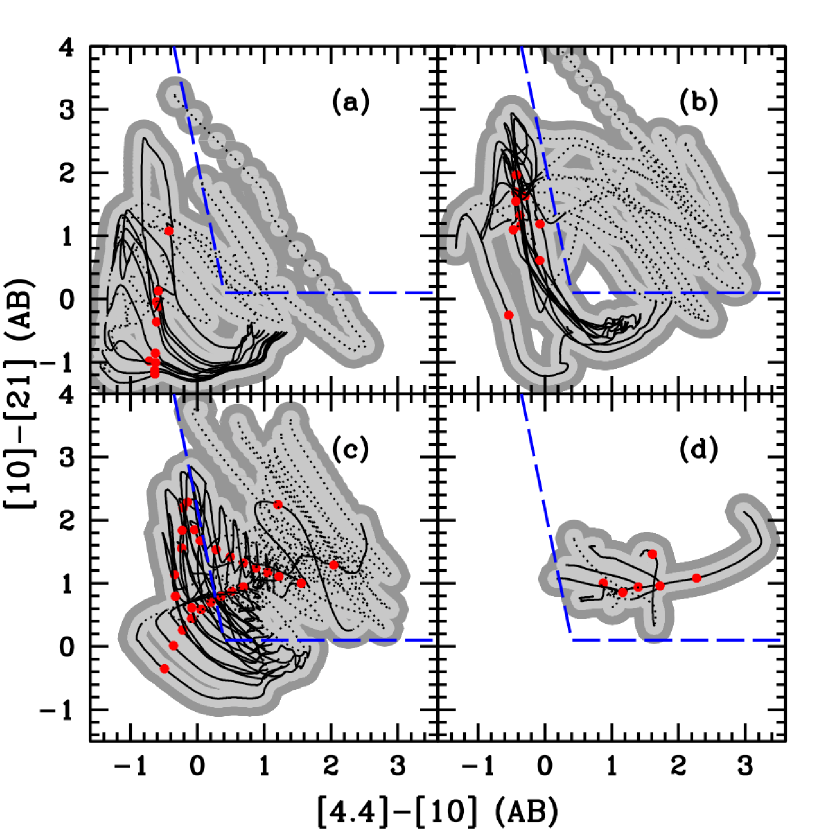
instrumentdesign/miri_glance.html ., we suggest a possible and promising color-color space alternative to that proposed in Section 3.2, using the MIRI 10m and 21m filters instead of the IRAC 8.0m and MIPS 24m bands, and the NirCAM 4.4m instead of IRAC 4.5m (note that these are bands close to those used in Wide-field IR Survey Explorer, WISE; see also Assef et al., 2010; Stern et al., 2012). The selection conditions are the following:
and
In Figure 12, the four panels show that the [4.4]-[10] versus [10]-[21] color-color space seems to present a better selection of the AGN/Hybrid model tracks. The AGN model tracks are better delineated by the selection boundaries (recovering the QSO missed by KIM) and, as a bonus, the 21m filter is over three times more sensitive than the planed MIRI 25m filter (equivalent to the MIPS 24m filter), increasing the probability of a detection needed for an AGN classification. This is shown in Figures 13 and 14, where AGN dominated sources are detected up to the highest redshift considered in this work ().
6. Conclusions
Based on semi-empirical galaxy SED templates, we have developed physically motivated IR color criteria for the selection of a wide variety of AGN in a large redshift range (). As well as the application to existing data (e.g., the recently available WISE data151515http://wise2.ipac.caltech.edu/docs/release/prelim/ at 3.4, 4.6, 12, and 22 m, Wright et al., 2010), these criteria are particularly relevant for the JWST, given the wide MIR spectral range considered. We thus propose new AGN IR diagnostics. The color is ideal for the universe (Section 3.1); KI is a reliable alternative to the IRAC-based diagnostics at (based on Poisson errors alone, Sections 3.1 and 4.1); and KIM (Section 3.2), a four band (K, 4.5, 8.0, and 24 m), three color (K-[4.5], [4.5]-[8.0], and [8.0]-[24]) criterion is proposed as a new ‘wedge’ criterion to select AGN hosts over the full range, based on template colour tracks alone (the current control samples prevent any conclusion at due to small sample statistics).
The absolute efficiency of IR AGN criteria is, at this stage, impossible to obtain as the control (X-ray and optical selected) samples used here are themselves incomplete, hence, results should be treated with care. For instance, KI achieves reliabilities of in CDFS (90% in COSMOS) and KIM shows reliabilities of 60–80% (90%). These should be considered lower-limits, because X-ray and spectroscopic data may not have been deep enough to reveal AGN features (Section 4), and we show that the selected sources with SF-dominated SEDs, are still likely to host an active AGN.
Nevertheless, in the coming years, these criteria should be improved as a result of the rich variety of filters to be incorporated in the instruments on board the upcoming JWST (Section 5). The ability to track AGN activity since the end of the reionization epoch will hold great advantages for the study of galaxy-AGN co-evolution.


Figure 16a shows the overall bias toward type-2 objects over type-1 objects depending on redshift and flux ratio error (in percent). In order to produce this figure, we have considered an initial 50/50% fraction of type-1/type-2 objects and a Gaussian probability density distribution (PDD) centred at flux ratios corresponding to and with a of the flux ratio. The Gaussian PDD gives the probability for the output (observed) classification to be unobscured () or obscured (), consequently providing the overall output bias shown in Figure 16a. In this figure, the bias is calculated as the ratio between the output (observed) type-2/type-1 ratio and the input (intrinsic) type-2/type-1 ratio. Note the trends maximize at . If we instead had restricted this exercise to the range (considered in Donley et al., 2012), the maximum value would be at . This is the bias found by Donley et al. (2012) at . This means, for the XMM sources used in that work, the flux ratios are affected on average by a error.


The Gaussian PDD also provides the average overestimate associated with a given intrinsic value depending on flux ratio error and redshift. This is shown in Figure 16b for a 20% flux ratio error. These trends allow us to attempt the correction of the referred bias, where the observed value (y-axis in Figure 16b) corresponds to a intrinsically smaller value (x-axis) for a given flux ratio error at the source’s redshift. The flux ratios used to estimate in this work are all based on measurements with errors less than a third of the fluxes, a propagated flux ratio error of (the average accepted flux ratio error was ). Even though individually the corrected value should not be regarded as the best estimate, this average correction applied to the overall population will diminish the bias. The number of type-1 objects which would be classified as type-2 if no correction was applied is small: 14 in CDFS and 9 in COSMOS. Most of these (19 objects) are at .
References
- Adelberger et al. (2004) Adelberger, K. L., Steidel, C. C., Shapley, A. E., et al. 2004, ApJ, 607, 226
- Afonso et al. (2001) Afonso, J., Mobasher, B., Chan, B. & Cram, L. 2001, ApJ, 559, 101
- Afonso et al. (2006) Afonso, J., Mobasher, B., Koekemoer, A., Norris, R. P., & Cram, L. 2006, AJ, 131, 1216
- Akylas et al. (2006) Akylas, A., Georgantopoulos, I., Georgakakis, A., Kitsionas, S., & Hatziminaoglou, E. 2006, A&A, 459, 693
- Alexander et al. (2005) Alexander, D. M., Bauer, F. E., Chapman, S. C., Smail, I., Blain, A. W., Brandt, W. N., & Ivison, R. J. 2005, ApJ, 632, 736
- Alonso-Herrero et al. (2006) Alonso-Herrero, A., et al. 2006, ApJ, 640, 167
- Armus et al. (2007) Armus, L., Charmandaris, V., Bernard-Salas, J., et al. 2007, ApJ, 656, 148
- Asmus et al. (2011) Asmus, D., Gandhi, P., Smette, A., Hönig, S. F., & Duschl, W. J. 2011, arXiv:1109.4873
- Assef et al. (2010) Assef, R. J., Kochanek, C. S., Brodwin, M., et al. 2010, ApJ, 713, 970
- Assef et al. (2011) Assef, R. J., Kochanek, C. S., Ashby, M. L. N., et al. 2011, ApJ, 728, 56
- Barmby et al. (2006) Barmby, P., et al. 2006, ApJ, 642, 126
- Bongiorno et al. (2010) Bongiorno, A., et al. 2010, A&A, 510, 56
- Bower et al. (2006) Bower, R. G., Benson, A. J., Malbon, R., et al. 2006, MNRAS, 370, 645
- Brand et al. (2006) Brand, K., et al. 2006, ApJ, 644, 143
- Brusa et al. (2010) Brusa, M., et al. 2010, ApJ, 716, 348
- Calzetti et al. (2007) Calzetti, D., Kennicutt, R. C., Engelbracht, C. W., et al. 2007, ApJ, 666, 870
- Cappelluti et al. (2009) Cappelluti, N., et al. 2009, A&A, 497, 635
- Cardamone et al. (2008) Cardamone, C. N., et al. 2008, ApJ, 680, 130
- Casali et al. (2007) Casali, M., Adamson, A., Alves de Oliveira, C., et al. 2007, A&A, 467, 777
- Chambers et al. (1996) Chambers, K. C., Miley, G. K., van Breugel, W. J. M., & Huang, J.-S. 1996, ApJS, 106, 215
- Chapman et al. (2005) Chapman, S. C., Blain, A. W., Smail, I., & Ivison, R. J. 2005, ApJ, 622, 772
- Comastri et al. (2001) Comastri, A., Fiore, F., Vignali, C., et al. 2001, MNRAS, 327, 781
- Croton et al. (2006) Croton, D. J., Springel, V., White, S. D. M., et al. 2006, MNRAS, 365, 11
- Daddi et al. (2007) Daddi, E., et al. 2007, ApJ, 670, 156
- Dey et al. (2008) Dey, A., et al. 2008, ApJ, 708, 943
- de Grijp et al. (1985) de Grijp, M. H. K., Miley, G. K., Lub, J., & de Jong, T. 1985, Nature, 314, 240
- Donley et al. (2012) Donley, J. L., Koekemoer, A. M., Brusa, M., et al. 2012, arXiv:1201.3899
- Donley et al. (2010) Donley, J. L., Rieke, G. H., Alexander, D. M., Egami, E., & Pérez-González, P.G. 2010, ApJ, 719, 1393
- Donley et al. (2008) Donley, J. L., et al. 2008, ApJ, 687, 111
- Donley et al. (2007) Donley, J. L., et al. 2007, ApJ, 660, 167
- Draper & Ballantyne (2009) Draper, A. R., & Ballantyne, D. R. 2009, ApJ, 707, 778
- Eckart et al. (2010) Eckart, M., McGreer, I. D., Stern, D., Harrison, F. A., & Helfand, D. J. 2010, ApJ, 708, 584
- Eckart et al. (2006) Eckart, M. E., Stern, D., Helfand, D. J., et al. 2006, ApJS, 165, 19
- Edelson & Malkan (2012) Edelson, R., & Malkan, M. 2012, ApJ, 751, 52
- Elbaz et al. (2002) Elbaz, D., Flores, H., Chanial, P., et al. 2002, A&A, 381, L1
- Elbaz et al. (2011) Elbaz, D., Dickinson, M., Hwang, H. S., et al. 2011, A&A, 533, A119
- Elvis et al. (1994) Elvis, M., Wilkes, B. J., McDowell, J. C., et al. 1994, ApJS, 95, 1
- Engelbracht et al. (2008) Engelbracht, C. W., Rieke, G. H., Gordon, K. D., et al. 2008, ApJ, 678, 804
- Fadda et al. (2010) Fadda, D., Yan, L., Lagache, G., et al. 2010, ApJ, 719, 425
- Farrah et al. (2007) Farrah, D., Bernard-Salas, J., Spoon, H. W. W., et al. 2007, ApJ, 667, 149
- Fazio et al. (2004) Fazio, G. G., Hora, J. L., Allen, L. E., et al. 2004, ApJS, 154, 1
- Fiore et al. (2008) Fiore, F., et al. 2008, ApJ, 672, 94
- Fiore et al. (2009) Fiore, F., Puccetti, S., Brusa, M., et al. 2009, ApJ, 693, 447
- Fu et al. (2010) Fu, H., Yan, L., Scoville, N. Z., et al. 2010, ApJ, 722, 653
- Garn et al. (2009) Garn, T., et al. 2009, MNRAS, tmp, 1909
- Georgakakis et al. (2010) Georgakakis, A., Rowan-Robinson, M., Nandra, K., et al. 2010, MNRAS, 406, 420
- Giacconi et al. (2001) Giacconi, R., Rosati, P., Tozzi, P., et al. 2001, ApJ, 551, 624
- Gilli (2004) Gilli, R. 2004, Advances in Space Research, 34, 2470
- Glikman et al. (2004) Glikman, E., Gregg, M. D., Lacy, M., et al. 2004, ApJ, 607, 60
- Granato et al. (2004) Granato, G. L., De Zotti, G., Silva, L., Bressan, A., & Danese, L. 2004, ApJ, 600, 580
- Grazian et al. (2006) Grazian, A., et al. 2006, A&A, 449, 951
- Hainline et al. (2009) Hainline, L. J., Blain, A. W., Smail, I., et al. 2009, ApJ, 699, 1610
- Hainline et al. (2011) Hainline, L. J., Blain, A. W., Smail, I., et al. 2011, ApJ, 740, 96
- Hambly et al. (2008) Hambly, N. C., Collins, R. S., Cross, N. J. G., et al. 2008, MNRAS, 384, 637
- Hatziminaoglou et al. (2005) Hatziminaoglou, E., et al. 2005, AJ, 129, 1198
- Henriques et al. (2011) Henriques, B., Maraston, C., Monaco, P., et al. 2011, MNRAS, 415, 3571
- Hewett et al. (2006) Hewett, P. C., Warren, S. J., Leggett, S. K., & Hodgkin, S. T. 2006, MNRAS, 367, 454
- Ho et al. (2003) Ho, L. C., Terashima, Y., & Ulvestad, J. S. 2003, ApJ, 589, 783
- Hönig et al. (2010) Hönig, S. F., Kishimoto, M., Gandhi, P., et al. 2010, A&A, 515, A23
- Hopkins et al. (2005) Hopkins, P. F., Hernquist, L., Martini, P., et al. 2005, ApJ, 625, L71
- Hopkins et al. (2006) Hopkins, P. F., Hernquist, L., Cox, T. J., et al. 2006, ApJS, 163, 1
- Hu & Ridgway (1994) Hu, E. M., & Ridgway, S. E. 1994, AJ, 107, 1303
- Hunt et al. (2010) Hunt, L. K., Thuan, T. X., Izotov, Y. I., & Sauvage, M. 2010, ApJ, 712, 164
- Ilbert et al. (2009) Ilbert, O., et al. 2009, ApJ, 690, 1236
- Ivezić et al. (2002) Ivezić, Ž., Menou, K., Knapp, G. R., et al. 2002, AJ, 124, 2364
- Ivison et al. (2004) Ivison, R. J., et al. 2004, ApJS, 154, 124
- Jiang et al. (2006) Jiang, L., et al. 2006, AJ, 132, 2127
- Lacy et al. (2004) Lacy, M., et al. 2004, ApJS, 154, 166
- Lacy et al. (2007) Lacy, M., Petric, A. O., Sajina, A., Canalizo, G., Storrie-Lombardi, L.J., Armus, L., Fadda, D., & Marleau, F. R. 2007, AJ, 133, 186
- Laor (1999) Laor, A. 1999, Phys. Rep., 311, 451
- Laurent et al. (2000) Laurent, O., Mirabel, I. F., Charmandaris, V., Gallais, P., Madden, S. C., Sauvage, M., Vigroux, L., & Cesarsky, C. 2000, ApJS, 359, 887
- Lawrence et al. (2007) Lawrence, A., Warren, S. J., Almaini, O., et al. 2007, MNRAS, 379, 1599
- Le Floc’h et al. (2009) Le Floc’h, E., et al. 2009, ApJ, 703, 222
- Lonsdale et al. (2003) Lonsdale, C. J., et al. 2003, PASP, 115, 897
- Loewenstein et al. (2001) Loewenstein, M., Mushotzky, R. F., Angelini, L., Arnaud, K. A., & Quataert, E. 2001, ApJ, 555, L21
- Luo et al. (2008) Luo, B., et al. 2008, ApJS, 179, 19
- Luo et al. (2010) Luo, B., et al. 2010, ApJS, 187, 560
- Maiolino et al. (2003) Maiolino, R., et al. 2003, MNRAS, 344, 59
- Maraston (2005) Maraston, C. 2005, MNRAS, 362, 799
- Martínez-Sansigre et al. (2005) Martínez-Sansigre, A., Rawlings, S., Lacy, M., et al. 2005, Nature, 436, 666
- McCracken et al. (2010) McCracken, H. J., Capak, P., Salvato, M., et al. 2010, ApJ, 708, 202
- Melia & Falcke (2001) Melia, F., & Falcke, H. 2001,ARA&A, 39, 309
- Messias et al. (2010) Messias, H., Afonso, J., Hopkins, A., Dominici, T., Mobasher, B., & Alexander, D. M. 2010, ApJ, 719, 790
- Miley et al. (1985) Miley, G. K., Neugebauer, G., & Soifer, B. T. 1985, ApJ, 293, L11
- Morganti et al. (2011) Morganti, R., Holt, J., Tadhunter, C., et al. 2011, arXiv:1109.0630
- Narayanan et al. (2010) Narayanan, D., Dey, A., Hayward, C. C., et al. 2010, MNRAS, 407, 1701
- Neugebauer et al. (1979) Neugebauer, G., Oke, J. B., Becklin, E. E., & Matthews, K. 1979, ApJ, 230, 79
- Neugebauer et al. (1984) Neugebauer, G., Habing, H. J., van Duinen, R., et al. 1984, ApJ, 278, L1
- Norris et al. (2011) Norris, R. P., Afonso, J., Cava, A., et al. 2011, ApJ, 736, 55
- Papovich et al. (2006) Papovich, C., Moustakas, L. A., Dickinson, M., et al. 2006, ApJ, 640, 92
- Papovich et al. (2007) Papovich, C., Rudnick, G., Le Floc’h, E., et al. 2007, ApJ, 668, 45
- Patten et al. (2006) Patten, B. M., Stauffer, J. R., Burrows, A., et al. 2006, ApJ, 651, 502
- Petric et al. (2011) Petric, A. O., Armus, L., Howell, J., et al. 2011, ApJ, 730, 28
- Pier & Krolik (1992) Pier, E. A. & Krolik, J. H. 1992, ApJ, 401, 99
- Polletta et al. (2008) Polletta, M., Weedman, D., Hönig, S., Lonsdale, C. J., Smith, H. E., & Houck, J. 2008, ApJ, 675, 960
- Polletta et al. (2007) Polletta, M., et al. 2007, ApJ, 663, 81
- Polletta et al. (2006) Polletta, M., et al. 2006, ApJ, 642, 673
- Pope et al. (2008) Pope, A., et al. 2008, ApJ, 675, 1171
- Pozzi et al. (2012) Pozzi, F., Vignali, C., Gruppioni, C., et al. 2012, arXiv:1204.1152
- Richards et al. (2002) Richards, G. T., Fan, X., Newberg, H. J., et al. 2002, AJ, 123, 2945
- Richards et al. (2009) Richards, G. T., et al. 2009, AJ, 137, 3884
- Rieke et al. (2009) Rieke, G. H., et al. 2009, ApJ, 692, 556
- Rigby et al. (2008) Rigby, J. R., Marcillac, D., Egami, E., et al. 2008, ApJ, 675, 262
- Roche et al. (2003) Roche, N. D., Dunlop, J., & Almaini, O. 2003, MNRAS, 346, 803
- Sajina et al. (2005) Sajina, A., Lacy, M., & Scott, D. 2005, ApJ, 621, 256
- Salvato et al. (2009) Salvato, M., et al. 2009, ApJ, 690, 1250
- Salvato et al. (2011) Salvato, M., Ilbert, O., Hasinger, G., et al. 2011, ApJ, 742, 61
- Sanders et al. (2007) Sanders, D. B., et al. 2007, ApJS, 172, 8
- Sanders et al. (1999) Sanders, D. B. 1999, ASP, IAU Symp. 194, 25
- Sanders et al. (1989) Sanders, D. B., Phinney, E. S., Neugebauer, G., Soifer, B. T., & Matthews, K. 1989, ApJ, 347, 29
- Sani & Nardini (2011) Sani, E., & Nardini, E. 2011, arXiv:1112.5170
- Santini et al. (2009) Santini, P., et al. 2009, A&A, 504, 751
- Schneider et al. (2010) Schneider, D. P., et al. 2010, AJ, 139, 2360
- Scoville et al. (2007) Scoville, N., et al. 2007, ApJS, 172, 1
- Seymour et al. (2007) Seymour, N., et al. 2007, ApJS, 171, 353
- Simpson et al. (2006) Simpson, C., Martínez-Sansigre, A., Rawlings, S., et al. 2006, MNRAS, 372, 741
- Skrutskie et al. (2006) Skrutskie, M. F., Cutri, R. M., Stiening, R., et al. 2006, AJ, 131, 1163
- Smail et al. (2004) Smail, I., Chapman, S. C., Blain, A. W., & Ivison, R. J. 2004, ApJ, 616, 71
- Somerville et al. (2008) Somerville, R. S., Hopkins, P. F., Cox, T. J., Robertson, B. E., & Hernquist, L. 2008, MNRAS, 391, 481
- Springel et al. (2005) Springel, V., Di Matteo, T., & Hernquist, L. 2005, MNRAS, 361, 776
- Steidel et al. (2003) Steidel, C. C., Adelberger, K. L., Shapley, A. E., et al. 2003, ApJ, 592, 728
- Steidel et al. (2004) Steidel, C. C., Shapley, A. E., Pettini, M., et al. 2004, ApJ, 604, 534
- Stern et al. (2005) Stern, D., et al. 2005, ApJ, 631, 163
- Stern et al. (2012) Stern, D., Assef, R. J., Benford, D. J., et al. 2012, arXiv:1205.0811
- Szokoly et al. (2004) Szokoly, G. P., et al. 2004, ApJS, 155, 271
- Tielens et al. (1979) Tielens, A. G. G. M., Miley, G. K., & Willis, A. G. 1979, A&AS, 35, 153
- Tozzi et al. (2006) Tozzi, P., et al. 2006, A&A, 451, 457
- Treister et al. (2009) Treister, E., Cardamone, C. N., Schawinski, K., et al. 2009, ApJ, 706, 535
- Treister et al. (2006) Treister, E., et al. 2006, ApJ, 640, 603
- Treister & Urry (2005) Treister, E., & Urry, C. M. 2005, ApJ, 630, 115
- Treister & Urry (2011) Treister, E., & Urry, C. M. 2011, arXiv:1112.0320
- Ueda et al. (2003) Ueda, Y., Akiyama, M., Ohta, K., & Miyaji, T. 2003, ApJ, 598, 886
- Vandame (2002) Vandame, B. 2002, Proc. SPIE, 4847, 123
- Veilleux et al. (2009) Veilleux, S., Rupke, D. S. N., Kim, D.-C., et al. 2009, ApJS, 182, 628
- Werner et al. (2004) Werner, M. W., Roellig, T. L., Low, F. J., et al. 2004, ApJS, 154, 1
- Worsley et al. (2004) Worsley, M. A., Fabian, A. C., Barcons, X., et al. 2004, MNRAS, 352, L28
- Worsley et al. (2005) Worsley, M. A., Fabian, A. C., Bauer, F. E., et al. 2005, MNRAS, 357, 1281
- Wright et al. (2010) Wright, E. L., Eisenhardt, P. R. M., Mainzer, A. K., et al. 2010, AJ, 140, 1868
- Wuyts et al. (2008) Wuyts, S., et al. 2008, ApJ, 682, 985