Two populations of transition discs?
Abstract
We examine the distribution of transition discs as a function of mm flux. We confirm that as expected in any model in which most primordial discs turn into transition discs and in which mm flux declines with time, transition discs have lower mm fluxes on average than primordial discs. However, we find that the incidence of transition discs does not, as expected, fall monotonically towards large mm fluxes and we investigate the hypothesis that these mm bright transition discs may have a distinct physical origin. We find that mm bright transition discs occupy a separate region of parameter space. Transition discs in the bright mm sub-sample have systematically higher accretion rates than those in the faint mm sub-sample, along with being systematically weighted to earlier spectral types.
keywords:
planetary systems: protoplanetary discs - stars: pre-main-sequence.1 Introduction
Protoplanetary discs with apparent opacity deficits at Near-IR (NIR) wavelengths were first identified in early samples by Strom et al. (1989) and Skrutskie et al. (1990). The lack of protoplanetary discs observed to be globally optically thin at all radii (e.g. Ercolano et al. 2011; but see also Currie & Sicilia-Aguilar 2011), led to the interpretation that, if inner-hole objects indeed represent an evolutionary stage from a primordial, optically thick state to a disc-less state, then disc dispersal must preferentially occur from the inside-out. Under this assumption they were consequently christened ‘transition discs’, and their rarity allowed the calculation of a disc clearing time-scale of around of a disc’s primordial lifetime for both solar type stars (e.g. Kenyon & Hartmann 1995; Luhman et al. 2010), and low mass stars (e.g. Ercolano et al. 2009, 2011). These transition disc observations have led to numerous models which attempt to explain their origin. One category of models explains this opacity deficit in terms of clearing of both gas and dust, for example by: planet formation (e.g. Armitage & Hansen 1999); photoevaporation (e.g. Clarke et al. 2001) and MRI driven winds (Suzuki & Inutsuka 2009). The ofther category of models instead posits only a deficit of dust opacity in the inner disc, resulting from: grain growth (e.g. Dullemond & Dominik 2005); dust filtration by planets (e.g. Rice et al. 2006) or photophoresis (Krauss et al., 2007). At this stage it is not clear observationally or theoretically whether one of these processes dominate, whether they are all occurring, or transition discs are caused by some yet unidentified mechanism.
The observed sample of transition discs has now grown to a sufficiently large size that one can begin to compare the properties of these discs to the models. Owen et al. (2011, 2012) compared the predictions of X-ray photoevaporation to the sample of observed transition discs in the and plane and identified that only approximately were consistent with being created through photoevaporation: namely, those with small holes AU and low accretion rates M⊙ yr-1. Furthermore, several other authors have used properties such as the surface density profile, presence of gas and/or dust in the inner hole, or disc mass to postulate the origin of individual transition discs (e.g. Cieza et al. 2008, 2010; Alexander & Armitage 2009; Espaillat et al. 2010).
Perhaps the most surprising recent development is that presented by Andrews et al. (2011); looking at discs with large holes (and therefore imageable in the sub-mm) they calculated that of discs in the upper quartile of the sub-millimetre (mm) flux distribution for Class II discs may be identified as transition discs. This result is contrary to our inference that transition discs represent an evolutionary stage where discs are transitioning from a primordial to disc-less state at the end of their lifetimes, as mm flux is observed to decrease with age (e.g. Andrews & Williams 2005, 2007). In this scenario one would have naively expected a transition disc fraction that decreases monotonically with increasing mm flux.
The analysis of statistically significant studies of observed transition disc samples has only recently become possible, allowing us to investigate their properties and identify possible sub-samples, taking care not to throw away the valuable information contained within upper-limits (using Survival statistics e.g. Feigelson & Nelson 1985). In this letter we use a large sample of transition discs (not just those which are imageable in the sub-mm) collected from the literature, to investigate the ratio of transition discs to primordial discs as a function of the full mm flux distribution. We can then compare this sample to both the (Andrews et al., 2011) result and our naive theoretical assumptions as to what it should be (i.e. peaked a low mm flux and then monotonically decreasing). In Section 2 we describe the transition disc sample and look at its basic properties. In Section 3 we discuss the more detailed properties and possible sub-samples of the transition disc population and in Section 4 we draw our conclusions.
2 Sample
We have collected a large sample of transition discs from the literature that have measured mm fluxes; we choose to use 1.3mm fluxes instead of 880m fluxes as the former are more readily available for the collected data. In the case that only 880m or 1.2mm measurements are available we use equations presented in Cieza et al. (2008) (used to calculate disc mass - based on Andrews & Williams 2005, 2007) to convert measurements into 1.3mm fluxes, and then we normalise all fluxes to a common distance of 140 pc using the Spitzer c2d distances. The transition discs used in the sample are taken from: Andrews et al. (2011, 2012); Brown et al. (2009); Calvet et al. (2002, 2005); Cieza et al. (2008, 2010); Espaillat et al. (2007, 2010); Hughes et al. (2010); Kim et al. (2009); Merín et al. (2010); Najita et al. (2007).
Many of these articles discuss the same transition discs, so we take care to remove multiple instances of the same source. In addition we remove any ‘transition’ disc which is caused by a known close stellar companion (e.g. CoKu-Tau 4 Ireland & Kraus 2008). The total sample includes a total of 76 objects classified as transition discs by the various authors. For the 76 sources that make up our sample, 60 sources have available accretion rate and spectral type determinations; additionally 32 sources have had inner holes measured either through spectral type fitting and/or mm imaging.
It is worth noting that Cieza et al. (2008, 2010) do not fit their sources for inner holes, and they use a transition disc definition that is based on measurements of the Spitzer colours. However, Cieza et al. (2010) do list a ‘turn-off wavelength’ representative of the dust temperature for the inner hole; thus we follow Owen et al. (2011, 2012) in turning these wavelengths into conservative upper limits. ‘Turn-off wavelengths’ of 8m and m are assigned inner hole radii of AU and AU, respectively. This increases the number of objects with any kind of inner hole measurement to 50 objects. We caution in the case of the four sources that overlap between Cieza et al. (2010) and Merín et al. (2010), only two of these sources are identified as transition discs with inner holes by Merín et al. (2010). Therefore, it is important to bear in mind that the sources classified by Cieza et al. (2008, 2010) may not all be discs with inner holes, and the only definitive method of inner hole measurement is imaging.
2.1 The millimetre distribution
We use the transition disc sample to construct the Kaplan-Meier product-limit (KM) estimator (an estimate of the survival probability e.g. Feigelson & Nelson 1985) for the mm distribution of transition discs. Furthermore, to compare the transition disc sample to a sample of primordial discs we use the sample of Taurus (Andrews & Williams, 2005); Ophiuchus(Andrews & Williams, 2007); Chameleon (Henning et al., 1993) & Lupus (Nuernberger et al., 1997) to construct the KM estimator for the mm distribution of class II (transition discs have been removed) objects. Since our class II sample is exclusively from young (1-2Myr) clusters we further restrict our comparison to transition discs in the following young clusters: Taurus, Ophiuchus, Serpens, Chamelon & Lupus, as the mm distribution of class II discs does appear to evolve with time (Lee et al., 2011; Mathews et al., 2012). This leaves us with 48 transition discs to compare with our class II sample, although we note the mm distribution of these 48 discs is statistically indistinguishable from the total sample (dashed line in Figure 1), thus we use the total sample later when looking at the properties of transition discs.
We show the two survival distribution functions for the transition discs (thick dashed line) and primordial discs (thick solid line) with 1 errors in the KM estimator shown as error bars in Figure 1.
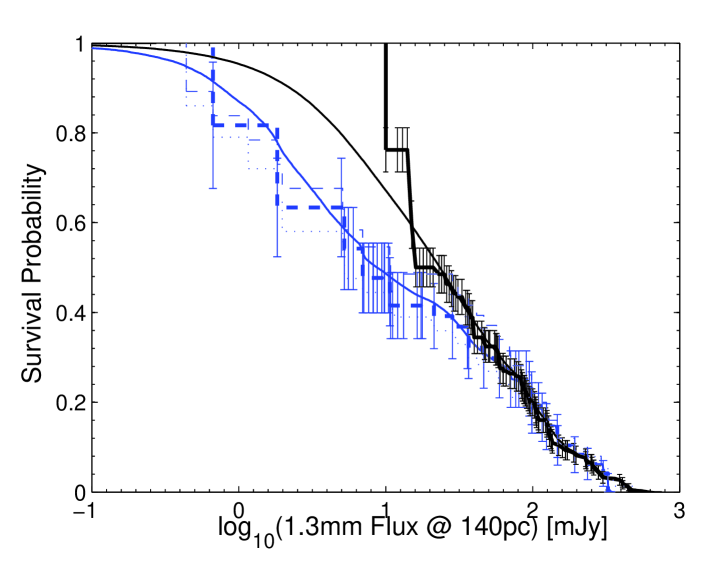
We note that removing the Cieza et al. transition discs - all of which may not be discs with cleared inner holes, as their SED’s were not fit for inner holes as discussed previously - from the sample (dotted blue line in Figure 1) does not significantly affect the resulting survival distribution. As survival statistics does not account for the fact astronomical measurements contain errors in measurements and upper limits (Feigelson & Nelson, 1985) which can mask an observational cut-off in a luminosity functions with true cut-off in a luminosity function, we compute smoothed distribution functions by broadening each measurement or upper limit with an appropriate Gaussian or error function, allowing us to make sure a hard observational cut-off is not driving our conclusions seen in the data These smoothed distribution functions agree with those constructed from the KM estimator, indicating the use of exact upper limits in the survival analysis is not significantly affecting the result and our results are representative of the true luminosity functions.
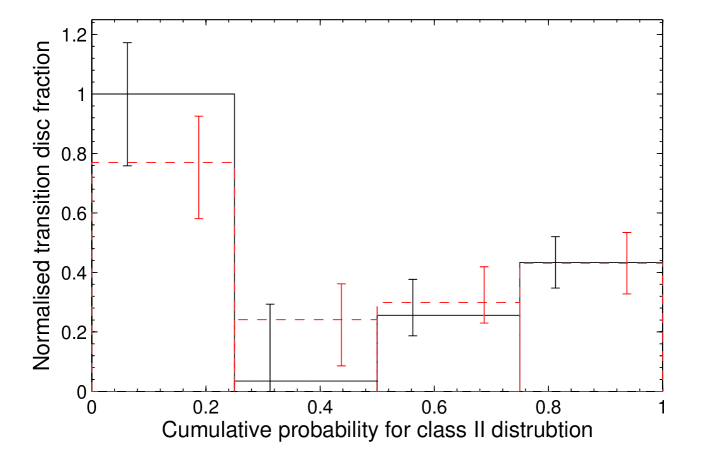
A glance at Figure 1 clearly shows that the mm distributions of primordial (class II) and transition discs are different, and the hypothesis that they come from the same underlying distribution can be quantitatively rejected at a level of 5.7 and 6.4 using the Gehan and logrank hypothesis tests, respectively. Furthermore, we can use the smoothed distribution functions to perform a Kolmogorov-Smirnov (KS) between the two populations, where we can reject the null hypothesis at the level of 2.4, again indicating the use of survival statistics is appropriate for this data set. Additionally, we can use these two distributions to construct the relative fraction of transition discs to primordial discs in each quartile of the class II mm distribution function, using both the KM estimator and the smoothed distribution function. This result is shown in Figure 2, where the relative fraction is scaled to unity in the lower quartile.
Figure 2 shows a clear excess of transition discs in the lower quartile of the mm distribution, and a distribution function that is inconsistent with one that monotonically falls with increasing mm flux. Note that the transition disc and primordial samples do not come from the same star forming regions. If we sub-sampled the transition discs such that they are also in the come from the regions with complete class II mm samples, the sample size would be too low to be statistically useful. Therefore, Figure 2 only contains information on the relative ratios of transition discs to primordial discs in different quartiles of the primordial disc mm flux distribution.
3 Discussion
The high fraction of transition discs at large mm fluxes is difficult to explain with the canonical view of transition objects as discs caught in a final evolutionary stage before dispersal. In this picture one would expect a steeply decreasing transition disc fraction with increasing mm flux, as the latter also decreases with time. The high transition disc fraction at large mm flux contradicts this simple view and can be interpreted as evidence that either: (i) ‘transition discs’ are a misnomer and these objects do not physically represent an evolutionary stage from disc-bearing and disc-less systems; or (ii) discs with inner holes can have multiple physical origins and the two populations shown in the data indicate two distinct classes of objects. The latter hypothesis will be further investigated in the following sections.
3.1 Spectral type distribution
Perhaps the simplest interpretation of the observed distribution of transition discs with mm-flux is the existence of two population of transition discs, one peaked at low mm fluxes which would be consistent with the classical picture of transition discs i.e. disc clearing, and a population of inner-hole objects with large mm fluxes which has a different physical origin. If we split the transition disc sample into two sub-samples about the median Class II mm flux, 42 and 34 objects fall in the low- and high-mm flux sub-samples, respectively. Discs with upper limits greater than the median value are placed in the sub-sample of discs with high mm fluxes, although we note this only represents a very small fraction (4 objects) of the total sub-sample.
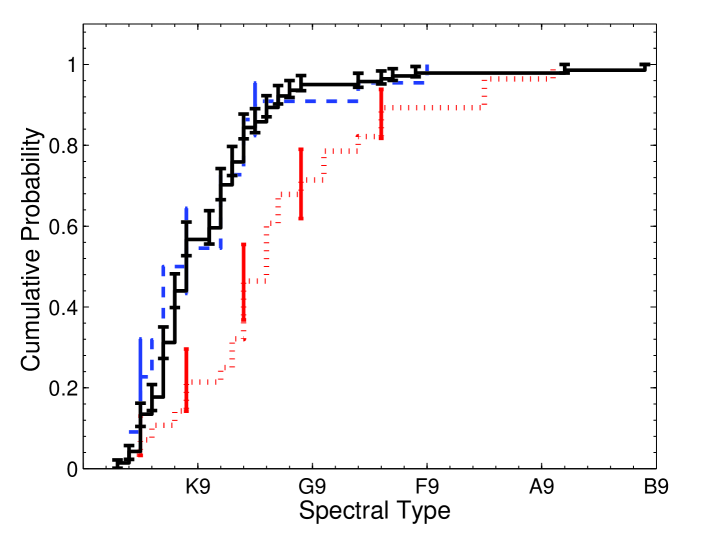
We can test the hypothesis that the mm faint transition discs represent a later evolutionary phase in the life of primordial discs by checking that they share the same distribution of spectral types as the primordial disc population111This test also assumes that there is no significant variation in transition disc lifetime across the limited range of spectral types (M to G ) in the samples.. The similarity in spectral type distribution between the mm faint transition discs and the primordial disc sample is demonstrated by the dashed and solid lines in Figure 3: a KS test reveals that the two distributions have a high probability of being drawn from the same population (we can only reject the hypothesis they are different at ). On the other hand, the distribution of spectral types for the mm bright sub-sample of transition discs is clearly different from that of the primordial population and the hypothesis that these are drawn from the same population can be rejected at the confidence level. Clearly the bright mm sample contains a much higher proportion of stars of earlier spectral type than the primordial (or mm faint transition disc) sample.
This finding needs to be interpreted with care. The primordial sample contains a large sample of objects from Taurus-Auriga ( 40%) which is well known (e.g. Goodwin et al. 2004) to be deficient in stars of earlier spectral type. On the other hand, the transition discs are a serendipitous sample culled from clouds at a range of distances and there can be expected to be an obvious over-representation of systems of earlier spectral type since these are more luminous. However, it should be stressed that these biases do not affect the obvious difference in spectral type distributions between the mm bright & faint transition discs since mm flux forms no part of the object selection and identification.
It is also worth noting that although the mm bright transition discs contain a high fraction of earlier type stars, there is also a significant population of mm bright discs at late spectral types (see Figure 5). In fact, if we construct a figure similar to Figure 2 but include only stars of spectral type later than both & 4500K we obtain a qualitatively similar result, with a concentration of sources in the lowest quartile and a flat or gently rising distribution in the other quartiles.
3.2 Transition disc properties
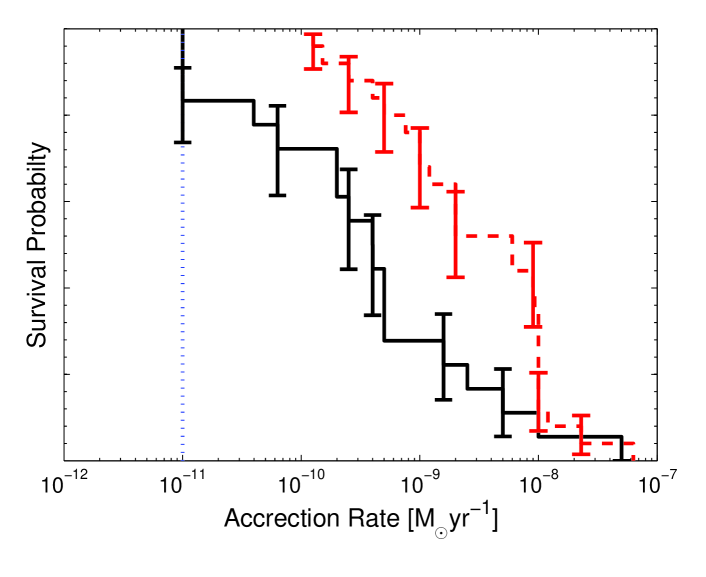
We now examine the derived properties of transition disc in the two sub-samples. Figure 4 shows the distributions of accretion rates. It is clear that distributions of accretion rates are different for the two transition disc sub-samples, with the mm bright transition discs having considerable higher accretion rates. We confirm the difference in the distributions at the level of and for the accretion rates using the Gehan and logrank hypothesis tests, respectively. We do note that the mm bright sample does appear to have in general larger inner hole radii (see Figure 5) , although as the majority of inner holes are not measured or fit for the mm faint sample we do not draw any statistical conclusions.
Along with looking at the individual distribution functions for inner hole statistics we can look for correlations between the transition disc statistics and the parameter space they occupy in the individual sub-samples. It is of particular interest in order to test the models to study the distribution of observed transition discs in the – plane as shown in the upper panel of Figure 5. We see that, broadly speaking, the mm faint objects (filled symbols) occupy the region of parameter space identified by Owen et al. (2012) as being conceivably produced by photoevaporation whereas almost all the bright mm objects (open symbols) lie outside this region. We also (lower panel) consider the relationship between inner hole radius and stellar effective temperature in the two sub-samples. We note that in both panels it is impossible to draw any conclusions about correlations between these properties within the faint mm sample on account of the large number of upper limits in hole size and accretion rate: a large fraction of our faint mm sample is drawn from the sample of Cieza et al. (2010) for which we have crudely estimated limits on the hole size (see Section 2).
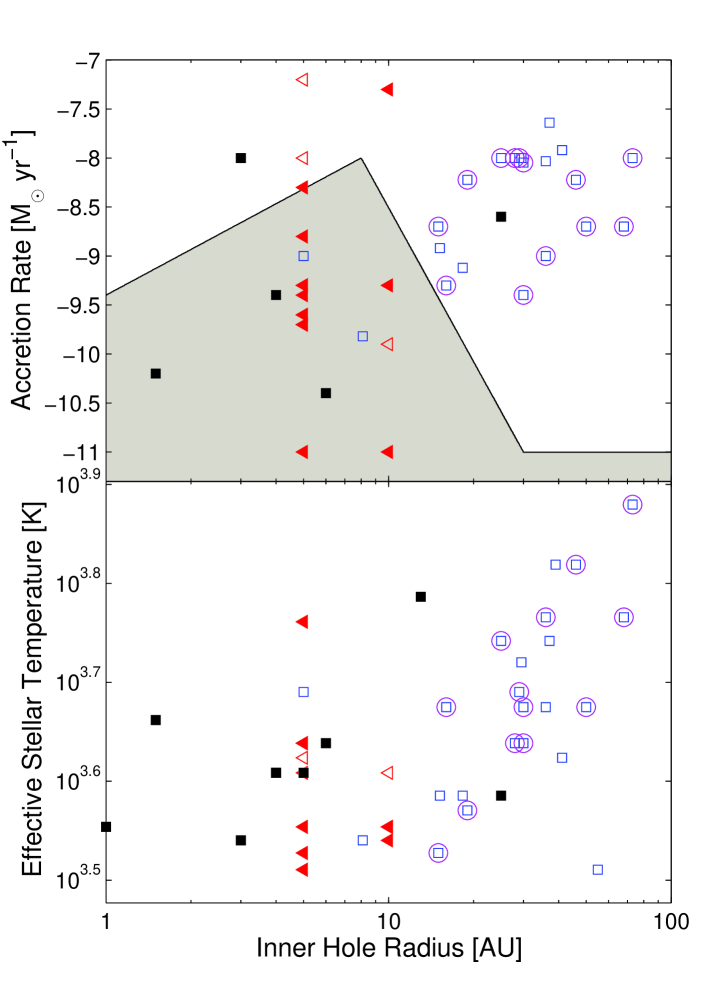
However, correlations do appear in the mm bright transition discs, where there is clear evidence of a correlation between inner hole radius and accretion rate (we can reject the null hypothesis of no correlation at the level of 2.4), with large holes generally having higher accretion rates. Such a correlation was noted by Kim et al. (2009) with a much smaller sample of transition discs, and it is confirmed here. Kim et al. (2009) also noted correlations between accretion rate & inner hole size with properties of the underlying star. The lower panel of Figure 5 shows clear evidence for a correlation between inner hole radius and spectral type (a crude proxy for stellar mass) in the mm bright sub-sample (we can reject the null hypothesis of no correlation at the level of 2.5). Moreover, it also clearly shows that the holes in the mm bright discs are systematically larger than those in the mm faint discs at all spectral types and therefore the difference in inner hole radii shown in the left hand panel of Figure 4 is not purely a result of the mm bright discs being of earlier spectral type. We note in passing that the correlations are still present (non-zero correlation coefficient) when one only considered those discs where the inner hole radius has been measured by imaging although it is less statistically significant where we can only reject the null hypothesis of no correlations at the 1.3 level in both cases. Finally we note that there is no evidence for correlations with mm flux for the inner hole radius, accretion rate and spectral type in the two individual sub-samples.
We speculate the interpretation of these results is that transition discs are not dominated by one physical mechanism, but there are perhaps two mechanisms at play. One producing transition discs in mm faint discs (likely associated with the end of the discs life) with low accretion rates and small holes, with the most likely origin being X-ray photoevaporation (Owen et al. 2011). The second mechanism may not be associated with the end of the disc’s life at all, or the processes itself cause a high mm flux; the high accretion rates and presence of small dust grains inside the mm cavities (Dong et al. 2012) point to planet formation (e.g. Rice et al. 2006). However, we caution that much theoretical work must be done to reconcile these observations with the planet formation scenario since - in addition to reproducing the correlations suggested in this work - there is considerable fine tuning required in the dust distributions that can match both the SED and scattered light/mm images.
4 Summary & Conclusions
We have used a sample of transition discs collected from the literature to look at their statistical properties, and compare their mm properties to those of primordial discs (Class II objects) in Taurus Auriga. We demonstrate that transition discs are concentrated towards the lower end of the mm flux distribution of primordial discs, as would be expected in any model in which disc holes develop at a later evolutionary stage. However, we find a significant minority of transition discs at all mm fluxes including very high mm fluxes similar to the incidence of transition discs in the upper quartile of the primordial disc mm distribution noted by Andrews et al. (2011).
We explore the hypothesis that the mm bright transition discs might have a distinct physical origin by analysing the properties of two sub-samples of transition discs, split at the median of the primordial disc mm distribution. Virtually all the mm bright transition discs have high accretion rates and large inner holes. The mm faint sub-sample has a range of accretion rates and systematically lower hole sizes and broadly occupies the region of the accretion rate, hole size plane that is consistent with X-ray photoevaporation models. The two sub-samples differ in accretion rate and inner hole size distributions at the level. Furthermore, early type stars are over represented in the mm bright sample compared to the primordial and faint mm transition discs. Nevertheless, the difference in properties cannot be solely ascribed to differences in host stars. A flat tail of mm bright sources are found at all spectral types and these have systematically larger holes than mm faint objects of the same spectral type. Within the mm bright sub-sample there is a strong correlation between inner hole size and spectral type (uncertainties in hole sizes for many of the mm faint objects do not allow us to assess this correlation within the mm faint sub-sample).
Finally, we ask whether there are any obvious selection effects that drive the observed association between mm bright sources and large holes. We believe there are no factors that would militate against the identification of small holes in discs that are mm bright. Moreover, since the evidence of even the largest inner holes in the sample is based on spectral dips at m, then the detection of such a hole would not be undermined by a low flux at mm. We therefore do not believe that it is a detectability issue that is driving this association. We thus need to ask a) why mm bright discs apparently do not form small holes in small and large dust grains and b) is there a population of discs with such large holes that they are classified as disc-less sources on the basis of their near-infrared to mm SEDs? This latter issue was raised by Owen et al (2011) although their subsequent work on Xray photoevaporation (Owen et al 2012) suggested that the process of ‘thermal sweeping’ should rapidly disperse such low surface density relic discs. We also notes that some discs may manifest holes in mm images while still showing high levels high levels of NIR excess as hinted by Andrews et al. (2011), whether one would class these discs within the same existing ‘transition’ disc framework is unclear and certainly a matter for future debate.
We stress that these findings are necessarily suggestive rather than conclusive and underline avenues of future investigation. Two obvious shortcomings are i) the lack of fitted inner hole radii in a number of transition discs in the literature and ii) the lack of good control samples for the mm properties of primordial discs at a range of spectral types. Clearly ALMA will assist in the latter respect.
Acknowledgments
We thank the anonymous referee for comments which helped improve this work. We thank Barbara Ercolano, Chris Thompson and Mike Irwin for useful discussions. JO is grateful to hospitality from the IoA Cambridge, during the completion of this work.
References
- Alexander & Armitage (2009) Alexander, R. D., & Armitage, P. J. 2009, ApJ, 704, 989
- Andrews & Williams (2005) Andrews, S. M., & Williams, J. P. 2005, ApJ, 631, 1134
- Andrews & Williams (2007) Andrews, S. M., & Williams, J. P. 2007, ApJ, 671, 1800
- Andrews et al. (2011) Andrews, S. M., Wilner, D. J., Espaillat, C., et al. 2011, ApJ, 732, 42
- Andrews et al. (2012) Andrews, S. M., Wilner, D. J., Hughes, A. M., et al. 2012, ApJ, 744, 162
- Armitage & Hansen (1999) Armitage, P. J., & Hansen, B. M. S. 1999, Nature, 402, 633
- Brown et al. (2009) Brown, J. M., Blake, G. A., Qi, C., Dullemond, C. P., Wilner, D. J., & Williams, J. P. 2009, ApJ, 704, 496
- Calvet et al. (2002) Calvet, N., D’Alessio, P., Hartmann, L., Wilner, D., Walsh, A., & Sitko, M. 2002, ApJ, 568, 1008
- Calvet et al. (2005) Calvet, N., et al. 2005, ApJL, 630, L185
- Cieza et al. (2008) Cieza, L. A., Swift, J. J., Mathews, G. S., & Williams, J. P. 2008, ApJL, 686, L115
- Cieza et al. (2010) Cieza, L. A., et al. 2010, ApJ, 712, 925
- Clarke et al. (2001) Clarke, C. J., Gendrin, A., & Sotomayor, M. 2001, MNRAS, 328, 485
- Currie & Sicilia-Aguilar (2011) Currie, T., & Sicilia-Aguilar, A. 2011, ApJ, 732, 24
- Dong et al. (2012) Dong, R. et al. 2012, ApJ, 750, 161
- Dullemond & Dominik (2005) Dullemond, C. P., & Dominik, C. 2005, A&A, 434, 971
- Ercolano et al. (2009) Ercolano, B., Clarke, C. J., & Robitaille, T. P. 2009, MNRAS, 394, L141
- Ercolano et al. (2011) Ercolano, B., Clarke, C. J., & Hall, A. C. 2011, MNRAS, 410, 671
- Espaillat et al. (2007) Espaillat, C., Calvet, N., D’Alessio, P., et al. 2007, ApJL, 670, L135
- Espaillat et al. (2010) Espaillat, C., et al. 2010, ApJ, 717, 441
- Feigelson & Nelson (1985) Feigelson, E. D., & Nelson, P. I. 1985, ApJ, 293, 192
- Henning et al. (1993) Henning, T., Pfau, W., Zinnecker, H., & Prusti, T. 1993, A&A, 276, 129
- Hughes et al. (2010) Hughes, A. M., et al. 2010, AJ, 140, 887
- Ireland & Kraus (2008) Ireland, M. J., & Kraus, A. L. 2008, ApJL, 678, L59
- Kenyon & Hartmann (1995) Kenyon, S. J., & Hartmann, L. 1995, ApJS, 101, 117
- Kim et al. (2009) Kim, K. H., et al. 2009, ApJ, 700, 1017
- Krauss et al. (2007) Krauss, O., Wurm, G., Mousis, O., Petit, J.-M., Horner, J., & Alibert, Y. 2007, A&A, 462, 977
- Lee et al. (2011) Lee, N., Williams, J. P., & Cieza, L. A. 2011, ApJ, 736, 135
- Luhman et al. (2010) Luhman, K. L., Allen, P. R., Espaillat, C., Hartmann, L., & Calvet, N. 2010, ApJS, 186, 111
- Mathews et al. (2012) Mathews, G. S., Williams, J. P., & Ménard, F. 2012, ApJ, 753, 59
- Merín et al. (2010) Merín, B., et al. 2010, ApJ, 718, 1200
- Najita et al. (2007) Najita, J. R., Strom, S. E., & Muzerolle, J. 2007, MNRAS, 378, 369
- Nuernberger et al. (1997) Nuernberger, D., Chini, R., & Zinnecker, H. 1997, A&A, 324, 1036
- Owen et al. (2011) Owen, J. E., Ercolano, B., & Clarke, C. J. 2011, MNRAS, 412, 13
- Owen et al. (2012) Owen, J. E., Clarke, C. J., & Ercolano, B. 2012, MNRAS, 422, 1880
- Rice et al. (2006) Rice, W. K. M., Armitage, P. J., Wood, K., & Lodato, G. 2006, MNRAS, 373, 1619
- Skrutskie et al. (1990) Skrutskie, M. F., Dutkevitch, D., Strom, S. E., Edwards, S., Strom, K. M., & Shure, M. A. 1990, AJ, 99, 1187
- Suzuki & Inutsuka (2009) Suzuki, T. K., & Inutsuka, S.-i. 2009, ApJL, 691, L49
- Strom et al. (1989) Strom, K. M., Strom, S. E., Edwards, S., Cabrit, S., & Skrutskie, M. F. 1989, AJ, 97, 1451