Agent-based simulations of emotion spreading in online social networks
Milovan Šuvakov1,2, David Garcia3, Frank Schweitzer3 and Bosiljka Tadić1
1Department of theoretical physics; Jožef Stefan Institute;
Box 3000 SI-1001 Ljubljana Slovenia; 2Institute of Physics, Belgrade, Serbia, 3Chair of Systems Design, ETH Zürich, Switzerland
Quantitative analysis of empirical data from online social networks reveals group dynamics in which emotions are involved [1]. Full understanding of the underlying mechanisms, however, remains a challenging task. Using agent-based computer simulations, in this paper we study dynamics of emotional communications in online social networks. The rules that guide how the agents interact are motivated, and the realistic network structure and some important parameters are inferred from the empirical dataset of MySpace social network. Agent’s emotional state is characterized by two variables representing psychological arousal—reactivity to stimuli, and valence—attractiveness or aversiveness, by which common emotions can be defined. Agent’s action is triggered by increased arousal. High-resolution dynamics is implemented where each message carrying agent’s emotion along the network link is identified and its effect on the recipient agent is considered as continuously aging in time. Our results demonstrate that (i) aggregated group behaviors may arise from individual emotional actions of agents; (ii) collective states characterized by temporal correlations and dominant positive emotions emerge, similar to the empirical system; (iii) nature of the driving signal—rate of user’s stepping into online world, has profound effects on building the coherent behaviors, which are observed for users in online social networks. Further, our simulations suggest that spreading patterns differ for the emotions, e.g., “enthusiastic” and “ashamed”, which have entirely different emotional content. All data used in this study are fully anonymized.
1 Introduction
The article “Postmodernity and affect: All dressed up with no place to go” published by Lawrence Grossberg in 1988 addresses the altered view of emotions in the postmodern society [2]. But “the place to go” has considerably changed since. Instead of meeting other people at preferred locations, the Internet has become the most important “place” to show oneself dressed up, either as a real-name person or with a fake identity, but still with certain desires, goals, or feelings. In fact, the Internet is increasingly recognized not only as a tool that people use, but as an environment where they function and live. The amount of time, energy and emotions spent on using online social networks [1, 3, 4, 5, 6], online games [7, 8], emails [9], blogs [10] and chats [11] are getting unprecedented scores. Hence the social implications of the Internet [12, 13, 14], the intricate relationships between the real and the virtual worlds [7, 8], and mechanisms governing new techno-social phenomena [15, 16, 17, 18, 19] pose new challenges for scientific research.
The social sciences faced with the problem of transferring concepts of “offline” human behaviors into the online world of social networks [20]. The question whether humans behave completely different when becoming “users” is tackled in various empirical investigations [12, 21, 14, 22, 11, 23]. A particular question regards the emotional interaction between users in online social networks: How is emotional influence exerted if mostly written text is exchanged? What kind of emotions are actually involved? What is the role of the underlying network structure in spreading emotions? Therefore, study of the stochastic processes related with stepping of the users into the virtual world and spreading of their behaviors and emotions through the online social network, are of key importance.
In our recent work [1], hereafter referred as I, we have compiled and analysed large dataset containing the dialogs from MySpace social network, currently ranked as the fourth largest social networking site after Facebook, Google+, and Linkedin. Combining the methods of statistical physics with machine learning approach of text analysis, by which the emotional content of the messages was extracted, we have found strong evidence of user’s collective behaviors in which emotions are involved. Specifically, bursts of emotional messages occur, which obey scaling laws and temporal correlations. Furthermore, dominance of positive emotions and specific structure of the dialogs-based network was revealed. In this work we use agent-based framework with emotional agents [24], and explicitly investigate the mechanisms of the emotional influence between agents in the online social network, which is underlying the observed collective behaviors of users.
In general, we observe that many models of social interaction are based on the KISS approach (“Keep it simple and stupid”). In contrast to these simple approaches, our model is specifically designed to describe the emotional interaction in MySpace, which is certainly different from other online platforms, such as blogs, or fora. We do not try to simplify the system and this way get rid of all the specific features. On the contrary, we want to build up a model that as much as possible includes these specific features, such as, e.g., directed communication through message walls. Consequently, some of the assumptions used in our model read quite complicated on the first glimpse, but try to capture real interactions in larger detail. This restricts of course the possible generalization to other online platforms, which is not the aim of the paper.
Agent based approaches are gaining importance among the psychologist community [25, 26]. Our modeling framework has already proved its applicability for various online communications, e.g. emotional influence in chats [11], product reviews [24, 44] and dynamics of blogs [23]. It is based on the concept of Brownian agents [27] which are described by two scalar variables, valence that describes the pleasure ( attractiveness and aversiveness) associated with an emotion, and arousal that describes the activity level induced by the emotion. Our focus on valence and arousal to quantify emotions is motivated by Russel’s model [28, 29, 30] from psychology. In our modeling framework stochastic equations for both variables are proposed to account for random influences. Their deterministic parts result from the direct and indirect emotional interaction between agents and needs to be specified according to the online system considered. Importantly, the nonlinear functions of the deterministic part capture the response of an agent to emotional information. The latter is modeled as a time-dependent field that is generated by agents posting emotional text, this way comprising valence and arousal of different agents. The response functions specify what of this information field actually affects a specific agent. While in some cases, such as fora communication, a mean-field approach is most appropriate, i.e. all agents can see all information, the new feature of the model proposed here is in the network communication, i.e. agents can only see very specific information of “friends”, which are different for every agent. This makes the model more complicated compared to fora communication, but it still follows the general outline of the framework of emotional influence. In this respect, mathematical complexity of the present model, with the emotional agents on a fixed network, lies in between two previously studied cases. On one side, the dynamics of Blogs where the agent’s actions cause the network on which they are situated to evolve [31, 32], and on the other, the product review communications where the agents are not exposed to any geometrical constraints [24].
The model proposed in this paper is linked to empirical observations in MySpace in various ways. First, it takes some empirical findings as input for the computer simulations, in particular the network of interactions which has been extracted from the dataset [1]. To have this as a realistic feature is quite important because hidden topology features, such as link correlations at next-neighborhood level, affect the spreading of information and other relaxation dynamics in complex networks [33, 34, 35]. A second important empirical input regards the temporal activity patterns of users, which are known to display some universal features across different communication media [36, 37, 38, 18, 19, 7].
The output of our computer simulations is also to be compared to empirical findings. Importantly, the creation and exchange of all emotional messages results in a valence distribution, which allows a comparison of empirics and simulation on the aggregated level. For the empirical analysis, the emotional information captured in the user’s messages has been extracted by means of sentiment analysis algorithms [39, 40]. In contrast to the analysis in Ref. I, where only the emotion valence is considered and accurately graded by the emotion classifiers [39, 40], for the comparison of the simulated and empirical data here we need a new classifier in which both valence and arousal of the messages are determined simultaneously. Therefore we introduce a lexicon-based classifier which is not as accurate as the valence classification, but it provides two values, valence and arousal, from a written text. Note that, according to psychology literature [28, 29, 30], these two components can already define a commonly known emotion, e.g., “fear”, “shame”, “delight”, etc. Secondly, our model simulates the response of the social network to external emotional events which allows to quantify the time scale for the emergence of collective emotions. The resulting power spectrum can be compared to empirical data.
In the following section, we first describe the empirical findings from the MySpace dataset that are relevant for the modeling part. The agent based model and its numerical implementation are described in Sect. 3, while the results of computer simulation and their comparison to empirical findings are presented in Sect. 4. A general discussion concludes the paper.
2 Input from the empirical dataset of MySpace
2.1 Structure of the underlying network
As mentioned in the Introduction, the underlying network structure may crucially affect the diffusion processes on it, e.g., by imposing “topology traps” and channeling the process according to its higher topology structures. Therefore, to obtain reliable dynamic features of the emotion spreading process, the realistic network structure is considered. The network we use for the modeling in Sect. 3 is obtained from the social networking site Myspace. The data are collected by a parametrized algorithm with a specified depth (time-window of the dialogs) and the network diameter in paper I [1]. In Myspace, users can become “friends” by requesting and accepting friendship proposals. Each user has a wall on which all his or her friends can post messages directed to the wall’s owner. According to MySpace policy, each user can also see his or her friends’ walls, in addition to its own wall. From the automatically retrieved dataset of publicly available messages between users, which we described in Ref. I, the social network is reconstructed. The users are represented as nodes, directing messages to friends is represented by directed links, where the number of messages sent in the particular direction determines the weight of the directed links from to .
In Ref. I we have analysed topology of the network for two different time depths, two and three months. Here we shortly summarize some topology features which are relevant for this work. Regarding the topology by omitting the weight of the link, we observe a different distribution for the out-degree, i.e., the number of friends a user sends messages to, and the in-degree, i.e., the number of friends a user receives messages from. The out-degree distribution follows a power law with a scaling exponent of 2.5, that does not change much if the time window is extended from two to three months. On the other hand, the in-degree distribution changes, converging to a stretched exponential when the time window is increased. Eventually, we found some disassortative mixing with respect to in-degree (“who is linked to my neighbors who are writing to me?”), which remains stable if the time window is increased [1]. These networks are very sparse with the link density in the range and small reciprocity of links close to 0.021 and practically independent on the time depth.
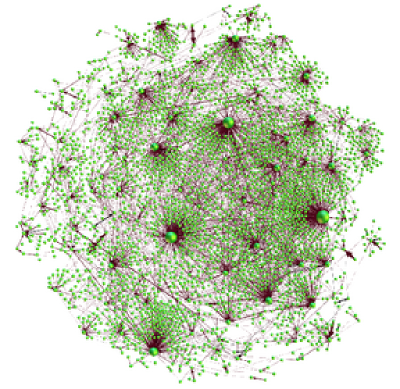
Here we use a part of the network termed Net3321 extracted from the dataset of two-months time depth. The network is reduced and compacted, the users that have sent and received less than 5 messages within two months have been excluded. Hence the reduced network contains nodes organized in four user communities [1]. Its average link density and reciprocity . Graphical view of Net3321 is shown in Fig. 1, where the widths of the directed links correspond to the number of messages retrieved from that dataset.

|
2.2 Properties of driving signal and user delay times
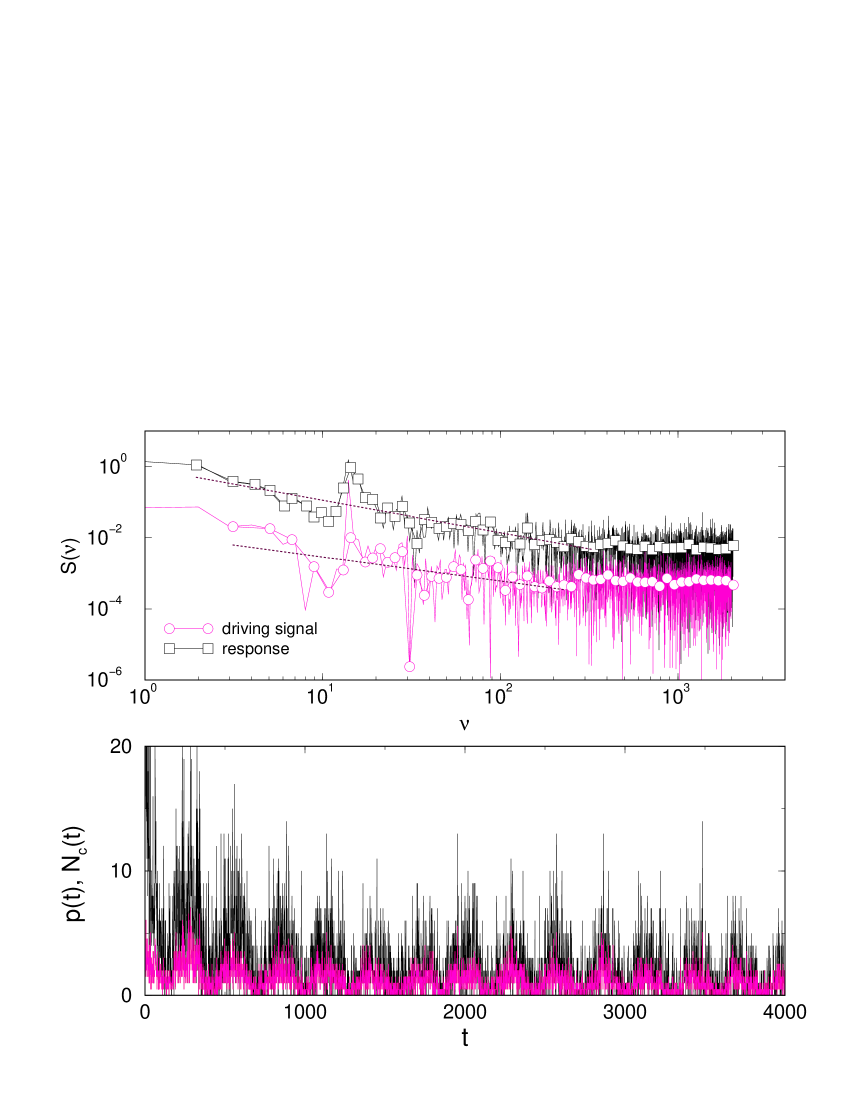
The MySpace dataset further allows us to obtain other empirical features about the user activity, which are later used to calibrate the model. As it will be clear in Sec. 3, we use the delay times distribution and the time series of new user arrivals as the input for the model. In this Section we extract and analyse these quantities from the empirical dataset. The results are shown in Fig. 2.
In [1], this distribution was determined from the two datasets. It is fitted with a power-law with a small exponent for the delay times longer than one day. Fig. 2a shows the interactivity-time distribution of users, where refers to the time between two consecutive actions (delay) of the same user, with the original time resolution of . In this paper we are just using the histogram of the interactivity-time as an input for our computer simulations as explained in Sect. 3

|
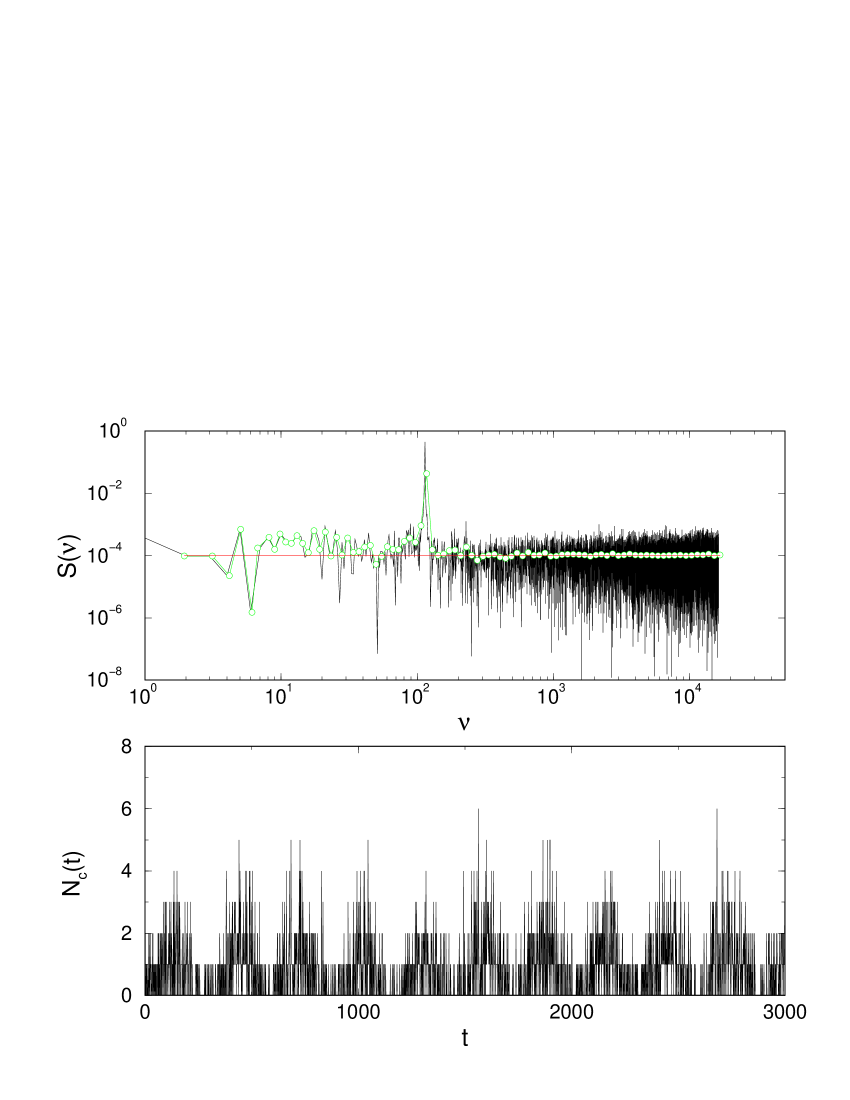
The second important empirical value is the number of new users entering the network per time unit , which is shown in Fig. 2b (red line) with a time resolution of . The time series indicates large fluctuations, but also some periodicity. In the same figure we also show the total number of messages per time unit (black line) with the same time resolution, which reveals that , which is the driven signal, tightly follows , which is the driving signal. In conclusion, communication in MySpace seems to be driven to a large extent by new users entering the network for the first time (with respect to the beginning of the time window).
To further verify this correlated behavior, we analysed the Hurst exponent and the power spectrum of both and time series, as shown in Fig. 2c,d. The Hurst exponent in the two time series measures the persistence of the community dynamics, i.e. how consistent the dynamics is (i) in attracting new users and (ii) in generating new messages, respectively. Note that the time series in Fig. 2b are stationary. The exponent is calculated as follows: For both time series with total length , the series is divided into boxes of equal time span. Then the maximal range of the fluctuations of the cumulative time series is found and compared with its standard deviation on the same interval . Plotting the rescaled fluctuations range against , the exponent is extracted from the power-law dependence as , for . The plots in Fig. 2c show the rescaled fluctuations for the time series of new users and the number of messages with exponents and , respectively.
The power spectrum is the transformation of the time series , in the frequency space , as shown in Fig. 2d. One notice the remarkable peak in the spectrum which results from the daily pattern of users online regularly. Further, we find that, in the regions of low frequencies , both spectra are characterized by a power-law decay , with similar exponents and , respectively. However, the power-law range is almost one order of magnitude smaller for the driving signal than for the driven signal . This suggests that the system builds correlated behavior on the shorter time scales. This is also seen in the differences between the persistence ranges for small in Fig.2c. But we emphasize that cannot be treated as a proxy of because of the difference. Instead, there is a variable that links the two, which is related to the writing activity. As we will show later, this link is given by the emotions of the users expressed in terms of valence and arousal. In our model we will use the driving signal , i.e. the number of new users entering the social network, as an input variable.
2.3 Extraction of emotional content from message texts
So far, we have described the topology of the social network and the activity patters of the users. This provides the basis for the most important question, namely how users interact and influence each other, which is the focus of our paper. For this, we have to analyse the messages exchanged between users, in particular their emotional content. Specifically, we quantify emotions with respect to two dimensions, arousal and valence [28]. The latter indicates the pleasure associated with the emotion (positive, negative, neutral), the former the level activity that it induces.
In order to extract the emotional content from the messages, we use sentiment analysis by applying a standard procedure introduced in [41]. It uses the ANEW dataset, a lexicon of human ratings of valence and arousal with about 1000 words [42], for which the emotional charge, or valence, and the arousal was determined. An algorithm then calculates the frequency of such classified words in a given text message, to compute the valence and arousal of the text sequence as
| (1) |
For the first time, here we apply this method to the MySpace dataset. Due to the limited size of the ANEW lexicon, the method should be preferably used on long texts because of statistical reasons. To overcome this limitation, we extracted the stem, or root form, of all words in the analyzed text. The stem contains most of the semantic information of a word (and thus its emotional content), and allows us to match similar words rather than exact matches, which eventually improves the statistics. To extract the stem, we used Porter’s Stemming algorithm [43], a technique that applies inverse generalized rules of linguistic deflection, mapping deflected words to the same stem. For example, the stem of the words “lovely” and “loving” by that method is “love”, which matches the corresponding word in the ANEW lexicon. This way, the sentiment analysis covers a larger portion of the text and allows to calculate the emotional values for more than 60% of the messages in the dataset.
The results of the analysis of emotional expression of the MySpace dataset are presented in Fig. 3. To be compatible with Russell’s circumplex model [28], we rescaled the output of Eqs. (1) to the range and adopted the standard polar diagram for the quantitative representation of emotions by using the following transformation:
| (2) |
Different points in this diagram are associated with different emotions. For comparison, the markers indicate examples of emotions which are known in psychology [29].
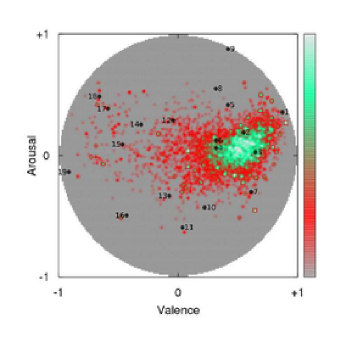
The distribution of valence values for the messages of our dataset is highly biased towards positive values, as the largest density in Fig. 3 is above 0. Fig. 4 shows the distribution of valence for messages that contain at least one word from the ANEW dataset. We notice that the mode is at 0.5. On the other hand, we have shown [22] that English written text is naturally biased towards positive emotions, with a mean and a standard deviation for the valence. This needs to be taken into account to interpret Fig. 4, so we renormalise each valence value using , where is the valence from Eq. (1) and is the amount of ANEW words in the message. The renormalized valence distribution is shown in the inset of Fig. 4. We find that, despite this renormalization, there is still a large bias towards positive emotions in the messages of MySpace.
On the other hand, the distribution of the expressed arousal (vertical axis of Fig. 3) is quite concentrated around values close to 0, i.e. MySpace messages rarely contain words expressing strong arousal. This finding is in line with previous survey studies [40] in which arousal from written texts showed a small variance.

3 Model of emotional agents on MySpace network
3.1 Emotional dynamics of agents
Our agent-based model of emotional influence between MySpace users builds on the empirical findings about (i) their interaction network, (ii) their temporal activity patterns, (iii) the entry rate of new users, and (iv) the emotionality of their messages. However, we do not get from the data the way emotional messages influence the activity and the emotional state of other users. Thus, in our model we provide hypotheses about this feedback which are tested against the aggregated outcome.
In specifying the model, we follow the agent-based framework of emotional influence outlined in [24], which was already applied to product reviews [44], chat rooms [11], and blog discussion [31]. In this framework, the emotional state of agent is described by two variables, valence , and arousal which each follow a stochastic dynamics. In previous work [44, 11] stochasticity was modeled simply by an additive stochastic force. In the present model we assume, similarly to the model of agents on blogs [31], that stochasticity may result from three sources: (i) sampling from the empirical inter-activity time distribution , Fig. 2a, (ii) sampling from the empirical rate at which new users enter the network, Fig. 2b, (iii) a spontaneous reset of both valence and arousal to a predefined value with a probability . The latter captures uncertainty in determining the external influences on an agent’s state and is treated as a tunable parameter, as explained below. The value of this state resets can vary according to very different origins, including influential events for the users or emotional consequences of the design of MySpace as a website. Another source of stochasticity is on choosing the receipient of the message, as explained below.
We further introduce an internal binary variable which describes if an agent is active () or not (). The value of is set according to the sampling from the inter-activity time distribution . If the agent is not active, it only relaxes towards a neutral state with decay rates , . If it is active, however, the agent perceives messages displayed on its own or on friend’s walls which affect its valence and arousal. We note that this definition of “active” is somewhat different from previous work where activity always implied writing a message. Here, writing is considered a subsequent activity which only happens with a certain probability dependent on the agent’s arousal and on the global activity level which is proxied by the entry rate as described below.
To model how agents perceiving messages are affected by these, there are three levels of aggregated information in our model: (i) aggregation of messages on the agent’s wall which shall be captured by an information field , (ii) aggregation of messages perceived on the friends’ walls, captured by an information field , (iii) aggregation of messages on all walls, i.e. a mean-field information that that captures a kind of “atmosphere” of the community. Fig. 5 provides a simplified overview of the different contributions to the information field and how they affect the emotional state of two agents and . Because each of the messages is carrying a valence and arousal value ( according to Eq. (1)in analogy to real data), the information field also has a valence and arousal component , which results from the respective aggregation. Specifically, different from previous modeling assumptions [24, 44], we assume here that the agent’s valence is only affected by the valence information, while the arousal and activity (e.g. in choosing conversation partners) are primarily affected by the arousal information, but also include the contribution of the valence fields, as explained below.

Using discrete time, the dynamics of the emotional state of agent is decribed by:
| (3) | ||||
Here is the Kronecker delta which is one only if the agent is in an active state and zero otherwise. The nonlinear functions capture how valence and arousal are affected by the information fields . An analytical discussion for these was provided in [24]. Here, we use the following assumtions:
| (4) |
Each of these functions consist of a term that depends on the information fields and a second term that depends on the arousal or the valence, respectively. For the latter, nonlinear assumptions are made in accordance with [24]. The term is added to confine both variables in the prescribed range of the phase space. The small parameter adjusts the fraction of the influence of the mean-field information, , whereas the small parameter adjusts the influence of the information of the friends’ walls, , in relation to the own wall, . The latter makes a difference between the valence and the arousal dynamics. We assume that the arousal dynamics of an agent depends on the activity on the walls of its friends, captured by . We neglect this influence in the valence, because the level of pleasure should rather depend on the messages directed to and not to its neighbors.
In order to close the model, we now have to define the dynamics of the different components of the information fields. For our investigation of the social network we assume that the mean-field information can be neglected, i.e. , whereas for other applications such as blogs dynamics [31] some mean-fields influence () is needed, while in the product reviews [44] or chat room conversation [11] the mean-field plays the main role, i.e. . Moreover, in the case of social networks, the main contribution of the information field comes from the agent’s individual wall, thus we set . We define the sequence of all messages from agent to agent as . So the wall of an agent captured by contains the message sequences from all its friends. The influence of this information, however, decays in time with a rate . For the valence and arousal component of , we assume the following dynamics (where stands either for valence or arousal ):
| (5) |
is generated by steams of messages from the neighbor nodes, where for each messages creation time is traced and the Heavyside function ensures that its influence does not start before. The emotional content of the message is composed by the values of valence or arousal of the neighboring agents at time . Its influence further depends on the weight of the directed link which is determined empirically (see Sect. 2). The exponential decay terms result from our assumption of the decay of the information influence with rate , where is the time of the last message on the wall of agent . The denominator of eq. (5) plays the role of a normalization to keep the field values properly bounded.
In addition to the individual field component , the influence of the friends’ walls aggregated in has to be specified. As explained above, there is only the arousal related component for which we assume:
| (6) |
Firstly, is composed of the average over the weighted arousal fields on the friends’ walls at time . The weights , however, are modified by a term that takes into account the similarity between the valence of the agent and the valence of its friends walls captured by the valence field . This is due to the fact that agents can only see the message walls of their friends, but not directly observe their valence. Information thus becomes the more important the more it is in line with the emotions of an agent. There is also a psychological argument for this assumption: users often search for information reinforcing their emotional state [45]. Further, there is a technical argument: to cope with information overload [46] most social networking sites filter information such that content presented to the user is in line with its previous writing. We note that Eq. (6) captures the influence of every “friend-of-a-friend”, because they are able to post messages on the walls of the friends of an agent, i.e. there is a second-nearest-neighbor influence that cannot be perceived in the same way in off-line social interactions, but is very characteristic for online social interaction. Our model captures this important feature of the online communication dynamics.
The last part of specifying the model regards the writing activity of the agent which is subsequent to perceiving messages. If an agent is in the state , it write a message with a probability that increases with its current arousal . The proportionality, as mentioned before, depends on the global activity level proxied by and a strength parameter , hence . The emotional content of the messages is given by the emotional state of the agent in terms of and at the time of writing. Next, the recipient of the message has to be determined. Instead of a uniform random choice, friend of an agent will be chosen with a probability that depends on (i) the aggregated information generated by on the wall of (whereas represents the strength of the social link estimated by the total number of messages generated by on ’s wall), and (ii) the importance of the wall of friend to agent . The rational behind this assumption is the following: when a user writes a message to someone else, this can be part of an ongoing conversation or initiate a conversation. The former is reflected in the first term and the latter in the second term of the following equation:
| (7) |
is the inverse normalization constant and is a parameter weighting between these two influences of the neighbors versus the own experience. For simplicity, we later choose equal to , which weighted the information in the neighbors’ walls against the own wall. The aggregated information along the link is assumed to depend only on the arousal component of the sender in the following way:
| (8) |
Similar to Eq. (5), this aggregates a set of messages coming from the agent on the wall of .
3.2 Simulation setup and numerical implementation
In the previous section, we have specified the emotional dynamics of agents with respect to valence and arousal, the activity of agents in perceiving and creating messages, and communication between agents in terms of the dynamics of the communication field consisting of different components. To numerically investigate this agent-based model, we need to specify the setup in terms of the network, the initial conditions of agents, and the parameters.
As stated in Sect. 2.1, the network used for our simulations is taken from the empirical data of MySpace, and consists of agents. Their weighted links are calculated from the two-months time window. The initial values of the agents’ emotional states are chosen uniformly at random from the intervals , . Also, their activity pattern is drawn from the empricial inter-activity time distribution , shown in Fig. 2a. While we are sampling from a distribution observed at resolution of min, the time scale of our simulations is fixed by the driving signal with min time bin, i.e., each time step in the simulations corresponds to one time bin of real time. Hence, in case of sampling , the event happens at the current time step. Note that this includes five possible values of the delay time, to which different probability is assigned according to the high-resolution distribution in Fig. 2a. The global activity level on the social network is captured by the empirical signal , Fig. 2b, as explained both in Sect. 2 and when outlining the model.
Apart from the empirical distribution function and the time series that we use as input for the simulations, the values for the control parameters introduced in the model are specified as given in Table 1. We can distinguish between parameters influencing the emotional state of the agents (“internal”, , ), parameters controlling the communications between agents (, , ) and parameters that control the activity of agents (, ). We recall that measures the probability at which the emotional state of the agent is determined externally to a value . For this, two different setups are discussed in the results: (i) are chosen at random from a uniform distribution, and (ii) are fixed to three sets of values, each representing a target emotion (a) “ashamed”, (b) “enthusiastic”, (c) “astonished”. The first case corresponds to the null hypothesis of a completely unknown external influence that might come from any kind of influence to the agent’s emotional state. The second case of fixed values of will allow us to test the collective effects of large scale events or mass media, by assuming their influence in the emotional state of the users of MySpace. Furthermore, design decisions of the website might externally drive the emotions of its users to particular values, and we can simulate the collective effects of such decisions in the context of our model.
| Internal parameters | Decay rates | Influence | Driving | Global functions |
|---|---|---|---|---|
The agent-based model is numerically implemented in C++ and the pseudo code is given in Algorithm 1. We note that the emotional states of the agents are updated in parallel. At each time step, first all field components for the wall of each agent are updated. Second, with probability the emotional state of each agent is set to a value . Third, the activity state of each agent is determined with respect to the inter-activity time distribution . Specifically, each agent has an internal counter related to its activity, which is reduced by one in every time step. Agents whose current counter is lower than become active. For these, a new value of the counter is sampled from the inter-activity distribution and their emotional state is updated. With probability , a message is created and the recipient is chosen with probability .
4 Results of Computer Simulations
4.1 Individual trajectories
In this paper, we have provided an agent-based model in which agents influence each other by exchanging emotional messages. The model captures essential features of user interaction in MySpace. Before we discuss the aggregated output, we provide two examples of the individual dynamics of agents in terms of their emotional variables valence and arousal . The simulations shown in Fig. 6 demonstrate that states with high arousal can be built up due to the interaction of an agent with its neighborhood or, less often, by a single large input from its environment. Repeated activities on short time intervals occur if an agent is ’caught’ by an active neighborhood over long periods of time. One notices in these time series the peaks in both arousal and valence when the agent was influenced by a message from a neighbor, or when its emotional state was externally reset to . In the absence of any action both valence and arousal exponentially decayed towards zero. Further, one notices that agent’s valence can be influenced either toward positive or negative values, without specific preferences.

|

|
4.2 Valence distribution
We now measure the applicability, or even the success, of our model by comparing its aggregated output with empirical results from MySpace. Some of the empirical findings are already used as an input for the simulations, as explained in Sects. 2, 3.2. However, the activity patterns and emotional response of agents do not trivially follow from a driving signal and a given network topology. Instead, only with the right assumptions about the agent’s emotional interaction, we are able to reproduce the stylized facts as explained below. For the following simulation results, we sample the external influence from a uniform distribution, to then explore later the effects of these parameters in the collective behavior of the model.
|

|
We start by explaining similarities in the network of emotional interactions. The network topology is given empirically and does not change through the simulations. What changes instead is the activity of the (fixed number of) agents and their emotional states and which links on that network are used to transmit emotion. Fig. 7 shows, for the topology of the Net3321 the aggregated emotional content of the messages exchanged, at the end of the simulation. The coloring pattern could be compared to the empirical pattern in paper I [1] Fig. 7. Specifically, the links are directed, their width is given by the amount of messages sent through that link during the simulation time, and their color represents the average valences of the messages sent through that link. It is obvious that there is a strong bias towards generating messages with positive emotions (indicated by red color).
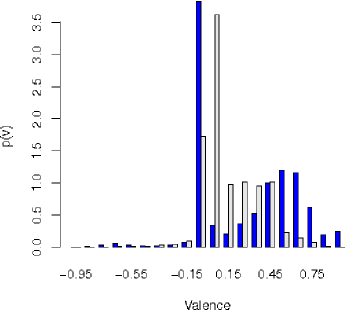
We can compare the valence distribution of the messages generated by the agents with the one of the users. Fig. 8 shows both the empirical and the simulated valence distribution aggregated over time. The empirical distribution is equivalent to the one shown already in Fig. 4, except for the peak at which contains all messages that did not contain any word from the ANEW dataset used for classification. We notice that both distributions have an obvious bias toward positive valence, which is stronger in the empirical data than in the simulations.
But instead of arguing about quantitative differences, we emphasize that our model is indeed able to reproduce this bias as the result of emotional interactions. Without any interaction, the agent’s valence would relax towards zero because of the decay factor in Eqs. (3). However, the social interaction with other agents through the fields on the network generates the positive bias in agreement with the empirical findings. This also supports previous work that argues about the social origin of the positive bias [22, 47].
4.3 Activity patterns of agents
|
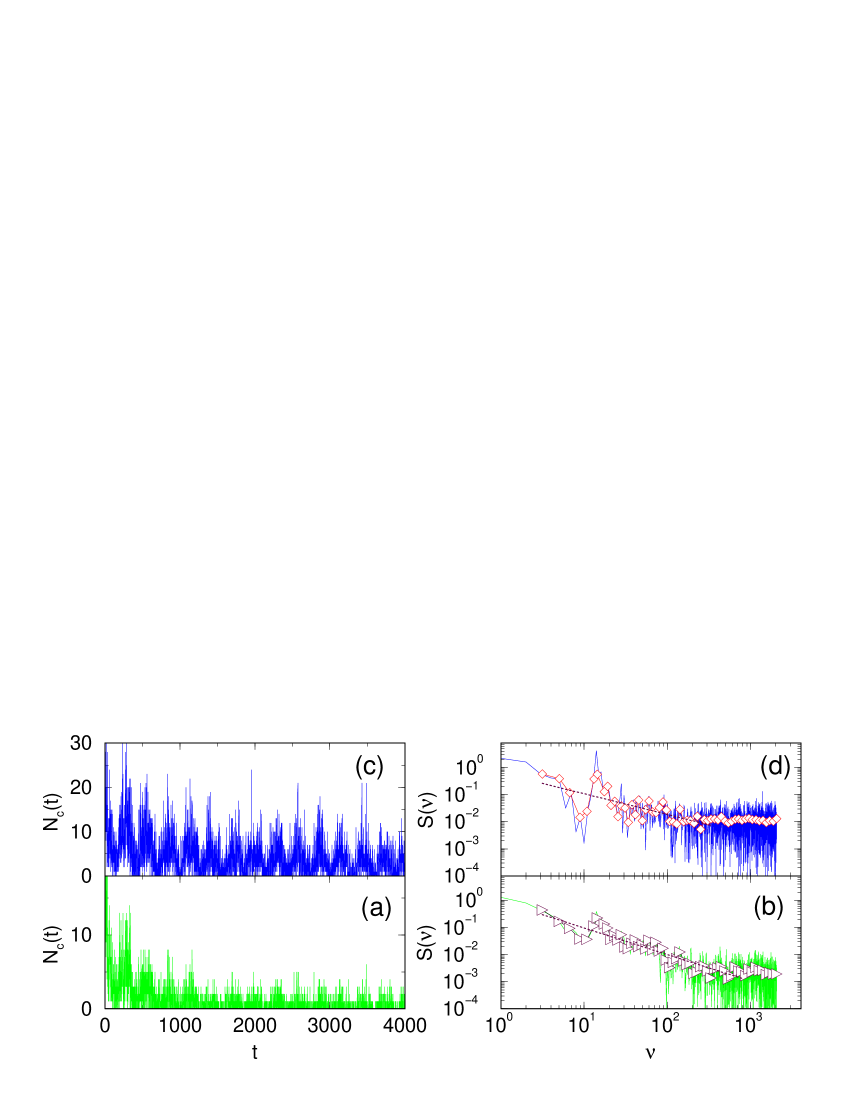
The empirical findings about user activities have been discussed in Sect. 2. We recall the skew distribution of the inter-event time for users, , Fig. 2(a), and the number of new users and total messages over time, Fig. 2(b), which showed a strong daily periodicity. As already explained in Sect. 2, in the simulations we use both and as inputs for our computer simulations, which implies that we need to reproduce the correct behavior of using our model. The simulated results are shown in Fig. 9 both in terms of the time series and the power spectrum , which can be compared to the ones in Fig. 2(b,d). While for the driving signal was given, we obtain for the driven signal, which deviates from the empirical value given in Sect. 2. First, we note that we get indeed a time series for which shows the long-term correlation expected. However, the crossover between the uncorrelated and the correlated events occur at a larger time scale in the simulations, i.e., cascades on small time scales are not captured by the simulations. On the other hand, the behavior on long time scales is well reproduced, i.e. our model is able to reproduce the emergence of long range correlations in the emotional expressions, which means we see the emergence of collective emotions.
|
Let us now discuss the importance of the spectral properties of the driving signal . Would we get a long-range correlation in the total number of messages produced also with a non-correlated driving signal? In order to test this, we performed simulations in which the driving signal is composed of white noise with a circadian component of daily periodicity. The average value of the white noise is set to the mean of the empirical time series, , but there are no long range correlations, in contrast to the original signal . Keeping all other parameters unchanged, we simulate the network response to this driving signal. Contrary to the results in Fig. 9, now does not show any correlations, as displayed in Fig. 10. I.e., apart from the daily periodicity, the power spectrum retains the characteristics of a white noise. Occurrence of the circadian cycle of daily activity is not enough to create the long range correlations present in the real data. We comment on this in again in the conclusions.
4.4 External influences in community behavior
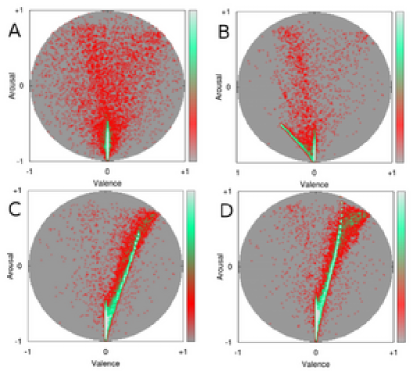
To understand the influence of external events on the emergence of collective emotions, our simulations consider externally triggered resets of the emotional state of agents to a value . As we explained in Sec. 3.2, can be either fixed or sampled from a uniform distribution. While the latter case is covered by the simulation results explained in Sect. 4.3, we now use fixed values for which capture three different external events, for example in mass media: (a) “astonished” (v=0.4, a=0.88), (b) “ashamed” (v=-0.44, a=-0.5), (c) “enthusiastic” (v=0.5, a=0.32). In the psychology literature [29], “astonished” and “ashamed” are assumed to have an influence on the social interaction and emotional communication. In our quantitative model, these two emotional states are in the opposite parts of the circumplex map (see Fig. 3): “astonished” is a positive emotion with high arousal, while “ashamed” is a negative emotion with low arousal.
|
We want to test how fixed values of influence the cascade of emotions on the social network. The simulated time series and power spectra of shown in Fig. 11 correspond to either “astonished” or “ashamed”. The power spectra of in both cases show the same shape of with the exponents close to in the case “astonished”, while approaching flicker noise, in the case “ashamed”. This values are higher but not significantly different to the one found in the case of uniformly distributed , shown in Fig. 9. But correlations extend for a larger range in the case of “ashamed” (also noticeable in the lower value of at high ), even though it is a low-arousal, negative emotion. However, the level of activity in the time series is higher for “astonished”, as expected.
The collective emotional response that is observed in the correlated time series, is built on the actions of individual emotional agents on the network. The evolution of the emotional state of an agent like the ones shown in Fig. 6 can be seen as a trajectory in a circle like the one in Fig. 3 by applying the transformation of eqn. 2. We can explore the collective effects of the different types of external influences by looking the emotional states “visited” by the agents on the circumplex [48].
In the color plots of Fig. 12 we show the histograms of the different emotional states that were visited by the agents in our simulations. More precisely, we plot the emotion states of each agent at every moment when the agent was active, i.e. . The level of activity among the agents varies a lot, depending on their location in the network and the set of events occurring in the agents neighborhood. Consequently an agent’s contribution to this emotion histograms will vary according to their activity in a given simulation. The patterns shown in Fig. 12 represent situations with random and three specific external influences: “ashamed”, “astonished”, and “enthusiastic”. The histograms shown in the two upper panels of Fig. 12 show how high arousal states may arise starting from (a) uniformly distributed random input or (b) a low arousal negative valence state like “ashamed”. In the lower panels, the external influences are set to two different high arousal positive states: “astonished” and “enthusiastic”. The influence of these states spreads through the networks by means of agent interactions through the field, giving raise to the asymmetrical V-shape pattern.
|
4.5 Propagation of emotions in the network
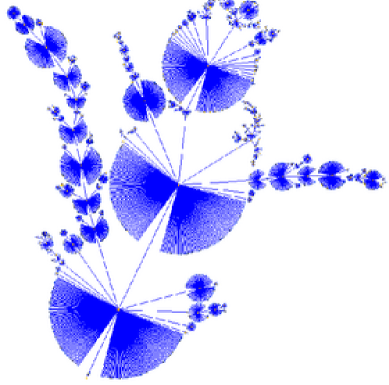
The agent-based model also allows us to understand how cascades of emotional influence propagate through the real social network of MySpace. Precisely, will positive emotions propagate along the same social links as negative ones? Obviously, agents may exchange positive or negative messages with different preferred neighbors. To what neighbor the message will be sent depends on the agent’s past interaction along the link, strength of the influence fields and the valence similarity with the wall of the recipient agent. The global problem of finding the pattern of most frequently used links on the entire network is appropriately captured by the maximum-flow spanning tree of that network. On these trees each node is attached to the rest of the tree by its strongest link. Again, strength of a link between two agents is determined as the total amount of messages sent along that link during the simulation time.
Fig. 13 shows these strongest links between agents for two simulations with different external influence of positive (“enthusiastic”) and negative (“ashamed”) external events. For comparison, the time series from the same simulation runs are shown in Fig. 11 and the patterns of visited areas in the phase space, in Fig. 12b,d. Obviously, for the whole network of nodes shown, these flow patters differ considerably.
We first note that the pattern reflects the directedness of the links, i.e. agent may have its strongest link to agent (in terms of messages exchanged), but not vice versa. This reveals the existence of strong hubs in the social network, i.e. agents to which many other agents have their strongest links. Interestingly, in the case of the positive emotion with high arousal, “enthusiastic”, the large hubs occur along the central branch of the tree, and similarly, side branches contain smaller hubs of comparable size. While in the case of negative emotions with low arousal, “ashamed”, the tree splits in two major branches and the hubs appearing along each branch are of different size.
| (a) |
|
| (b) |

|
5 Discussion and Conclusions
We have studied dynamics of the emotion-driven dialogs in online social networks with a particular emphasis on the emergence of collective behaviors of users. For this purpose we first analyzed a large dataset of the dialogs collected from a part of MySpace network. The analyzed data have high temporal resolution and contain full texts of dialogs exchanged among users at the connected part of the network within two months period. This enabled us to extract the emotional contents—arousal and valence—from the texts the dialogs and to study temporal correlations in their occurrence. To further understand the dynamics of such emotional communications, we have introduced the model of emotional agents on the network. In the model, the users are represented by the agents, whose arousal and valence fluctuate in time being influenced by internal and external inputs and ”reactivity” of the network. In full analogy to the empirical data, a high-resolution dynamics is maintained in the model with each message handled separately. The rules of actions are motivated by realistic situations in the online social networks and some of the parameters governing the dynamics are inferred from the same dataset of MySpace dialogs. Several other parameters, for instance decay time of emotion and network ”reactivity”, which can not be estimated from the available empirical data, have been kept within theoretically plausible limits. In addition, within the model we infer the action-delay and circadian cycles as generated by the real-world processes of MySpace users, which condition the pace of their actions and stepping into the virtual world of the online social network, respectively. With this ”native” set of control parameters, the simulation results enable us to derive several conclusions, in particular regarding the emotion spreading processes in MySpace, and potentials of the model for predicting user behaviors in hypothetical (experimental) situations.
Our main conclusions are summarized as follows:
-
•
Temporal correlations of users activity in MySpace occur on long-time scale and are accompanied by high arousal and predominantly positive emotions.
-
•
Rhythms of users stepping from real-to-virtual world carry certain important features of the communication processes in the online social networks. Specifically, the temporal correlations in the online dynamics are built as a response to already correlated step-in processes. Otherwise, if not driven in a different way, the online social networks with their internal dynamics of the user-to-user contacts and restricted visibility of messages are not capable to generate correlations on large temporal scale.
-
•
P͡atterns of emotion dynamics in the virtual world of social networks are different for positive and for negative emotions. In the empirical data of MySpace the positive-valence emotions dominate. However, model simulations of spreading emotional states with different arousal–valence components and different social connotations, “enthusiastic” and “ashamed”, for example, show different patterns in the phase space of the emotions involved as well as the social links used to spread the emotions on the network.
-
•
High-arousal states in the dynamics are built on small noisy input for all initial emotion states in our simulations, which is reminiscent of “party”-like behavior of the agents. In our model this is a consequence of collective effects—repeated actions of an agent caught in the active network environment.
Quantitative analysis of the simulated and the empirical data lead to similar results, for instance, comparison of the correlations of the emotional time series in cf. Figs. 2 and 9, and range of the expressed valences, in Fig. 8. This suggests that the model of emotional agents can reproduce the stylized facts of the empirical data of MySpace dialogs, when the parameters are appropriately chosen! Moreover, within the model, genesis of the emergent behaviors with particular contributions of each user (agent) and its social connections–can be revealed! This makes the predictive value of the model. It is more subtle, however, to relate the predictions of the model which regard the individual agent’s emotional state and its fluctuations with the ”feelings change” observed in the psychology research of the online communications. In this respect one can recognize that a characteristic area in the positive-valence high-arousal states recurrently being visited by the agents, may reflect the positive baselines of human valence and arousal found in [26].
Moreover, the emergent asymmetrical V-shape patterns of Figs. 12 correspond with the patterns of natural selective attention discovered in psycho-physiological studies [42]. For evolutionary reasons, humans have two modes of reaction to emotional content: appetitive and defensive motivation. Both tendencies can be seen in our simulations, opening the question of which one of them is predominant in the users’ internal emotions. This way our agent based model provides testable hypotheses for psychological research, as the dynamics of the emotional reaction of users of online communities might depend on the emotional state of new members. Experimental setups similar to the ones presented in [49] can test whether the physiological reactions to new community members (arrivals) follow the patterns predicted by our model.
In conclusion, the presented agent-based simulations give a new insight into emotion dynamics in online social networks. In the model, the interaction rules, closely related to MySpace social network site, take into account influence of the next-neighborhood on the agent’s state—–a salient feature of the online social networks, and the extended phase space where common emotions can be recognized. Hence, despite of its mathematical complexity, our model provides a “laboratory” for further experiments on the emotional agent’s behavior (e.g., under different driving conditions, varied external inputs, and changed values of the parameters) and for a comparative analysis of online and offline social networks.
AUTHORS CONTRIBUTION: Designed research: BT; Developed the program code, and executed simulations: M.Š.; Provided the tool for extraction of emotional content: D.G.; Contributed with the concept of emotional agents: F.S.; Analysed the data and contributed in graphics: B.T., M.Š., D.G.; Wrote the paper: B.T., F.S., D.G.
Acknowledgments: The research leading to these results has received funding from the European Community’s Seventh Framework Programme FP7-ICT-2008-3 under grant agreement no 231323 and the project P-10044-3. B.T. thanks support from the national program P1-0044 of the research agency of the Republic of Slovenia and COST-MP0801 action. M.Š. also thanks the national research projects ON171037 and III41011 of the Republic of Serbia.
References
- [1] M. Šuvakov, M. Mitrović, V. Gligorijević, and B. Tadić. Ddialogs-based structure of MySpace. preprint, 2012.
- [2] J. Harding and E.D. Pribram, editors. EMOTIONS a cultural studies reader. Rutledge, Oxon, UK, 2009.
- [3] M. Giles. A world of connections - A special report on social networking. The Economist, page 16, January 2010.
- [4] Y. Amichai-Hamburger and G. Vinitzky. Social network use and personality. Computers in Human Behavior, 26(6):1289 – 1295, 2010. Online Interactivity: Role of Technology in Behavior Change.
- [5] C.M.K Cheung, P-Y. Chiu, and M.K.O. Lee. Online social networks: Why do students use facebook? Computers in Human Behavior, 27:1337 – 1343, 2011.
- [6] T. Ryan and S. Xsenos. Who uses facebook? an investigation into the relationship between the big five, shyness, narcissism, loneliness, and facebook usage. Computers in Human Behavior, 2011.
- [7] M. Szell, R. Lambiotte, and S. Thurner. Multirelational organization of large-scale social networks. Proceedings of the National Academy of Sciences USA, 107(31):13636–13641, 2010.
- [8] M. Szell and S. Thurner. Measuring social dynamics in a massive multiplayer online game. Social networks, :1–23, 2010.
- [9] R. Guimerà, L. Danon, A. Díaz-Guilera, F. Giralt, and A. Arenas. Self-similar community structure in a network of human interactions. Phys. Rev. E, 68:065103, 2003.
- [10] M. Mitrović, G. Paltoglou, and B. Tadić. Networks and emotion-driven user communities at popular blogs. European Physical Journal B, 77:597–609, 2010.
- [11] A. Garas, D. Garcia, and F. Schweitzer. User communication patterns in online chatting communities. Scientific Reports, 2:402, 2012.
- [12] P. DiMaggio, E. Hargittai, W. R. Neuman, and J. P. Robinson. Social implications of the Internet. Annual review of sociology, 27:307–336, 2001.
- [13] Y. Amichai-Hamburger. Internet and personality. Computers in Human Behavior, 18:1 – 10, 2002.
- [14] N. F. Johnson, Ch. Xu, Zh. Zhao, N. Ducheneaut, N. Yee, G. Tita, and P. M. Hui. Human group formation in online guilds and offline gangs driven by a common team dynamic. Phys. Rev. E, 79:066117, Jun 2009.
- [15] J. Kleinberg. The Convergence of Social and technological Networks. Communications of the ACM, 51:66–72, 2008.
- [16] P. Panzarasa, T. Opsahl, and K.M. Carley. Patterns and dynamics of users’ behavior and interactions: network analysis of and online community. Journal of the American Society for Information Science and Technology, 60:911–932, 2009.
- [17] P.S. Dodds, K.D. Harris, I.M. Koloumann, C.A. Bliss, and C.M. Danforth. Temporal patterns of happiness and information in a global social network: Hedonometric and Twitter. arXiv:1101.5120v3, 2011.
- [18] M. Mitrović and B. Tadić. Bloggers Behavior and Emergent Communities in Blog Space. Eur. Phys. Journal B, 73(2):293–301, 2010.
- [19] M. Mitrović and B. Tadić. Emergence and structure of cybercommunities in Handbook of Optimization in Complex Networks, vol 1 Theory and Applications, pp. 209–227 , editors M. M. Thai and P. Pardalos, Springer, Berlin, 2012.
- [20] J. Giles. Social science lines up its biggest challenges. Nature, 470:18–19, 2011.
- [21] K. Sassenberg and M. Boos. Attitude Change in Computer-Mediated Communication: Effects of Anonymity and Category Norms. Group Processes & Intergroup Relations, 6(4):405–422, 2003.
- [22] D. Garcia, A. Garas, and F. Schweitzer. Positive words carry less information than negative words. EPJ Data Science, 1(1):3, 2012.
- [23] M. Mitrović, G. Paltoglou, and B. Tadić. Quantitative analysis of bloggers’ collective behavior powered by emotions. Journal of Statistical Mechanics: Theory and Experiment, 2011(02):P02005+, 2011.
- [24] F. Schweitzer and D. Garcia. An agent-based model of collective emotions in online communities. Eur. Phys. J. B, 77(4):533–545, 2010.
- [25] J. L. Rodgers. The epistemology of mathematical and statistical modeling: a quiet methodological revolution. The American psychologist, 65(1):1–12, 2010.
- [26] P. Kuppens, Z. Oravecz, and F. Tuerlinckx. Feelings change: Accounting for individual differences in the temporal dynamics of affect. Journal of personality and social psychology, 99(6):1042–60, 2010.
- [27] F. Schweitzer. Browning Agents and Active Particles: Collective Dynamics in the Natural and Social Sciences. Springer-Verlag Berlin Heidelberg, 2007.
- [28] J. A. Russell. A circumplex model of affect. Journal of Personality and Social Psychology, 39:1161–1178, 1980.
- [29] K. Scherer. What are emotions? And how can they be measured? Social Science Information, 44(4):695–729, 2005.
- [30] J. A. Coan and J. J. B. Allen, editors. The Handbook of Emotion Elicitation and Assessment. Oxford University Press Series in Affective Science, 2007.
- [31] M. Mitrović and B. Tadić. Patterns of emotional blogging and emergence of communities: Agent-based model on bipartite networks. http://arxiv.org/abs/1110.5057, 2011.
- [32] M. Mitrović and B. Tadić. Topology of bipartite networks grown by blogging of the emotional agents. in preparation.
- [33] C. P. Roca, S. Lozano, A. Arenas, and A. Sánchez. Topological traps control flow on real networks: The case of coordination failures. PLoS ONE, 5(12):e15210, 12 2010.
- [34] B. Tadić, G.J. Rodgers, and S. Thurner. Transport on complex networks: Flow, jamming and optimization. International Journal of Bifurcation and Chaos (IJBC), 17:2363–2385, July 2007.
- [35] B. Tadić, K. Malarz, and K. Kułakowski. Magnetization reversal in spin patterns with complex geometry. Phys. Rev. Lett., 94:137204, Apr 2005.
- [36] R. D. Malmgren, D. B. Stouffer, A. S. L. O. Campanharo, and L. A. Amaral. On Universality in Human Correspondence Activity. Science, 325(5948):1696–1700, 2009.
- [37] C. Castellano, S. Fortunato, and V. Loreto. Statistical physics of social dynamics. Reviews of Modern Physics, 81(2):591–646, 2009.
- [38] R. Crane, F. Schweitzer, and D. Sornette. New Power Law Signature of Media Exposure in Human Response Waiting Time Distributions. arXiv:0903.1406, 2009.
- [39] M. Thelwall, K. Buckley, G. Paltoglou, D. Cai, and A. Kappas. Sentiment strength detection in short informal text. J. Am. Soc. Inf. Sci. Technol., 61:2544–2558, December 2010.
- [40] G. Paltoglou, M. Theunis, A. Kappas, and M. Thelwall. Prediction of valence and arousal in forum discussions. submitted to Journal of IEEE Transactions on Affective Computing.
- [41] P.S. Dodds and C.M. Danforth. Measuring the Happiness of Large-Scale Written Expression: Songs, Blogs, and Presidents. Journal of Happiness Studies, 2009.
- [42] M. M Bradley and P. J Lang. Affective norms for English words (ANEW): Instruction manual and affective ratings. Technical report, The Center for Research in Psychophysiology, University of Florida., 1999.
- [43] C. J. Van Rijsbergen, S.E. Robertson, and M.F. Porter. New models in probabilistic information retrieval. Computer Laboratory, University of Cambridge, Cambridge, England, 1980.
- [44] D. Garcia and F. Schweitzer. Emotions in product reviews – Empirics and models. In Randy Bilof, editor, Proceedings of 2011 IEEE International Conference on Privacy, Security, Risk, and Trust, and IEEE International Conference on Social Computing, PASSAT/SocialCom, pages 483–488, Boston, Massachusetts, 2011. IEEE Computer Society.
- [45] M. M.Bradley. Natural selective attention: orienting and emotion. Psychophysiology, 46(1):1–11, 2009.
- [46] F. Walter, S. Battiston, and F. Schweitzer. Coping with information overload through trust-based networks. In D. Helbing, editor, Managing Complexity: Insights, Concepts, Applications, volume 32 of Understanding Complex Systems, pages 273–300. Springer Berlin / Heidelberg, 2008. 10.1007/978-3-540-75261-5-13.
- [47] B. Rime. Emotion Elicits the Social Sharing of Emotion: Theory and Empirical Review. Emotion Review, 1(1):60–85, 2009.
- [48] J. Ahn, S. Gobron, Q. Silvestre, and D. Thalmann. Asymmetrical Facial Expressions based on an Advanced Interpretation of Two-dimensional Russell’s Emotional Model. In pre-print, 2010.
- [49] D. Küster, E. Tsankova, M. Theunis, and A. Kappas. Measuring cyberemotions: How do bodily responses relate to the digital world? In Poster presented at the 7th Conference of the Media Psychology Division of the Deutsche Gesellschaft für Psychologie, Bremen, Germany, 2011.