New Phase Induced by Pressure in the Iron-Arsenide Superconductor Ba1-xKxFe2As2
Abstract
The electrical resistivity of the iron-arsenide superconductor Ba1-xKxFe2As2 was measured in applied pressures up to 2.6 GPa for four underdoped samples, with , 0.18, 0.19 and 0.21. The antiferromagnetic ordering temperature , detected as a sharp anomaly in , decreases linearly with pressure. At pressures above GPa, a second sharp anomaly is detected at a lower temperature , which rises with pressure. We attribute this second anomaly to the onset of a phase that causes a reconstruction of the Fermi surface. This new phase expands with increasing and it competes with superconductivity. We discuss the possibility that a second spin-density wave orders at , with a vector distinct from that of the spin-density wave that sets in at .
pacs:
74.25.Fy, 74.70.DdSuperconductivity often appears on the border of antiferromagnetic order,(Monthoux_Nature_2007, ) as in organic conductors, (NDL_PRB_2009, ) heavy-fermion compounds, (Knebel_review_2009, ) and electron-doped cuprates.(Jin_Nature_2011, ) Tuning the system with applied pressure or chemical substitution causes the antiferromagnetic ordering temperature to fall and a superconducting phase to eventually appear, with the superconducting transition temperature rising until the quantum critical point where goes to zero, and falling thereafter to form a dome-like region of superconductivity in the phase diagram. In cuprates, hole doping has the additional effect of inducing the onset of a second phase, with stripe order (NDL_PhysicaC_2012, ) – a unidirectional modulation of the spin and charge densities. This stripe order competes with superconductivity, and so causes a dip in where it peaks. Antiferromagnetism and stripe order cause a reconstruction of the Fermi surface, detected for example in measurements of quantum oscillations and transport properties (e.g. resistivity, Hall and Seebeck coefficients).(Taillefer_JPCM_2009, ; Taillefer_ARCMP_2010, )
In the iron arsenide BaFe2As2, substitution of K for Ba, Co or Ru for Fe, and P for As all produce the same type of phase diagram, whereby falls and a dome surrounds the quantum critical point where .(Canfield_ARCMP_2010, ) The application of pressure to BaFe2As2 produces a similar phase diagram.(kim_combined_2011, ) The antiferromagnetic order is unidirectional, with wavevector (or ). It causes the lattice to undergo a transition from tetragonal at high temperature to orthorhombic at low temperature. The structural transition is either simultaneous with or slightly before it, as in K-doped (Avci2012, ) or Co-doped BaFe2As2, (Pratt_PRL_2009, ) respectively. In Co-doped and K-doped BaFe2As2, Fermi-surface reconstruction causes a distinct change in the electrical resistivity below .(Canfield_ARCMP_2010, ; Shen_PRB_2011, )
.
.
In this Article, we report a study of the pressure-temperature phase diagram of Ba1-xKxFe2As2 at K concentrations ranging from to . We find that a pressure in excess of GPa induces the onset of a new phase whose extent in the phase diagram increases with , and whose emergence causes a suppression of superconductivity. While the underlying order has yet to be determined, we discuss the possibility of two successive spin-density waves, the first setting in at and the second at , with and (or vice-versa), respectively.
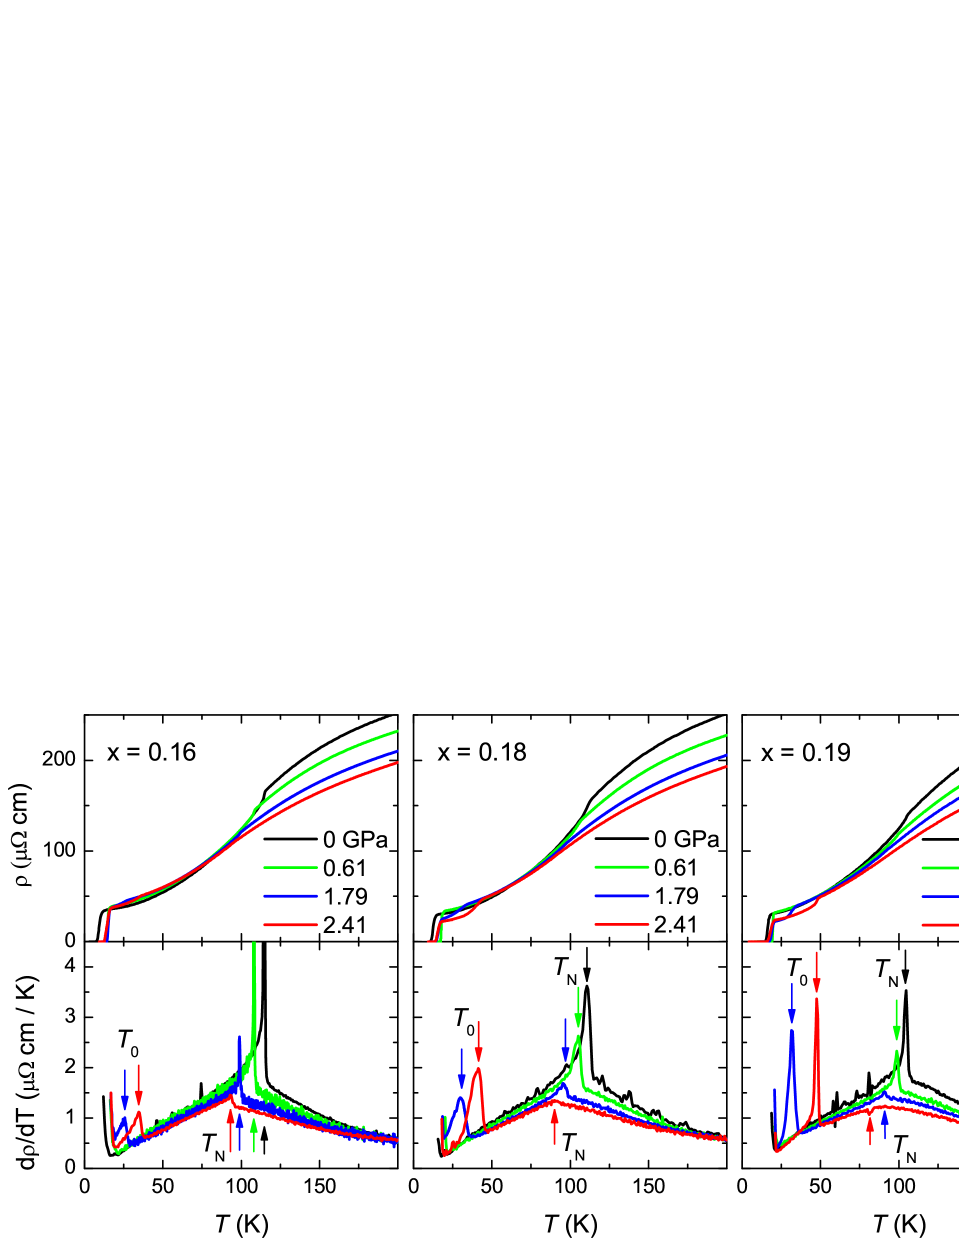
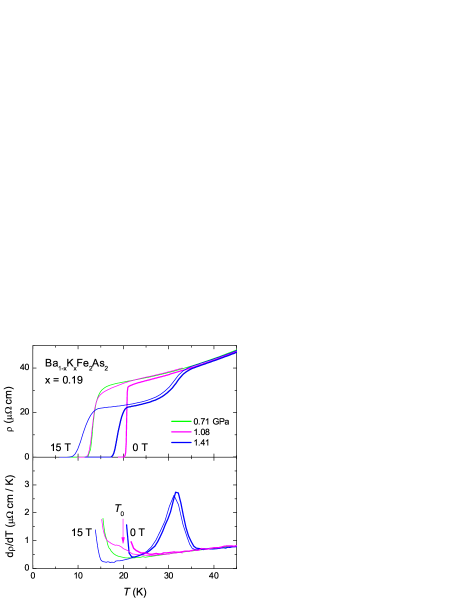
Methods.– Single crystals of Ba1-xKxFe2As2 were grown from self flux.(Growth, ) Four underdoped samples were measured, with a superconducting transition temperature K, K, K and K, respectively. Using the relation between and the nominal K concentration reported in ref. Avci2012, , we obtain , 0.175, 0.194 and 0.207, respectively. For simplicity, we label these , 0.18, 0.19 and 0.21. These values are also consistent with the measured antiferromagnetic ordering temperature (which coincides with the structural transition from tetragonal to orthorhombic), (Avci2012, ) equal to K, K, K and K, respectively. Hydrostatic pressures up to 2.63 GPa were applied with a hybrid piston-cylinder cell,(walker_nonmagnetic_1999, ) using a 50:50 mixture of n-pentane:isopentane.(duncan_high_2010, ) The pressure was measured via the superconducting transition of a lead wire inside the pressure cell. The electrical resistivity was measured for a current in the basal plane of the orthorhombic crystal structure, with a standard four-point technique using a Lakeshore ac-resistance bridge. When a magnetic field was applied, it was along the axis, normal to the basal plane. The transition temperatures are defined as follows: is where ; and are extrema in the derivative (Fig. 1).
Resistivity.– In Fig. 1, the resistivity of Ba1-xKxFe2As2 is plotted as a function of temperature, at four representative pressures for , 0.18, 0.19 and 0.21. To remove uncertainties coming from the geometric factors of the different samples, we set cm at K, in agreement with previous studies.(Shen_PRB_2011, ) The antiferromagnetic transition at is detected as a sharp peak in the derivative , which becomes less and less pronounced with pressure. For and , the anomaly changes from a peak to a dip, above GPa and GPa, respectively. The same effect is observed with increasing at ambient pressure.(Shen_PRB_2011, ) This change seems to happen when falls below K.
Above , decreases with pressure, at the rate of %/GPa at 200 K. Below , the pressure dependence of has nearly vanished and , with for and 0.18, for and 0.21, in agreement with at reported previously.Shen_PRB_2011 . is independent of pressure and decreases only slightly with pressure. The drop in below is due to the reconstruction of the Fermi surface caused by the antiferromagnetic order, where the loss in carrier density is more than compensated by the reduction in scattering, as in stoichiometric BaFe2As2.(Shen_PRB_2011, )
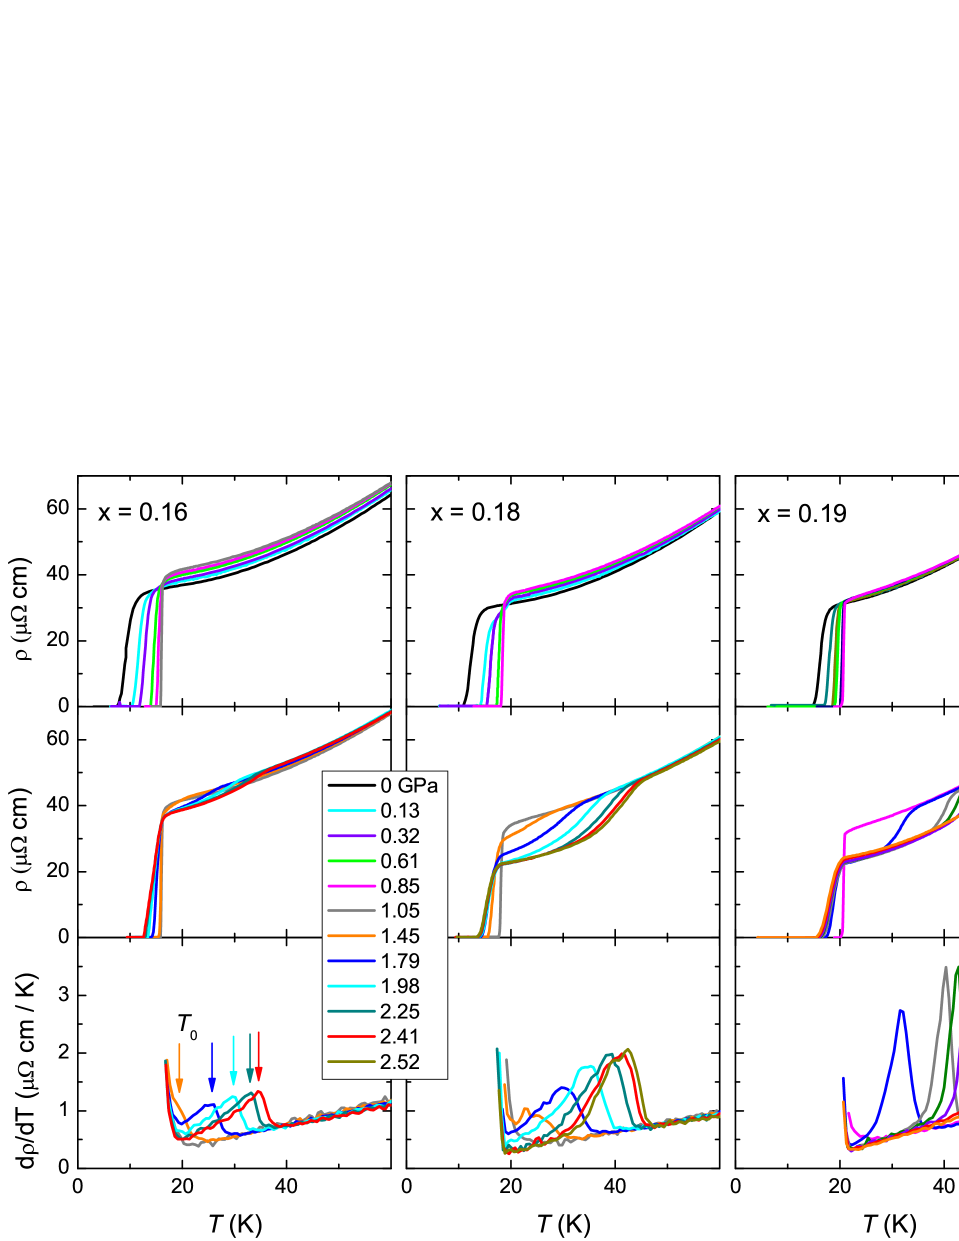
For GPa, a second drop in is observed at lower temperature. It produces a peak in similar to that at , revealing the onset of a second Fermi-surface reconstruction, at a temperature labelled . In Fig. 2, a zoom at low temperature shows that moves up under pressure, in contrast to which moves down.
The superconducting transition moves up with pressure initially, and it becomes sharper where is maximal. At pressures where the new phase is present, moves down with pressure and the transition widens. At GPa, the onset of the superconducting drop is independent of pressure.
.
.
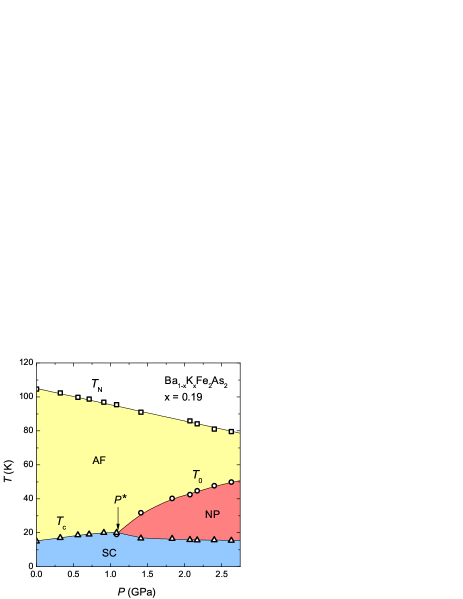
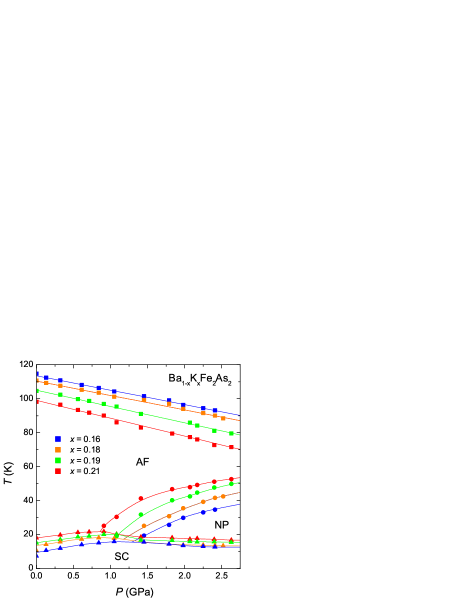
Phase diagram.– In Fig. 3, the evolution of , and with pressure is displayed on a phase diagram for . Initially, rises as falls, reflecting the competition between antiferromagnetic and superconducting phases. At low pressure, the pressure-tuned competition mimics the well-known concentration-tuned competition (Fig. 4). reaches a maximal value of K at GPa, and then it falls. The peak in coincides with the point where the and lines intersect; we label this pressure . (The point at 1.08 GPa was determined by the application of a magnetic field to lower ; see Fig. 5.)
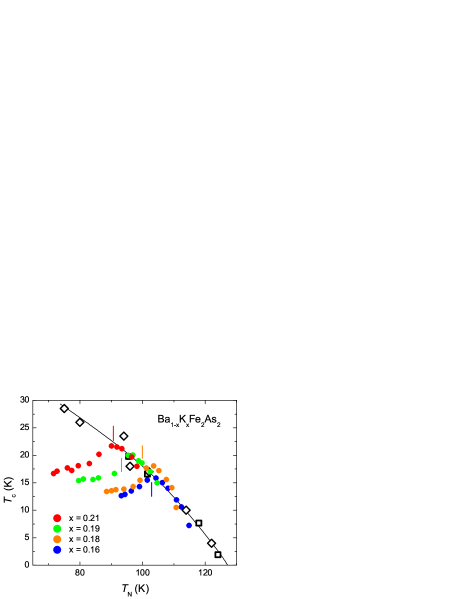
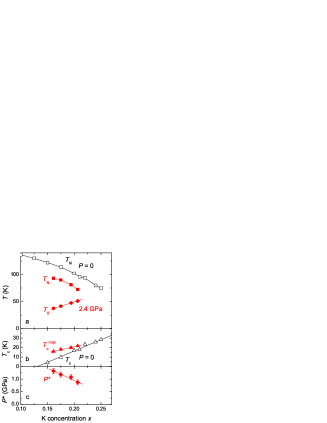
Qualitatively identical phase diagrams are obtained for all four samples (Fig. 6). With increasing , the antiferromagnetic phase shrinks, while the new phase expands (to higher temperature and lower pressure). The peak in correlates with the appearance of the new phase, i.e. it coincides with . As shown in Fig. 7a, decreases with doping the same way at zero pressure and at 2.4 GPa. At 2.4 GPa, increases linearly with doping, so that and are expected to become equal at . The maximum attained under pressure, , increases with (Fig. 7b); at high , it approaches the value of at zero pressure since moves down with (Fig. 7c).
.
Discussion.– A drop in the resistivity could have a number of possible origins. First, we rule out the possibility of an incomplete superconducting transition by studying the effect of a magnetic field. In Fig. 5, for is shown at and T. While shifts down by K, is only suppressed by about 0.7 K. A second possibility is a Lifshitz transition. Within a single antiferromagnetic phase, the Fermi surface can undergo a second reconstruction below the original one at when the spin-density-wave order parameter exceeds a certain critical value. However, such a Lifshitz transition is unlikely to be the explanation here, as and respond in opposite directions to both pressure (Fig. 6) and K concentration (Fig. 7).
Instead, the phenomenology strongly suggests that a second phase transition occurs at , to a new phase with currently unknown order. Let us mention two possible density-wave scenarios. The first is a charge-density wave. ARPES data on BaFe2As2 has revealed highly parallel sections of the Fermi surface inside the antiferromagnetic phase.(Kondo_PRB_2010, ) Such features suggest the possibility of an incommensurate charge-density-wave instability favored by the good nesting conditions, which may be improved by tuning and applying pressure.
.
.
A second possibility is that and are the onset temperatures of two successive spin-density-wave phases. The situation is reminiscent of the two successive charge-density-wave transitions in the rare-earth tri-tellurides Te3,(Ru_PRB_2008, ) where nesting at a wavevector gaps out part of the Fermi surface below the first transition, at , and nesting at a wavevector , perpendicular to , further gaps out the Fermi surface below the second transition, at . By changing the rare-earth ion from Dy to Tm, the two transition temperatures go in opposite directions: drops while rises.(Ru_PRB_2008, ) This is interpreted as follows: as the first gap, , decreases, more of the Fermi surface remains after reconstruction below and so more of it can take part in the nesting at , thus producing a stronger gap , and hence a larger .(Ru_PRB_2008, )
The fact that and go in opposite directions with pressure in Ba1-xKxFe2As2 suggests a similar picture. The first spin-density wave orders below with (within a given orthorhombic domain), causing two of the four electron pockets in the Fermi surface to reconstruct. The proposed scenario is that a second spin-density wave orders below , with a different wave vector, . It is conceivable that , causing the other two electron pockets to reconstruct.
Three other features of our data appear consistent with a scenario of two related spin-density-wave phases. First, the two transitions, at and , cause similar changes in the resistivity: drops in both cases, and the drop is of comparable sharpness (see in Fig. 1). Secondly, with increasing doping or pressure, the anomaly in becomes weaker at but stronger at . This is consistent with nesting conditions that deteriorate at and improve at with increasing or . Finally, the new phase appears to compete with superconductivity, as does the antiferromagnetic order. Below , increases while decreases with pressure. Above , as the new phase grows, drops and the dependence of on deviates (Fig. 4).
In summary, we report an anomaly in the temperature dependence of the resistivity of underdoped Ba1-xKxFe2As2 for GPa that signals the onset of a Fermi-surface reconstruction at a temperature below the antiferromagnetic temperature . We attribute this reconstruction to a new phase that onsets below . Whether this phase involves order in the spin, charge or orbital degree of freedom remains to be determined. However, the overall phenomenology is consistent with a scenario of two related spin-density-wave phases setting in successively at and , with wavevectors and , respectively.
We thank A. V. Chubukov, R. Fernandes, I. R. Fisher, S. A. Kivelson, J. Schmalian and R. Thomale for fruitful discussions and J. Corbin for his assistance with the experiments. The work at Sherbrooke was supported by a Canada Research Chair, CIFAR, NSERC, CFI and FQRNT. The work at the Ames Laboratory was supported by the DOE-Basic Energy Sciences under Contract No. DE-AC02-07CH11358. The work in China was supported by NSFC and the MOST of China (#2011CBA00100).
References
- (1) P. Monthoux et al., Nature 450, 1177 (2007).
- (2) N. Doiron-Leyraud et al., Phys. Rev. B 80, 214531 (2009).
- (3) G. Knebel et al., C. R. Phys. 12, 542 (2011).
- (4) K. Jin et al., Nature 476, 73 (2011).
- (5) N. Doiron-Leyraud and L. Taillefer, Physica C 481, 161 (2012).
- (6) L. Taillefer, J. Phys.: Condens. Matter 21, 164212 (2009).
- (7) L. Taillefer, Annu. Rev. Condens. Matter Phys. 1, 51 (2010).
- (8) P. C. Canfield and S. L. Budk’o, Annu. Rev. Condens. Matter Phys. 1, 27 (2010).
- (9) S. K. Kim et al., Phys. Rev. B 84, 134525 (2011).
- (10) S. Avci et al., Phys. Rev. B 85, 184507 (2012).
- (11) D. K. Pratt et al., Phys. Rev. Lett. 103, 087001 (2009).
- (12) B. Shen et al., Phys. Rev. B 84, 184512 (2011).
- (13) H.-Q. Luo et al., Supercond. Sci. Technol. 21, 125014 (2008).
- (14) I. R. Walker, Rev. Sci. Instrum. 70, 3402 (1999).
- (15) W. J. Duncan et al., J. Phys.: Condens. Matter 22, 052201 (2010).
- (16) T. Kondo et al., Phys. Rev. B 81, 060507 (2010).
- (17) N. Ru et al., Phys. Rev. B 77, 035114 (2008).