11email: jsm@iaa.es 22institutetext: Institute for Astronomy, University of Edinburgh, Royal Observatory, Blackford Hill, EH9 3HJ Edinburgh, UK 33institutetext: ALMA, European Southern Observatory, Alonso de Córdova, 3107, Santiago, Chile
The AMIGA sample of isolated galaxies
Abstract
Context. This paper is part of a series involving the AMIGA project (Analysis of the Interstellar Medium of Isolated GAlaxies), which identifies and studies a statistically significant sample of the most isolated galaxies in the northern sky.
Aims. We present a catalogue of nuclear activity, traced by optical emission lines, in a well-defined sample of the most isolated galaxies in the local Universe, which will be used as a basis for studying the effect of the environment on nuclear activity.
Methods. We obtained spectral data from the 6th Data Release of the Sloan Digital Sky Survey, which were inspected in a semi-automatic way. We subtracted the underlying stellar populations from the spectra (using the software Starlight) and modelled the nuclear emission features. Standard emission-line diagnostics diagrams were applied, using a new classification scheme that takes into account censored data, to classify the type of nuclear emission.
Results. We provide a final catalogue of spectroscopic data, stellar populations, emission lines and classification of optical nuclear activity for AMIGA galaxies. The prevalence of optical active galactic nuclei (AGN) in AMIGA galaxies is 20.4%, or 36.7% including transition objects. The fraction of AGN increases steeply towards earlier morphological types and higher luminosities. We compare these results with a matched analysis of galaxies in isolated denser environments (Hickson Compact Groups). After correcting for the effects of the morphology and luminosity, we find that there is no evidence for a difference in the prevalence of AGN between isolated and compact group galaxies, and we discuss the implications of this result.
Conclusions. We find that a major interaction is not a necessary condition for the triggering of optical AGN.
Key Words.:
galaxies: evolution – galaxies: interaction – galaxies: active – surveys1 Introduction
It is widely accepted that galaxy evolution is strongly influenced, or even driven, by environment (nurture; see e.g. Park & Choi 2009; Liu et al. 2012, and references therein). Galaxy interactions are thought to induce nuclear activity by removing angular momentum from the gas and, in this way, feeding the central black hole (Shlosman et al. 1990; Barnes & Hernquist 1991; Haan et al. 2009; Liu et al. 2011). Hence, a higher rate of active galactic nuclei (AGN) is expected among interacting galaxies.
However, different studies have yielded contradictory results: some studies find a higher local density of companions near galaxies hosting an AGN or a higher prevalence of AGN in interacting galaxies (Petrosian 1982; Dahari 1985; MacKenty 1990; Rafanelli et al. 1995, 1997; Alonso et al. 2007; Ellison et al. 2011; Liu et al. 2012), while others find no excess, or only a marginal excess (Bushouse 1986; Laurikainen & Salo 1995; Schmitt 2001; Miller et al. 2003; Ellison et al. 2008; Li et al. 2008). Schawinski et al. (2009, 2010) found a clear relation between some AGN and the signatures of a previous merger. In recent studies the relation between X-Ray AGN and environment was also explored (Silverman et al. 2009; Haggard et al. 2010; Tasse et al. 2011), finding that this relation may depend on the mass of the host galaxy (Silverman et al. 2009). Another possible source of discrepancy involves the methodology used to establish the presence of an AGN. Subtraction or non-subtraction of the stellar component from the nuclear light may lead to differences in the nuclear emission classification. This is particularly true for weak emission lines, which might be affected not just by a low signal-to-noise ratio, but also by details of the stellar spectrum (Ho et al. 1997). The use of different classification criteria to evaluate whether the nuclear emission is powered by star formation (SF) or by an AGN also complicates the direct comparison of results found in different studies.
The AMIGA project (Verdes-Montenegro et al. 2005, Analysis of the interstellar Medium in Isolated GAlaxies; http://amiga.iaa.es/) was initiated to separate the effect of galaxy interactions from the intrinsic evolution in a galaxy. AMIGA provides a panchromatic characterisation of a well-defined and statistically significant sample of isolated galaxies. AMIGA can be described as a vetted or value-added catalogue, based upon the Catalogue of Isolated Galaxies (CIG; Karachentseva 1973), which is composed of 1050 galaxies compiled using an isolation criterion that implies that the galaxies have probably been unperturbed for 3 Ga (Verdes-Montenegro et al. 2005)111We will follow the recommendations for units of the IAU Style Manual (Wilkins 1995). Hence, we use the term annus, abbreviated as “a”, for year (a - annus - year; Ma - Megaannus - Megayear; Ga - Gigaannus - Gigayear).. Dwarf companions (B-18 to -15 depending on distance) are not (cannot be) excluded, but the degree of isolation from major companions (greater than 10% of the mass of the primary) was re-evaluated and quantified for each galaxy in terms of both the local number density of neighbours and tidal strength (Verley et al. 2007b, a).
Multiwavelength studies of the AMIGA sample (data released via a Virtual Observatory interface) have placed special emphasis on structural parameters as well as different components/phases of the interstellar medium. Our studies suggest that the most isolated galaxies show different properties than less isolated field samples. AMIGA early-type galaxies are usually fainter than late-types in the B-band and most spirals in our sample appear to host pseudo-bulges and not classical bulges (Verdes-Montenegro et al. 2005; Sulentic et al. 2006; Durbala et al. 2008b). AMIGA spiral galaxies are redder than similar type galaxies in close pairs, showing a Gaussian distribution of the (gr) colours with a smaller median absolute deviation (almost half) compared to galaxies in wide and close pairs. Properties such as far-infrared (FIR) and radio continuum emission, which usually show enhancement in interacting galaxy samples (Darg et al. 2010), show levels in AMIGA that are at or below those measured in any other galaxy samples: This has been shown for, (Lisenfeld et al. 2007), (Leon et al. 2008), radio-excess above the radio-FIR correlation (0%; Sabater et al. 2008; Sabater 2009), the H i asymmetry (Espada et al. 2011), and the molecular gas content (Lisenfeld et al. 2011). AMIGA galaxies are also located in the lowest environmental densities (Verley et al. 2007a) and do not present any morphological signatures of interactions (Sulentic et al. 2006).
Here, we present a catalogue of nuclear properties for AMIGA galaxies obtained from optical spectra provided by the Sloan Digital Sky Survey (SDSS; York et al. 2000; Adelman-McCarthy et al. 2008) in its 6th Data Release. In Sect. 2 we present the sample of galaxies used in this study and describe the compilation and reduction of the data, including the subtraction of the stellar contribution from the nuclear spectra and the measurement of emission lines. The method used for the classification of the nuclei, which takes into account the presence of censored data, is presented in Sect. 3, together with the final classification of the nuclei and its relation with the properties of the galaxies. A comparison with galaxies in a denser environment (compact groups) is analysed in Sect. 4. Finally, we present a summary of the work, followed by a discussion about the effect of major-mergers in the triggering of nuclear activity and our conclusions, in Sect. 5
2 Data
2.1 The sample
We adopted the AMIGA sample of isolated galaxies as the nurture-free base sample for our study. The isolation criteria for AMIGA galaxies imply nearest-neighbour crossing times of Ga or more (Verdes-Montenegro et al. 2005; Verley et al. 2007a; Argudo-Fernández et al. 2012, in prep.). This, and the properties of the sample presented in the introduction, lead us to hypothesize that AMIGA galaxies were not affected by major tidal interactions during the last part of their lifetime.
The SDSS provides a large homogeneous database of optical spectra from which line ratios can be extracted and quantified to investigate nuclear activity. We used Data Release 6 (DR6), which was the one available when we started the study. We found a total of 549 AMIGA galaxies in the SDSS-DR6 database (Adelman-McCarthy et al. 2008) with nuclear spectra for 362 of the galaxies. We found that spectra for 353 galaxies could be used for the present study as explained in Sect. 2.3. Henceforth, we refer to this subset of isolated galaxies as the SDSS sample.
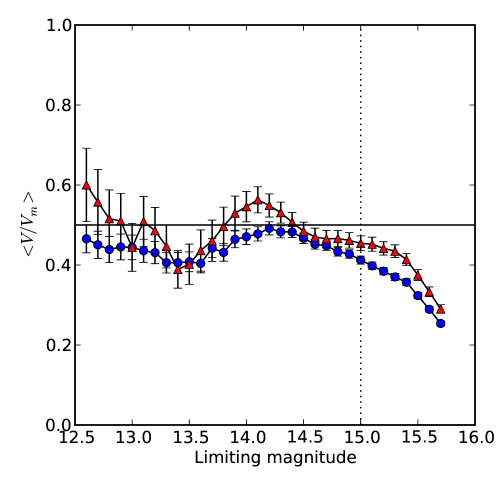
We estimated the completeness of the SDSS sample using a test (as in Verdes-Montenegro et al. 2005) and found it to be even more complete than the full AMIGA sample up to a limiting magnitude of (see Fig. 1). This reflects the completeness and uniformity of data within the region of sky covered by SDSS. For studies that require statistical significance and completeness we selected those galaxies with in the range 11.0 to 15.0 (Lisenfeld et al. 2007). We excluded galaxies flagged as interacting in Sulentic et al. (2006, marked with the parameter I/A = yes) as well as local dwarf galaxies CIG 663 (UMi dwarf) and CIG 802 (Draco dwarf). We refer to this sample, composed of galaxies, as the SDSS complete sample.
2.2 Morphology and luminosity
To study the relation of the nuclear activity type with the properties of the host galaxies we also used morphological data, optical luminosity and near-infrared (NIR) luminosity. The morphological data are based on work presented in Sulentic et al. (2006) and Fernández Lorenzo et al. (2012). Optical luminosities () were presented in Verdes-Montenegro et al. (2005) and were refined based on new distances for AMIGA galaxies and a careful revision of the velocities and corrections (Fernández Lorenzo et al. 2012). The infrared luminosity was derived from the -band (2.159 ) magnitude obtained from the Two Micron All Sky Survey (2MASS) extended source catalogue (Jarrett et al. 2000). The was obtained from the total (extrapolated) flux considering that , where the distance to the galaxy, the central frequency of the Ks band and the flux density derived from the magnitude in the catalogue. Finally, the luminosity was normalised by the solar luminosity in Ks band (LK,☉). After a visual inspection we found some galaxies associated with two 2MASS sources within our search radius. In each case, the flux of the brighter one is the one corresponding to the whole galaxy, hence it was selected for these galaxies (Lisenfeld et al. 2011). Although a mass-to-luminosity ratio could be applied to derive a total stellar mass (Cole et al. 2001), it depends on the star formation history of the galaxy and on the initial mass function considered (Bell & de Jong 2001; Bell et al. 2003). Hence, we directly used as an estimator of the stellar mass content of the galaxy. The optical and infrared luminosities, as well as the morphological classification, are presented in Table 1.
| CIG | 2 | 2 | code3 | 2,4 | morpho.4 |
| Jy | [LK,☉] | [L☉] | RC3 | ||
| 1 | 1 | 10.57 | |||
| 2 | 1 | 9.84 | |||
| 3 | |||||
| 4 | 1 | 10.28 | |||
| 5 | 1 | 9.95 | |||
| 6 | 1 | 9.80 | |||
| 7 | 1 | 10.35 | |||
| … | … | … | … | … | … |
-
1 AMIGA sample ().
-
2 Units: given in units of -band solar luminosity (L); given in units of solar bolometric luminosity (L); .
-
3 Code for the infrared luminosity: if the galaxy does not have distance data; 0 if the galaxy does not have NIR data; 1 if the galaxy has NIR data and distance; 2 if there are 2 NIR sources for the galaxy, the brightest one is selected (see text).
-
4 and morphology data from Fernández Lorenzo et al. (2012).
Additional data on the nuclear activity of AMIGA galaxies were presented in Sabater et al. (2008) and Sabater (2009). The classifications in those papers were taken from the literature, and obtained from the study of the radio-FIR correlation and the FIR colour.
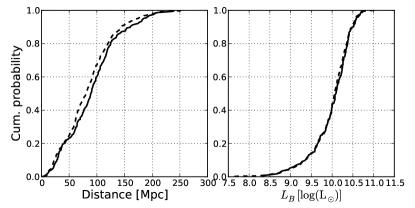
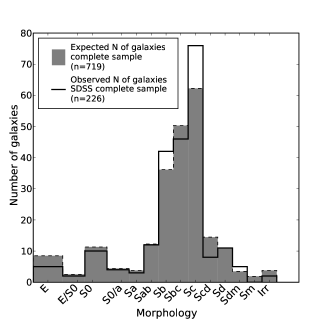
We tested whether the SDSS complete sample represents well some fundamental properties of its parent sample (the AMIGA complete sample, Lisenfeld et al. 2007). In Fig. 2 the cumulative distributions of distances and luminosities are shown (left and right panels, respectively) for the AMIGA complete sample and the SDSS complete sample. To quantify the comparisons we used a Kolmogorov-Smirnov two-sample test (K-S; Kolmogorov 1933; Smirnov 1936) to estimate the likelihood that the SDSS and AMIGA samples are derived from the same (undefined) parent population. The K-S test significance levels are 0.15 and 0.69 for comparisons of distance and source luminosity, respectively. These values are sufficiently high to support the hypothesis that the two samples come from the same parent population at a 10% significance level (, which is widely used in the literature). We also applied a test to compare the morphology distribution of the two samples. This test is especially suitable in this case because of the discrete nature of the morphological classification. Fig. 3 presents the morphological distribution of classifications. As we can see in the figure, and as the test confirms, the distributions are very similar in all cases. The significance level is higher than (p-value = 0.484). Therefore, we have no reason to reject the hypothesis that the SDSS sample follows the same distribution as the parent sample at a significance level of 10%. We therefore conclude that no clear bias exists in the SDSS complete sample relative to the AMIGA complete sample and we consider the SDSS complete sample used in this study to be representative of the AMIGA complete sample.
2.3 SDSS spectroscopic data
Spectra were found for AMIGA galaxies in the SDSS DR6 catalogue. Nuclear spectra were available for 362 of these galaxies and non-nuclear spectra were discarded for our study. We downloaded the corresponding spectra and compiled the flux density, its error and the error mask for each wavelength.
We extracted measures using an alternative reduction pipeline of the SDSS data (called specBS). This Princeton University product is publicly available at http://spectro.princeton.edu/ where the spectral parameters are determined via a comparison with carefully selected templates of stars, galaxies and quasars from the SDSS and ELODIE surveys (Moultaka et al. 2004). This resulted in improved measures of the velocity dispersion and the redshift. The velocity dispersion could be reliably determined for 42% of the galaxies in our sample using the standard pipeline and 98% of the galaxies using the Princeton pipeline. Redshift discrepancies between the two procedures were negligible (there are only three galaxies with a difference of more than 100 km/s) although the uncertainty in the redshift measurements is lower using the Princeton pipeline. As a final test, we visually checked all spectra and found that some of them had regions in which spectral data was missing. In some of the cases the spectral gaps did not affect the regions of interest for this study. In only one case (CIG 347) the entire spectral data were corrupted.
After flagging galaxies with bad spectral regions, we have galaxies for our study of nuclear spectra in the AMIGA sample. The spectroscopic data are presented in Table 2. In the column “Comments” we marked galaxies with bad spectral data. These nine flagged galaxies were not included in our study to avoid inhomogeneities in the data sample. K-S two sample tests were performed among the raw sample, the clean sample and the flagged galaxies for the distance, optical luminosity and B magnitude. Throughout, the p-values were higher than 0.8. A was applied for the morphology and a p-value of 0.99 was found. The properties (luminosity, morphology and distance) of the flagged galaxies are comparable to those of the remaining galaxies; consequently, no bias is expected to be introduced by removing them.
| CIG | plate | mjd | fiberId | Compl.2 | z | V. disp. | z (specBS) | V. disp. (specBS) | Comm.3 |
| km/s | km/s | ||||||||
| 11 | 389 | 51795 | 208 | 1 | - | ||||
| 16 | 390 | 51900 | 522 | 0 | |||||
| 19 | 753 | 52233 | 95 | 0 | |||||
| 56 | 400 | 51820 | 582 | 1 | - | ||||
| 60 | 401 | 51788 | 223 | 1 | - | ||||
| 187 | 1864 | 53313 | 171 | 1 | |||||
| 189 | 1865 | 53312 | 417 | 1 | |||||
| … | … | … | … | … | … | … | … | … | … |
-
1 AMIGA galaxies with SDSS DR6 nuclear spectra (). Columns: (1) CIG catalogue number; (2) SDSS plate; (3) SDSS modified Julian date; (4) SDSS fiber Id; (5) code for membership in the complete sample;2 (6) redshift and its uncertainty; (7) velocity dispersion and uncertainty; (8) redshift from the specBS pipeline and uncertainty; (9) velocity dispersion from the specBS pipeline and uncertainty and (10) comments.
-
2 Code of completeness: 1 if the galaxy belongs to the SDSS complete sample and 0 otherwise.
2.4 Stellar populations
The spectrum of a galaxy includes contributions from both stellar (absorption) and gaseous (emission) line components. Both are of potential interest but they must be separated to draw any quantitative conclusions. The stellar absorption spectrum must be extracted to perform a reliable fitting of the emission lines (Ho et al. 1997). Most methods used to determine the stellar populations are based on templates of stellar absorption-line spectra that are used as the basis to fit the stellar component (e.g. Ho et al. 1997; Engelbracht et al. 1998; Kauffmann et al. 2003b; Cid Fernandes et al. 2005; Hao et al. 2005). The library of templates should be large to allow the fitting of stellar templates that reflect a wide dispersion in galaxy properties such as metallicities, ages and velocity dispersions. From among the available codes we selected Starlight (Cid Fernandes et al. 2005), not only because of its ability to accurately determine the properties of the underlying populations, but also because it is publicly available, easy to use, and well documented.
Starlight is designed to fit an observed spectrum with a model (Cid Fernandes et al. 2005; Mateus et al. 2006; Asari et al. 2007) composed of spectral components from a pre-defined set of input spectra. The spectral base can be made up of observed template spectra, evolutionary synthesis models (Cid Fernandes et al. 2004, 2005), individual stars, etc. We used 45 synthetic spectra from Bruzual & Charlot (2003) as the spectral base, with three metallicities (Z) and 15 different ages. The 3 metallicities are: 0.004 (0.2 Z☉), 0.02 (Z☉) and 0.05 (2.5 Z☉) and the 15 ages are: 1.0 Ma, 3.16 Ma, 5.01 Ma, 10.0 Ma, 25.12 Ma, 40.0 Ma, 101.52 Ma, 286.12 Ma, 640.54 Ma, 904.79 Ma, 1.434 Ga, 2.5 Ga, 5.0 Ga, 11.0 Ga and 13 Ga. These base spectra are distributed together with Starlight and reliably fit the stellar populations of typical SDSS galaxies (Cid Fernandes et al. 2005). The age-Z degeneracy is estimated to slightly bias the estimation of the average of Z and log(age) at the level of up to dex (Cid Fernandes et al. 2005; Cid Fernandes & González Delgado 2010; González Delgado & Cid Fernandes 2010).
We developed a software to adapt the original SDSS spectra to the input of Starlight, which performed the following tasks: a) uniform re-sampling of the spectra with a final resolution of 0.1 nm and transformation from vacuum to air wavelengths based on IAU standards (Morton 1991); b) dereddening of the flux and its uncertainty based on the dust emission maps of Schlegel et al. (1998) and the extinction curve by O’Donnell (1994), which is an improvement of the extinction curve of Cardelli et al. (1989) in the optical and the near infrared; and c) shifting of the spectra to the rest-frame using the redshifts from the Princeton SDSS data (specBS). The initial values of the velocity dispersions were also extracted from the Princeton data (see Table 2).
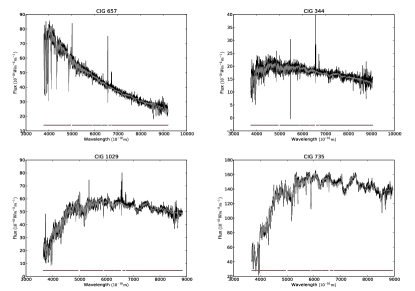
In Table 3 we present the following physical parameters estimated by Starlight: the velocity shift of the spectrum with respect to the rest frame, the velocity dispersion of the stellar populations, and the extinction. In a few cases (4.7%) Starlight found slightly negative extinctions, which may indicate that the determination of the underlying stellar populations is not fully reliable; however, the fitted spectra are sufficient to remove the absorption features. All fits are clear-cut except for some of the few () galaxies that present strong broad lines. But the emission spectra of these galaxies are not needed for their classification. In Table 4 we present the breakdown of stellar populations found by Starlight to best fit each spectrum, indicated by the percentage of each different stellar population. Four examples of fits are shown in Fig. 4.
| CIG | v shift | v disp. | Aν 2 |
|---|---|---|---|
| km/s | km/s | ||
| 11 | -36.82 | 55.14 | 0.6932 |
| 16 | -37.38 | 93.08 | -0.0750 |
| 19 | -37.82 | 165.12 | 0.1241 |
| 56 | 3.03 | 114.42 | 0.6307 |
| 60 | -16.99 | 52.00 | 0.5313 |
| 187 | -46.87 | 79.07 | 0.3914 |
| 189 | -39.79 | 183.45 | 0.0660 |
| … | … | … | … |
-
1 SDSS sample, narrow lines (). Columns: (1) CIG catalogue number; (2) shift in velocity computed by Starlight; (3) velocity dispersion of the stellar component; (4) extinction computed by Starlight.
-
2 In a few cases the computed extinction has slightly negative values (see text, Sect. 2.4).
| CIG | Age | Metallicity | Percentage |
|---|---|---|---|
| Ma | Z | % | |
| 11 | 1 | 0.004 | 0.0000 |
| 11 | 3.16 | 0.004 | 0.0000 |
| 11 | 5.01 | 0.004 | 2.9137 |
| 11 | 10 | 0.004 | 6.0817 |
| … | … | … | … |
| 11 | 11000 | 0.050 | 1.9735 |
| 11 | 13000 | 0.050 | 0.0000 |
| 16 | 1. | 0.004 | 0.0000 |
| … | … | … | … |
-
1 SDSS sample, narrow lines, 45 populations per galaxy (). Columns: (1) CIG catalogue number; (2) age of the stellar population in megayears (Ma); (3) metallicity; (4) contribution of this stellar population.
The synthetic spectra obtained from the combination of stellar populations (as indicated in Table 4) are available online at the AMIGA web page (http://amiga.iaa.es/).
2.5 Emission lines
Using the stellar populations derived from the Starlight program, we estimated the separate contribution of the emission from the interstellar medium, and the AGN emission, if present. The synthetic spectrum of the stellar populations was subtracted from the initial spectrum for each galaxy not flagged in Table 2 (galaxies with narrow lines and good data; ), and the narrow lines found in the resulting spectra were measured using a semi-automatic Gaussian fit.
As will be explained in the next section, there are specific emission lines that can be used to provide a diagnostic test for the presence of an AGN. We therefore performed the fitting in five different spectral regions: a) the H region, b) the [O iii] region, c) the [O i] region, d) the H and [N ii] region, and e) the [S ii] region. If nearby lines existed (closer than 0.0030 in units), we used a single fitting region for all nearby lines. Those regions correspond to [N ii] and H and to [S ii]. To remove any residual continuum emission from the subtraction of the underlying stellar spectrum, we subtracted a linear continuum baseline for each region. An estimate of the best fit to the lines in each region was computed by developing an automatic pipeline, then the estimated fit was visually checked and changed where needed. Line fluxes were calculated using the area below the fitted Gaussian: , where width is the standard deviation of the fitted Gaussian. The associated error is proportional to the noise in the spectral region and is calculated as, , where is the rms continuum noise. When the line peak is below significance, the upper limit is calculated as, . The line parameters are presented in Table 5. The fluxes of the detected emission lines were subsequently compared with those obtained from the MPA-JHU SDSS catalogues222http://www.mpa-garching.mpg.de/SDSS/DR7/. The line flux ratios are consistent within the error for all measurements.
| CIG | Line | Flux | Peak intensity | Width | Pos. | Comment | |
|---|---|---|---|---|---|---|---|
| 11 | H (6563) | 136.1487 | 1.6597 | 6563.50 | 0.8954 | ||
| 11 | 6548 | 13.2799 | 1.6964 | 6548.78 | 0.8954 | ||
| 11 | 6583 | 43.9571 | 1.6964 | 6584.18 | 0.8954 | ||
| … | … | … | … | … | … | … | … |
| 11 | 6730 | 14.7222 | 1.6671 | 6731.64 | 0.8616 | ||
| 16 | H (6563) | 5.9584 | 2.5002 | 6560.72 | 1.2170 | ||
| 16 | 6548 | 1.9993 | 2.5002 | 6550.32 | 1.2170 | ||
| … | … | … | … | … | … | … | … |
-
1
SDSS sample, narrow lines, eight lines per galaxy (). Columns: (1) CIG catalogue number; (2) name of the line. Numerical codes in the electronic version: 0 - H ( m), 1 - m, 2 - m, 3 - H ( m), 4 - m, 5 - m, 6 - m, 7 - m; (3) flux of the line, the symbol ’’ indicates that the flux is an upper limit; (4) peak intensity of the line; (5) width of the line; (6) central wavelength of the line; (7) estimated noise for the line region; (8) comments about the measurement of the line.
-
2
Equivalences of units: and .
3 Classification and properties of the AGN
Some galaxies in the SDSS sample show broad emission lines and were directly classified as Seyfert 1. Since the Seyfert 1/Seyfert 2 separation was not the main aim of the work, we classified the Seyfert type of the galaxies by visual inspection. We found nine Seyfert 1 galaxies (CIG 204, 214, 336, 349, 719, 747, 749, 893, 1008) 333AGN classification obtained from the literature in Sabater et al. (2008): CIG 214 - Sy 1.0; CIG 349 - Sy 1.5; CIG 719 - Sy 1.0; CIG 1008 Sy 1.2 and among them seven clearly exhibited a broad H line. CIG 336 and 893 showed a faint broad H component but, because of the broad width of the [N ii] lines we classified them as Seyfert 1. In a future work we will use a parametric classification scheme like the one in Hao et al. (2005) and Martínez et al. (2008).
Galaxies presenting only narrow lines were classified using the standard emission line diagnostic diagrams (Baldwin et al. 1981; Veilleux & Osterbrock 1987). Line ratios adopted as suitable diagnostics were a) , primarily an indicator of mean ionization level and temperature; b) , which is less immediately obvious but provides a good separation between star-forming nuclei and AGN (Osterbrock & Ferland 2006); c) and , as indicators of the relative importance of an extended partially ionised zone produced by high-energy photoionization. These ratios were grouped to form the three following diagnostic diagrams:
-
•
vs. (from here-on [N ii] diagram).
-
•
vs. ([S ii] diagram).
-
•
vs. ([O i] diagram).
The line ratio measures used in the diagnostic diagrams for the AMIGA SDSS sample are presented in Table 6. A ratio is given as an upper or a lower limit if only an upper limit was measured for one of the lines. When both lines in a ratio involved upper limits, the corresponding field is left blank.
| CIG | ||||
|---|---|---|---|---|
| 11 | ||||
| 16 | - | |||
| 19 | ||||
| 56 | ||||
| 60 | ||||
| 187 | ||||
| 189 | - | - | - | - |
| … | … | … | … | … |
-
1
SDSS sample, narrow lines (). The first column is the CIG catalogue number. The other columns are the different line ratios used in the diagnostic diagrams. The presence of an upper or a lower limit is indicated with a ’’ or a ’’ symbol, respectively. The precision of the numbers is adjusted for the error to have two significant digits.
Veilleux & Osterbrock (1987) proposed several semi-empirical boundaries within the diagnostic diagrams including a theoretical starburst region and objects showing other types of excitation such as AGN. LINERs were defined as a separate class of nuclei by Heckman (1980), and Ho et al. (1997) defined similar classification criteria using the [O i] diagram to distinguish between Seyfert 2 and LINER nuclei (see also the review of Ho 2008). We used the theoretical curves proposed by Kewley et al. (2001) to separate narrow line AGN (NLAGN; above the curves) from SF nuclei (SFN; below the curves; in the [S ii] and [O i] diagrams) and the empirical curve of Kauffmann et al. (2003a) to select SF nuclei (SFN; below the curve in the [N ii] diagram). Galaxies between both curves in the [N ii] diagram were considered to harbour a transition object (TO; composite of SFN and NLAGN). To separate Seyfert 2 and LINERs, we used the empirical classification scheme provided by Kewley et al. (2006) for the [S ii] and the [O i] diagrams. If only one of the two line ratios was available for a given diagnostic diagram, a definitive classification can be obtained from that line ratio in some cases (Miller et al. 2003; Martínez et al. 2008), e. g. or for AGN.
Censored data (upper and lower limits) were taken into account for the classification. Some galaxies can be unambiguously classified despite the presence of an upper limit. For example, a galaxy located below the Kauffmann et al. (2003a) curve (SFN region) is classified as SFN even if there is an upper limit in the ratio. We can classify 11% more galaxies (increasing the overall classification fraction from 84% to 95%) if upper limits are considered (see Sect. 3.1 for a more detailed comparison).
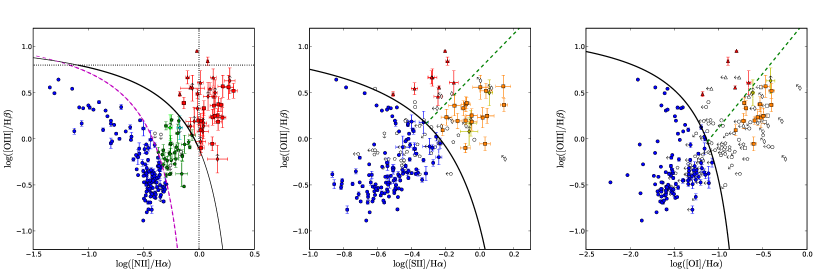
The left panel of Fig. 5 shows the [N ii] diagnostic diagram for the SDSS complete sample (although classification criteria were applied to all galaxies in the SDSS sample). Galaxies classified as NLAGN typically have higher errors in their emission line ratios because the flux of their emission lines is usually lower than for SFN types. In the central and right panels of Fig. 5 the [S ii] and [O i] diagnostic diagrams are shown. The transition objects are widely spread in both the NLAGN and star-forming regions, as is usually found in the literature.
To adopt a final classification for each galaxy, we proceeded as follows. The classification obtained from the [N ii] diagram was given precedence over classifications inferred from other diagrams. In most cases there was agreement (although there are nine cases where a galaxy is classified as SFN using [N ii] and as AGN based on the other diagrams or vice versa). If an object could not be unambiguously classified using this diagram, the classification obtained with the other two diagrams was used if the two classifications agreed. We could not distinguish between TO or NLAGN for three galaxies, and between TO or SFN in three other cases. In these cases, we added both classifications to the database. Notice that some of the NLAGN cannot be sub-classified as LINER or Seyfert 2 using the [S ii] and [O i] diagrams and were entered as NLAGN in the database. If a transition object was classified as an AGN or SFN in the [S ii] and [O i] diagrams, we indicate this classification in the database in an additional “transition object type” column. The final classification is presented in Table 7, in which galaxies that presented broad lines have been added as Seyfert 1.
| CIG | [N ii] | [S ii] | [O i] | Final | TO |
|---|---|---|---|---|---|
| class. | class. | class. | class. | type3 | |
| 11 | SFN | SFN | SFN | SFN | - |
| 16 | - | - | - | - | - |
| 19 | NLAGN | LINER | - | LINER | - |
| 56 | SFN | SFN | SFN | SFN | - |
| 60 | SFN | SFN | SFN | SFN | - |
| 187 | NLAGN | Sy2 | - | Sy2 | - |
| … | … | … | … | … | … |
| 228 | TO | SFN | SFN | TO | SFN |
| … | … | … | … | … | … |
-
1
SDSS sample (). Columns: (1) CIG number; (2) classification with the [N ii] diagnostic diagram; (3) classification with the [S ii] diagnostic diagram; (4) classification with the [O i] diagnostic diagram; (5) final classification adopted for our study; (6) transition object subtype.
-
2
Acronyms: SFN - star-forming nucleus; TO - transition object; NLAGN - narrow line AGN (Seyfert 2 or LINER); LINER - LINER; Sy1 - Seyfert 1; Sy2 - Seyfert 2; UNK - unknown (only for the TO subtype). Three galaxies have no unambiguous classification between TO and NLAGN (“TO or NLAGN”) and three more between TO and SFN (“TO or SFN”), as explained in the text.
-
3
Subtype of transition object if classified as a TO (see text).
The definition of the lines of separation between different types of galactic nuclei in the diagnostic diagrams can affect the final classification of a galaxy (e.g. see Kewley et al. 2006 and Constantin & Vogeley 2006). Differences in the classification also arise from the method chosen for the final classification from the different diagnostics diagrams where these disagree, or the different handling of non-detected or upper limits in the line flux. New alternative classification methods (Buttiglione et al. 2010; Cid Fernandes et al. 2010) use different combinations of lines or derived parameters and classification schemes. Stasińska et al. (2008) studied the possibility that the emission of some of the galaxies in the region of AGN could actually be powered by stellar processes (hot post-asymptotic giant branch stars and white dwarfs; Binette et al. 1994). The classification proposed by Cid Fernandes et al. (2010) allows one to separate between “retired galaxies” (powered by these processes) and weak accretion-powered AGN (Cid Fernandes et al. 2011). All these differences in the definitions must therefore be taken into account to compare between different samples. For this reason, to allow a fair unbiased comparison with other samples, we kept and release all information (emission line fluxes, detection information, emission line ratios, classification for each diagnostic diagram and final classification) needed to allow a different classification scheme to be applied.
Using our classification criteria, we were able to perform a statistical study of the different types of galaxies found in the sample. The values obtained are listed in Table 8 both for the SDSS sample and the SDSS complete sample, although only the latter ones were considered for statistical purposes. The prevalence of optically selected active galactic nuclei for the AMIGA sample of isolated galaxies is 20.4%, or 36.7% including TOs.
| Classification | Total | Complete | Percentage |
| sample | sample | (complete sample) | |
| Unclassified: | 27 | 11 | 4.9% |
| Without emission lines | 8 | 4 | 1.8% |
| With emission line/s | 19 | 7 | 3.1% |
| Not unamb. classified: | 5 | 2 | 0.9% |
| TO or NLAGN | 1 | 1 | 0.4% |
| TO or SFN | 4 | 1 | 0.4% |
| Classified: | 321 | 213 | 94.2% |
| SFN | 191 | 130 | 57.5% |
| TO | 53 | 37 | 16.4% |
| AGN: | 77 | 46 | 20.4% |
| NLAGN total: | 68 | 41 | 18.1% |
| LINER | 27 | 18 | 8.0% |
| Sy2 | 10 | 9 | 4.0% |
| NLAGN | 31 | 14 | 6.2% |
| Sy1 | 9 | 5 | 2.2% |
| TO + AGN: | 130 | 83 | 36.7% |
| Total: | 353 | 226 | 100.0% |
3.1 Robustness of the classification method
The fraction of galaxies that can be classified and their final classification may depend on factors such as the signal-to-noise level of the spectrum, the classification method used, or the criteria used to assign a given type of nuclear activity depending on the classification obtained from the diagnostic diagrams.
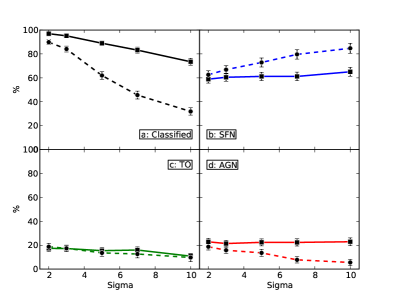
We tested the robustness of our classification method with respect to the signal-to-noise level of the spectra. The required detection level of the emission lines was raised from to , and (higher cut levels mimic a selection in observations taken with progresively lower signal-to-noise ratios). Then, we re-calculated the fraction of galaxies of each type using a) our method, which takes into account the information carried by upper limits and b) a classical classification method, which requires the detection of the four main emission lines (e.g. Kewley et al. 2006). The numbers are presented in Figure 6. The fraction of classified galaxies drops with the noise for both methods, but the drop is steeper for the classical method and, while with a cut level our method classifies 73% of the galaxies, the classical method classifies only 32% of the galaxies. The fraction of different types of galaxies remains almost constant with respect to the noise using our method, with a slight increase of the fraction of SFN with high cut levels () probably originating from the slight decrease of TOs. The classical method tends to overestimate the fraction of SFN and underestimate the fraction of AGN as the noise increases because only SFN galaxies have sufficiently strong emission lines to be detected over the noise. These figures suggest that our method not only obtains a higher rate of classifications, but also tends to be more robust in the classification of different types of galactic nuclei with respect to the signal-to-noise level.
We also checked the effect of lowering the detection level to to include weak emission lines (Cid Fernandes et al. 2010). We risked considering as detections some noise artefacts, but we can check if we are excluding many weak active nuclei. The overall effect for our sample is a very slight increase in the fraction of AGN galaxies. The relative fraction of different types of AGN over the total number of AGN is similar at 2, 3 and . From on, there is a drop in the fraction of LINERs ( of the classified NLAGN at 2, 3 and ; at and 20% at ) probably caused by missing retired galaxies with weak emission lines (Cid Fernandes et al. 2011).
3.2 Properties of the host galaxies
The relation between the chance for a galaxy to harbour an AGN and its stellar mass has been well-established for different manifestations of nuclear activity: optical (e.g., Kauffmann et al. 2003a), radio (Best et al. 2005), or X-ray (Tasse et al. 2011). The larger the stellar mass, the higher the probability of harbouring an AGN. It is also well known that there is a relation between nuclear activity and morphology (Moles et al. 1995). Accordingly, a higher fraction of AGN would be expected in more luminous galaxies and in earlier morphological types.
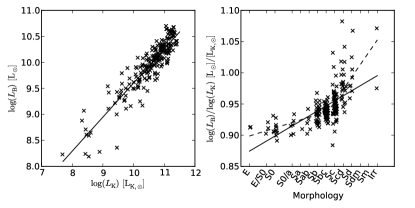
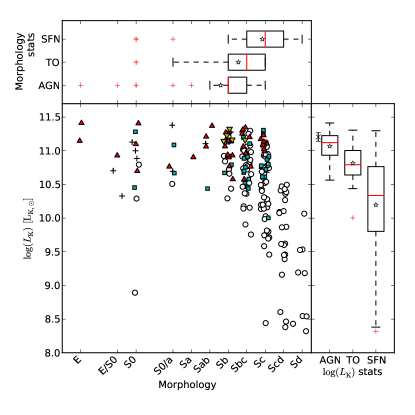
We studied some properties of the host galaxies with respect to the different types of nuclear activity found in the AMIGA sample. We considered only galaxies belonging to the SDSS complete sample to ensure statistical robustness. The relation of with is almost linear for AMIGA galaxies (Fig. 7). The fraction has a mean value of with a maximum value of 1.082 and a minimum of 0.884 and presents a clear correlation with the morphology, with higher values for late-types (Fig. 7). In Fig. 8 the relation of and the morphological type for galaxies in the SDSS complete sample that have NIR fluxes available (n = 211; 93.4%) is shown. We show the statistics for AGN, TOs and SFN as well. Active galactic nuclei are hosted by earlier types and higher luminosity galaxies than TOs, while just the opposite happens for SFN. Because early types present a bigger fraction of the galaxy mass in the spheroidal component and AMIGA galaxies harbour pseudo-bulges instead of classic bulges (Durbala et al. 2009), there might be a relation between the prevalence of AGN and the mass of the pseudo-bulge in AMIGA isolated galaxies.
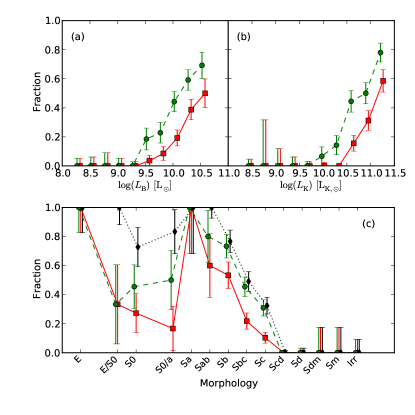
In Fig. 9 we show the fraction of AGN and AGN + TOs with respect to optical luminosity (; panel a), (proxy for stellar mass; panel b) and morphology (panel c). We also considered AGN plus TOs plus non-classified galaxies in the case of the morphology. There is a monotonic increase of the fraction of AGN galaxies with respect to and , similar to the one found in the literature. The trend is also similar considering the transition objects. In terms of morphology, there are no AGN or TOs found in very late-type (Scd to Irregular) galaxies. There is a monotonic increase in the fraction of AGN (from 0% to 100%) from type Sc to Sa, while earlier-types yield noisier results because there are few galaxies in these bins. There are four early-type galaxies presenting an SFN. Three of them (CIG 364, 498 and 620) are edge-on galaxies classified as S0 or S0/Sa, and CIG 503 is an S0 galaxy presenting Wolf-Rayet signatures (Brinchmann et al. 2008) and identified as an early-type star-forming galaxy by Temi et al. (2009) and Wei et al. (2010). The increase of the fraction of AGN is steeper with respect to than with respect to due to the correlation between and the morphological type: galaxies with higher and later type tend to have lower and vice versa, thus, reducing the steepness of the slope (see Fig. 7).
Seyfert 1 galaxies tend to present higher luminosities than narrow-line AGN galaxies, as shown in Fig. 8. This difference may be produced by weak broad lines that are missed in galaxies with lower luminosities because of the lower signal-to-noise level or the direct detection of the AGN light in the luminosity measurements. There is no clear dependence on luminosity for the other types of AGN, but the fraction of LINERs relative to the number of classified NLAGN (LINER + Sy2) depends strongly on the morphological type. It ranges from 25% for Sc types to 83% for Sab and earlier types (Sc - 25%; Sbc - 50%; Sb - 82%; Sab and earlier - 83%). This trend is consistent with some of the LINERs being actually retired galaxies ionized by low-mass evolved stars (Cid Fernandes et al. 2011).
4 Comparison with galaxies in isolated denser environments
One of the main aims of this study is to determine the effect of the environment and interactions on the prevalence of nuclear activity. After estimating the normal level of nuclear activity for a sample of galaxies not affected by major interactions, a careful comparison with samples of galaxies in denser environments is required to quantify the effect of the environment/interaction. An unbiased comparison will require to take into account the effect of the density-morphology and the density-luminosity relations (Dressler 1980; Kauffmann et al. 2004; Blanton et al. 2005; Deng et al. 2009; Park & Choi 2009; Deng et al. 2011). The strong correlation of the fraction of AGN with morphology and luminosity (both optical and NIR) could otherwise produce a strong bias when comparing with samples that could be composed of galaxies with different morphologies and luminosities.
Some of the densest environments in the universe are in compact groups of galaxies, with projected galaxy densities similar to those found in the cores of dense clusters. Among them, Hickson Compact Groups (HCG; characterized by 4 to members with a low velocity dispersion km s−1; Hickson 1982) have been selected using an isolation criterion (Hickson 1982; Sulentic 1987; Hickson et al. 1992). This combination of high galaxy density in a low-density environment makes them a unique sample for comparison with isolated galaxies by minimising the possible effects of the large-scale environment. It is important to remark that AMIGA and HCG samples were defined using only isolation criteria.
Martínez et al. (2010) studied the optical nuclear activity of a complete well-defined sample of HCG galaxies () obtaining new spectroscopic measurements (), as well as archival spectra () and emission line measurements from the literature (). The spectra were corrected for absorption features from the underlying stellar populations, furthermore, the authors followed a classification scheme very similar to the one that we present in this paper: the diagnostic diagram used is the [N ii] one, separation lines are identical to ours and the line ratio is used when it is the only one with confident values. The mean signal-to-noise ratios of the coefficient for both samples are very similar (HCG - ; AMIGA - ).
The origin of the luminosity and morphology data used by Martínez et al. (2008) is HyperLeda (Paturel et al. 2003). We also obtained luminosity and morphology data from the HyperLeda catalogue for AMIGA galaxies. AMIGA curated data (presented in Sect. 2.2) present some fundamental differences compared to Hyperleda data, which render a direct comparison between them unsuitable. In particular, the optical luminosity is corrected for different effects (Fernández Lorenzo et al. 2012) and presents a systematic shift with respect to Hyperleda data. The difference in morphological classification, although very low on average (), presents a high dispersion (). Hence, we used HyperLeda data for the comparison between AMIGA and HCG to allow an homogeneous comparison. The morphological classification is coded into numbers using the RC3 morphological types system and the absolute magnitude was transformed into optical luminosity (B-band) using the relation . Finally, there are data for all but two AMIGA galaxies of the SDSS complete sample () and for all but one galaxy of the HCG sample (). The ranges and means of the optical luminosity are very similar for both samples (AMIGA: ; HCG: ) but the distribution of morphologies is quite different (AMIGA: ; HCG: ) with earlier types in compact groups (see upper panels of Fig. 10). We will present a method to take this different distribution into account.
4.1 Comparison method
An empirical probability density function (pdf) is built that considers the optical luminosity, morphology, and the classification as an AGN for a sample of galaxies. The definition is as follows:
where is the luminosity, the morphology in the RC3 system, and is a value that indicates whether the galaxy harbours an AGN () or not (). Note that in the summation term, a galaxy is only added if and are equal.
The partial probability density function with respect to the AGN activity represents the distribution in luminosity and morphology of the sample and is defined as . We can obtain for each and pair the mathematical expectation with respect to the values of a:
Hence, the probability for a galaxy to harbour an AGN for a given luminosity and morphology , derived from our empirical pdf, is: To compare the prevalence of AGN in two different samples, we can compare the actual number of AGN galaxies in the reference sample with the estimated number of AGN galaxies for a second sample calculated using the same but weighted by the actual distribution of and in the second sample. In other words, the estimated number of AGN galaxies in a region (R) of the plane for the second sample (), using the distribution of the first sample (), is
In that way, we can check whether estimated and actual values are compatible within the error (or not), in a given region, taking into account the effect of the luminosity and morphology distribution.
4.2 Comparison with galaxies in compact groups
There are 46 (20.5%) galaxies classified as AGN in the AMIGA sample and 66 (24.5%) galaxies classified as AGN in the HCG sample. The actual distribution of galaxies and AGN are shown in the upper panels of Fig. 10. Clearly, the distribution of galaxies is different in the two samples with later types in the AMIGA sample and earlier types in the HCG one. The distribution of AGN also looks different, but this may be caused just by the general distribution of galaxies in the sample. Hence, we applied the method described above to discard this possible bias. The number of AGN was compared in the region in common between the two samples defined by the intersection of regions in which 95.45% of the galaxies are within the area for each sample (equivalent to 2 sigma in a normal distribution). This common region contains AMIGA galaxies and HCG galaxies and is shown as a contour on the panels of Fig. 10. Values will be measured within this common region from now on. The fraction of Seyfert galaxies with respect to the total number of AGN in HCG is 37% (Martínez et al. 2010), while we find a fraction of in AMIGA galaxies. Therefore, we do not expect to be comparing very different types of AGN (or retired galaxies) between the two samples.
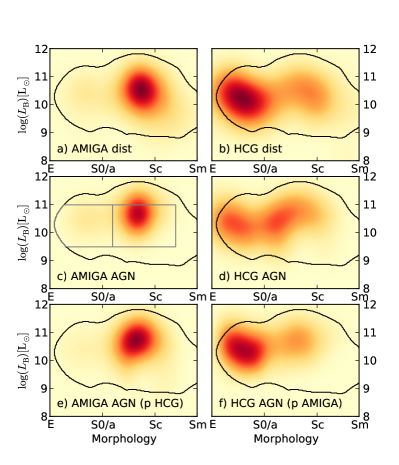
Table 9 shows the number of AGN in each sample. It also shows the number of AGN that would be obtained by combining the galaxy distribution of each sample with the AGN probability distribution of the other sample (as defined in Sect. 4.1). A binomial test comparing the observed with the cross-estimated number of AGN galaxies yields p-values well above the limit of for both samples. Hence, we cannot reject the hypothesis that the AGN fractions are the same, after correcting for the luminosity and morphology distribution. The lower panels of Fig. 10 show the cross-estimated distribution of AGN applying our method. The cross-estimated distributions (e and f) are not very different from the observed ones (c and d respectively), as is confirmed by the statistical tests. There is a slight discrepancy in the distribution of AGN for early spirals between the observed and estimated distribution in HCG (panels d and f) but the low number of galaxies in this region makes this difference less significant.
| Number of objects | p val.2 | |||
|---|---|---|---|---|
| p AMIGA | p HCG | |||
| AGN | AMIGA | |||
| (Fig. 10c) | (Fig. 10e) | |||
| HCG | ||||
| (Fig. 10f) | (Fig. 10d) | |||
| AGN + TO | AMIGA | |||
| HCG | ||||
| SFN | AMIGA | |||
| HCG | ||||
-
1
The rows correspond to the distribution of galaxies (sample) and the columns to the probability of harbouring an AGN, an AGN + TO or a SFN. The numbers in italics are the cross-estimated, calculated using the presented method.
-
2
The p-value is computed using a binomial test for a given probability and two different distributions.
We also compared the prevalence of AGN in both samples using a test. We were limited by the relatively low number of AGN in both samples, therefore, the bins were selected to allow a significant number () of observed and expected AGN in each one: a) Morphology from E to Sa and from 9.5 to 11.0, b) morphology from Sab to Sd and from 9.5 to 11.0, and c) the region out of the other two bins. The bins are shown in the left-middle panel of Fig. 10. The p-values for the comparisons are 0.181 and 0.165, both above the 0.1 limit, hence, AGN distributions in AMIGA and HCG are indistinguishable.
If we take into account both AGN and TOs, the p-value decreases (see Table 9) and there is increasing evidence of a difference between the distributions. This difference could be explained by the higher weight of the star formation component in TOs.
Finally, the fraction of SFN nuclei in both samples was compared. There is evidence of a low star formation rate (Verdes-Montenegro et al. 1998; Iglesias-Páramo & Vílchez 1999; Coziol et al. 2000) or even suppression of star formation (Sulentic et al. 2001; Durbala et al. 2008a) in compact groups. We checked if the rate of star formation was different after correcting for the morphology luminosity distribution. The result is shown in Table 9. In this case, we can reject the hypothesis that the prevalence of SFN in both samples is similar. We obtain always lower values in HCG even after the correction.
5 Discussion and conclusions
We presented a careful estimation of the optical nuclear activity in a well-defined, statistically significant sample of isolated galaxies using SDSS data. We aimed to determine the prevalence and properties of nuclear activity in galaxies not affected by major tidal interactions during the last part of their lifetime. To shed light on the effect of interaction on nuclear activity, we compared our sample with a sample of galaxies that are strongly affected by interaction (HCG galaxies).
From the 6th Data Release of the Sloan Digital Sky Survey, we obtained spectral data that were inspected in a semi-automatic way to ensure the accuracy of the data. We subtracted from the spectra the underlying stellar populations obtained using the software Starlight and fitted the emission lines. We applied the typical diagnostics diagrams to classify the type of nuclear emission using a classification scheme that takes into account censored data. A catalogue of spectroscopic data, stellar populations, emission lines and optical nuclear activity classification was provided. The entire intermediate data are released to allow the use of different nuclear activity classification criteria in the future. Finally, we presented a method to compare the prevalence of AGN with galaxies in denser environments that takes into account the effect of the density-morphology/luminosity relations to avoid a bias in the comparison. The prevalence of AGN and SFN was compared with galaxies in Hickson Compact Groups.
From the present study we found that
-
1.
Our nuclear activity classification method, which takes into account the information carried by censored data, seems to be robust with respect to an increase of the noise level.
-
2.
The prevalence of optical nuclear activity in AMIGA isolated galaxies is 20.4%. This percentage considers Seyfert 2, Seyfert 1, LINERs, and unclassified NLAGN (LINER or Seyfert 2). If we consider these types together with TOs, the percentage rises to 36.7%.
-
3.
The fraction of AGN increases steeply towards higher (proxy for stellar mass) or and earlier morphological types.
-
4.
We found no evidence of a difference between the population of AGN in AMIGA galaxies and in Hickson Compact Groups after correcting for the effect of the density-morphology/luminosity. On the other hand, we found significant evidence of a difference for SFN with a higher prevalence in isolated galaxies with respect to galaxies in HCGs, which is consistent with a lowered SF in HCG.
The isolation criteria for AMIGA galaxies imply nearest-neighbour crossing times of at least 3 Ga (Verdes-Montenegro et al. 2005; Verley et al. 2007a; Argudo-Fernández et al. 2012, in prep.) That fact, and the general properties of the sample, lead us to consider that AMIGA galaxies were not affected by major tidal interactions during the last part of their lifetime. The time-scale of the duty cycle of an AGN is very short (less than 100 Ma; Haehnelt et al. 1998; Greene & Ho 2007; Ho 2008; Schawinski et al. 2009) in comparison with the isolation time of our galaxies. Hence, AGN activity in AMIGA galaxies should be unrelated to a major interaction event.
Major interactions have been proposed as a mechanism to trigger AGN activity in some cases (see review by Combes 2003; Ellison et al. 2011; Liu et al. 2012), although no clear relation was found in some studies using the SDSS (Li et al. 2006, 2008). Seyferts do not require external interactions to be fueled (e.g. Combes 2003), thus, alternative mechanisms such as minor mergers, accretion of gas from cosmic filaments and/or internal mechanisms (Combes 2006) are needed to explain the presence of optical active nuclei in isolated galaxies. On the other hand, these alternative mechanisms do not trigger radio nuclear activity in isolated galaxies and an additional factor, linked to the environment (directly or indirectly), is needed to explain the presence of a radio jet (Sabater et al. 2008; Sabater 2009; Sabater et al. 2010).
If we consider a traditional feeding mechanism of black holes driven by major mergers (Kormendy et al. 2011), the relatively high fraction of AGN in isolated galaxies, dominated by pseudo-bulges (Durbala et al. 2009), might favour an alternative local feeding mechanism driven by the slow accretion of cold gas (Hopkins & Hernquist 2006). This mechanism is probably closer related to the activity found in galaxies with pseudo-bulges (Jiang et al. 2011). This could mean that the black holes found in AMIGA galaxies are close to the black hole seeds proposed by Kormendy et al. (2011), the seeds of the larger black holes that are grown by mergers.
The comparison with galaxies in compact groups yielded that the difference in the fraction of AGN between isolated galaxies and those in compact groups is not significant (after correcting for the morphology and luminosity distribution), while for SFN it is clearly significant. However, we recall that we are comparing fractions and not intensities or types of SF or AGN activity. One possible explanation is that the expected increase of AGN activity in HCG due to interactions (Ellison et al. 2011; Liu et al. 2012) could be compensated for by a decrease due to the environmental density (Kauffmann et al. 2004; von der Linden et al. 2010; Gavazzi et al. 2011). An additional consideration that has to be taken into account is the possible contamination of the different samples by retired galaxies, whose nuclear emission resembles the emission of weak AGN (usually LINERs) but is actually powered by low-mass evolved stars (Cid Fernandes et al. 2010, 2011). To clarify those points, the results of this paper will be extended in the future to study the independent effects of environment and interaction on the triggering of both optical and radio nuclear activity in a large homogeneously selected sample of SDSS galaxies.
Even though isolated galaxies do not present radio nuclear activity, the prevalence of optical nuclear activity is not negligible. Indeed, this leads us to conclude that a major interaction is not a necessary condition for the triggering of optical nuclear activity. Hence, at least part of the growth of a black hole could be produced without the need of a major merging event.
Acknowledgements.
We would like to thank the anonymous referee for numerous suggestions that improved the clarity of the paper. JSM, LVM, SL and JS were partially supported by DGI Grants AYA 2005-07516-C02-01, AYA 2008-06181-C02-01 and Junta de Andalucía (Spain) Grants TIC-114 and F08-FQM-4205. Funding for the SDSS and SDSS-II has been provided by the Alfred P. Sloan Foundation, the Participating Institutions, the National Science Foundation, the U.S. Department of Energy, the National Aeronautics and Space Administration, the Japanese Monbukagakusho, the Max Planck Society, and the Higher Education Funding Council for England. The SDSS Web Site is http://www.sdss.org/. The SDSS is managed by the Astrophysical Research Consortium for the Participating Institutions. The Participating Institutions are the American Museum of Natural History, Astrophysical Institute Potsdam, University of Basel, University of Cambridge, Case Western Reserve University, University of Chicago, Drexel University, Fermilab, the Institute for Advanced Study, the Japan Participation Group, Johns Hopkins University, the Joint Institute for Nuclear Astrophysics, the Kavli Institute for Particle Astrophysics and Cosmology, the Korean Scientist Group, the Chinese Academy of Sciences (LAMOST), Los Alamos National Laboratory, the Max-Planck-Institute for Astronomy (MPIA), the Max-Planck-Institute for Astrophysics (MPA), New Mexico State University, Ohio State University, University of Pittsburgh, University of Portsmouth, Princeton University, the United States Naval Observatory, and the University of Washington. This publication makes use of data products from the Two Micron All Sky Survey, which is a joint project of the University of Massachusetts and the Infrared Processing and Analysis Center/California Institute of Technology, funded by the National Aeronautics and Space Administration and the National Science Foundation. We acknowledge the usage of the HyperLeda database (http://leda.univ-lyon1.fr)References
- Adelman-McCarthy et al. (2008) Adelman-McCarthy, J. K., Agüeros, M. A., Allam, S. S., et al. 2008, ApJS, 175, 297
- Alonso et al. (2007) Alonso, M. S., Lambas, D. G., Tissera, P., & Coldwell, G. 2007, MNRAS, 375, 1017
- Argudo-Fernández et al. (2012) Argudo-Fernández, M., Verley, S., Sulentic, J., et al. 2012, in prep.
- Asari et al. (2007) Asari, N. V., Cid Fernandes, R., Stasińska, G., et al. 2007, MNRAS, 381, 263
- Baldwin et al. (1981) Baldwin, J. A., Phillips, M. M., & Terlevich, R. 1981, PASP, 93, 5
- Barnes & Hernquist (1991) Barnes, J. E. & Hernquist, L. E. 1991, ApJ, 370, L65
- Bell & de Jong (2001) Bell, E. F. & de Jong, R. S. 2001, ApJ, 550, 212
- Bell et al. (2003) Bell, E. F., McIntosh, D. H., Katz, N., & Weinberg, M. D. 2003, ApJS, 149, 289
- Best et al. (2005) Best, P. N., Kauffmann, G., Heckman, T. M., et al. 2005, MNRAS, 362, 25
- Binette et al. (1994) Binette, L., Magris, C. G., Stasińska, G., & Bruzual, A. G. 1994, A&A, 292, 13
- Blanton et al. (2005) Blanton, M. R., Eisenstein, D., Hogg, D. W., Schlegel, D. J., & Brinkmann, J. 2005, ApJ, 629, 143
- Brinchmann et al. (2008) Brinchmann, J., Kunth, D., & Durret, F. 2008, A&A, 485, 657
- Bruzual & Charlot (2003) Bruzual, G. & Charlot, S. 2003, MNRAS, 344, 1000
- Bushouse (1986) Bushouse, H. A. 1986, AJ, 91, 255
- Buttiglione et al. (2010) Buttiglione, S., Capetti, A., Celotti, A., et al. 2010, A&A, 509, A6+
- Cardelli et al. (1989) Cardelli, J. A., Clayton, G. C., & Mathis, J. S. 1989, ApJ, 345, 245
- Cid Fernandes & González Delgado (2010) Cid Fernandes, R. & González Delgado, R. M. 2010, MNRAS, 403, 780
- Cid Fernandes et al. (2004) Cid Fernandes, R., Gu, Q., Melnick, J., et al. 2004, MNRAS, 355, 273
- Cid Fernandes et al. (2005) Cid Fernandes, R., Mateus, A., Sodré, L., Stasińska, G., & Gomes, J. M. 2005, MNRAS, 358, 363
- Cid Fernandes et al. (2011) Cid Fernandes, R., Stasińska, G., Mateus, A., & Vale Asari, N. 2011, MNRAS, 413, 1687
- Cid Fernandes et al. (2010) Cid Fernandes, R., Stasińska, G., Schlickmann, M. S., et al. 2010, MNRAS, 403, 1036
- Cole et al. (2001) Cole, S., Norberg, P., Baugh, C. M., et al. 2001, MNRAS, 326, 255
- Combes (2003) Combes, F. 2003, in Astronomical Society of the Pacific Conference Series, Vol. 290, Active Galactic Nuclei: From Central Engine to Host Galaxy, ed. S. Collin, F. Combes, & I. Shlosman, 411–+
- Combes (2006) Combes, F. 2006, in Revista Mexicana de Astronomia y Astrofisica, vol. 27, Vol. 26, Revista Mexicana de Astronomia y Astrofisica Conference Series, 131–134
- Constantin & Vogeley (2006) Constantin, A. & Vogeley, M. S. 2006, ApJ, 650, 727
- Coziol et al. (2000) Coziol, R., Iovino, A., & de Carvalho, R. R. 2000, AJ, 120, 47
- Dahari (1985) Dahari, O. 1985, AJ, 90, 1772
- Darg et al. (2010) Darg, D. W., Kaviraj, S., Lintott, C. J., et al. 2010, MNRAS, 401, 1552
- Deng et al. (2011) Deng, X.-F., Chen, Y.-Q., & Jiang, P. 2011, MNRAS, 417, 453
- Deng et al. (2009) Deng, X.-F., He, J.-Z., & Wen, X.-Q. 2009, ApJ, 693, L71
- Dressler (1980) Dressler, A. 1980, ApJ, 236, 351
- Durbala et al. (2009) Durbala, A., Buta, R., Sulentic, J. W., & Verdes-Montenegro, L. 2009, MNRAS, 397, 1756
- Durbala et al. (2008a) Durbala, A., del Olmo, A., Yun, M. S., et al. 2008a, AJ, 135, 130
- Durbala et al. (2008b) Durbala, A., Sulentic, J. W., Buta, R., & Verdes-Montenegro, L. 2008b, MNRAS, 390, 881
- Ellison et al. (2011) Ellison, S. L., Patton, D. R., Mendel, J. T., & Scudder, J. M. 2011, MNRAS, 418, 2043
- Ellison et al. (2008) Ellison, S. L., Patton, D. R., Simard, L., & McConnachie, A. W. 2008, AJ, 135, 1877
- Engelbracht et al. (1998) Engelbracht, C. W., Rieke, M. J., Rieke, G. H., Kelly, D. M., & Achtermann, J. M. 1998, ApJ, 505, 639
- Espada et al. (2011) Espada, D., Verdes-Montenegro, L., Huchtmeier, W. K., et al. 2011, A&A, 532, A117
- Fernández Lorenzo et al. (2012) Fernández Lorenzo, M., Sulentic, J., Verdes-Montenegro, L., et al. 2012, A&A, 540, A47
- Gavazzi et al. (2011) Gavazzi, G., Savorgnan, G., & Fumagalli, M. 2011, A&A, 534, A31
- González Delgado & Cid Fernandes (2010) González Delgado, R. M. & Cid Fernandes, R. 2010, MNRAS, 403, 797
- Greene & Ho (2007) Greene, J. E. & Ho, L. C. 2007, ApJ, 667, 131
- Haan et al. (2009) Haan, S., Schinnerer, E., Emsellem, E., et al. 2009, ApJ, 692, 1623
- Haehnelt et al. (1998) Haehnelt, M. G., Natarajan, P., & Rees, M. J. 1998, MNRAS, 300, 817
- Haggard et al. (2010) Haggard, D., Green, P. J., Anderson, S. F., et al. 2010, ApJ, 723, 1447
- Hao et al. (2005) Hao, L., Strauss, M. A., Tremonti, C. A., et al. 2005, AJ, 129, 1783
- Heckman (1980) Heckman, T. M. 1980, A&A, 87, 152
- Hickson (1982) Hickson, P. 1982, ApJ, 255, 382
- Hickson et al. (1992) Hickson, P., Mendes de Oliveira, C., Huchra, J. P., & Palumbo, G. G. 1992, ApJ, 399, 353
- Ho (2008) Ho, L. C. 2008, ARA&A, 46, 475
- Ho et al. (1997) Ho, L. C., Filippenko, A. V., & Sargent, W. L. W. 1997, ApJS, 112, 315
- Hopkins & Hernquist (2006) Hopkins, P. F. & Hernquist, L. 2006, ApJS, 166, 1
- Iglesias-Páramo & Vílchez (1999) Iglesias-Páramo, J. & Vílchez, J. M. 1999, ApJ, 518, 94
- Jarrett et al. (2000) Jarrett, T. H., Chester, T., Cutri, R., et al. 2000, AJ, 119, 2498
- Jiang et al. (2011) Jiang, Y.-F., Greene, J. E., & Ho, L. C. 2011, ApJ, 737, L45
- Karachentseva (1973) Karachentseva, V. E. 1973, Astrofizicheskie Issledovaniia Izvestiya Spetsial’noj Astrofizicheskoj Observatorii, 8, 3
- Kauffmann et al. (2003a) Kauffmann, G., Heckman, T. M., Tremonti, C., et al. 2003a, MNRAS, 346, 1055
- Kauffmann et al. (2003b) Kauffmann, G., Heckman, T. M., White, S. D. M., et al. 2003b, MNRAS, 341, 33
- Kauffmann et al. (2004) Kauffmann, G., White, S. D. M., Heckman, T. M., et al. 2004, MNRAS, 353, 713
- Kewley et al. (2001) Kewley, L. J., Dopita, M. A., Sutherland, R. S., Heisler, C. A., & Trevena, J. 2001, ApJ, 556, 121
- Kewley et al. (2006) Kewley, L. J., Groves, B., Kauffmann, G., & Heckman, T. 2006, MNRAS, 372, 961
- Kolmogorov (1933) Kolmogorov, A. 1933, Eng. Mat., 2
- Kormendy et al. (2011) Kormendy, J., Bender, R., & Cornell, M. E. 2011, Nature, 469, 374
- Laurikainen & Salo (1995) Laurikainen, E. & Salo, H. 1995, A&A, 293, 683
- Leon & Verdes-Montenegro (2003) Leon, S. & Verdes-Montenegro, L. 2003, A&A, 411, 391
- Leon et al. (2008) Leon, S., Verdes-Montenegro, L., Sabater, J., et al. 2008, A&A, 485, 475
- Li et al. (2008) Li, C., Kauffmann, G., Heckman, T. M., White, S. D. M., & Jing, Y. P. 2008, MNRAS, 385, 1915
- Li et al. (2006) Li, C., Kauffmann, G., Wang, L., et al. 2006, MNRAS, 373, 457
- Lisenfeld et al. (2011) Lisenfeld, U., Espada, D., Verdes-Montenegro, L., et al. 2011, A&A, 534, A102
- Lisenfeld et al. (2007) Lisenfeld, U., Verdes-Montenegro, L., Sulentic, J., et al. 2007, A&A, 462, 507
- Liu et al. (2012) Liu, X., Shen, Y., & Strauss, M. A. 2012, ApJ, 745, 94
- Liu et al. (2011) Liu, X., Shen, Y., Strauss, M. A., & Hao, L. 2011, ApJ, 737, 101
- MacKenty (1990) MacKenty, J. W. 1990, ApJS, 72, 231
- Martínez et al. (2008) Martínez, M. A., del Olmo, A., Coziol, R., & Focardi, P. 2008, ApJ, 678, L9
- Martínez et al. (2010) Martínez, M. A., Del Olmo, A., Coziol, R., & Perea, J. 2010, AJ, 139, 1199
- Mateus et al. (2006) Mateus, A., Sodré, L., Cid Fernandes, R., et al. 2006, MNRAS, 370, 721
- Miller et al. (2003) Miller, C. J., Nichol, R. C., Gómez, P. L., Hopkins, A. M., & Bernardi, M. 2003, ApJ, 597, 142
- Moles et al. (1995) Moles, M., Marquez, I., & Perez, E. 1995, ApJ, 438, 604
- Morton (1991) Morton, D. C. 1991, ApJS, 77, 119
- Moultaka et al. (2004) Moultaka, J., Ilovaisky, S. A., Prugniel, P., & Soubiran, C. 2004, PASP, 116, 693
- O’Donnell (1994) O’Donnell, J. E. 1994, ApJ, 422, 158
- Osterbrock & Ferland (2006) Osterbrock, D. E. & Ferland, G. J. 2006, Astrophysics of gaseous nebulae and active galactic nuclei (Astrophysics of gaseous nebulae and active galactic nuclei, 2nd. ed. by D.E. Osterbrock and G.J. Ferland. Sausalito, CA: University Science Books, 2006)
- Park & Choi (2009) Park, C. & Choi, Y.-Y. 2009, ApJ, 691, 1828
- Paturel et al. (2003) Paturel, G., Petit, C., Prugniel, P., et al. 2003, A&A, 412, 45
- Petrosian (1982) Petrosian, A. R. 1982, Astrofizika, 18, 548
- Rafanelli et al. (1997) Rafanelli, P., Temporin, S., & Baruffolo, A. 1997, Astronomische Nachrichten, 318, 249
- Rafanelli et al. (1995) Rafanelli, P., Violato, M., & Baruffolo, A. 1995, AJ, 109, 1546
- Sabater (2009) Sabater, J. 2009, PhD thesis, Universidad de Granada, Instituto de Astrofísica de Andalucía (CSIC)
- Sabater et al. (2008) Sabater, J., Leon, S., Verdes-Montenegro, L., et al. 2008, A&A, 486, 73
- Sabater et al. (2010) Sabater, J., Leon, S., Verdes-Montenegro, L., et al. 2010, in Astronomical Society of the Pacific Conference Series, Vol. 421, Galaxies in Isolation: Exploring Nature Versus Nurture, ed. L. Verdes-Montenegro, A. Del Olmo, & J. Sulentic, 57–+
- Schawinski et al. (2010) Schawinski, K., Dowlin, N., Thomas, D., Urry, C. M., & Edmondson, E. 2010, ApJ, 714, L108
- Schawinski et al. (2009) Schawinski, K., Virani, S., Simmons, B., et al. 2009, ApJ, 692, L19
- Schlegel et al. (1998) Schlegel, D. J., Finkbeiner, D. P., & Davis, M. 1998, ApJ, 500, 525
- Schmitt (2001) Schmitt, H. R. 2001, AJ, 122, 2243
- Shlosman et al. (1990) Shlosman, I., Begelman, M. C., & Frank, J. 1990, Nature, 345, 679
- Silverman et al. (2009) Silverman, J. D., Kovač, K., Knobel, C., et al. 2009, ApJ, 695, 171
- Smirnov (1936) Smirnov, N. V. 1936, C. R. Acad. Sci. Paris, 202, 449
- Stasińska et al. (2008) Stasińska, G., Asari, N. V., Fernandes, R. C., et al. 2008, MNRAS, 391, L29
- Sulentic (1987) Sulentic, J. W. 1987, ApJ, 322, 605
- Sulentic et al. (2001) Sulentic, J. W., Rosado, M., Dultzin-Hacyan, D., et al. 2001, AJ, 122, 2993
- Sulentic et al. (2006) Sulentic, J. W., Verdes-Montenegro, L., Bergond, G., et al. 2006, A&A, 449, 937
- Tasse et al. (2011) Tasse, C., Röttgering, H., & Best, P. N. 2011, A&A, 525, A127+
- Temi et al. (2009) Temi, P., Brighenti, F., & Mathews, W. G. 2009, ApJ, 707, 890
- Veilleux & Osterbrock (1987) Veilleux, S. & Osterbrock, D. E. 1987, ApJS, 63, 295
- Verdes-Montenegro et al. (2005) Verdes-Montenegro, L., Sulentic, J., Lisenfeld, U., et al. 2005, A&A, 436, 443
- Verdes-Montenegro et al. (1998) Verdes-Montenegro, L., Yun, M. S., Perea, J., del Olmo, A., & Ho, P. T. P. 1998, ApJ, 497, 89
- Verley et al. (2007a) Verley, S., Leon, S., Verdes-Montenegro, L., et al. 2007a, A&A, 472, 121
- Verley et al. (2007b) Verley, S., Odewahn, S. C., Verdes-Montenegro, L., et al. 2007b, A&A, 470, 505
- von der Linden et al. (2010) von der Linden, A., Wild, V., Kauffmann, G., White, S. D. M., & Weinmann, S. 2010, MNRAS, 404, 1231
- Wei et al. (2010) Wei, L. H., Kannappan, S. J., Vogel, S. N., & Baker, A. J. 2010, ApJ, 708, 841
- Wilkins (1995) Wilkins, G. A. 1995, Vistas in Astronomy, 39, 277
- York et al. (2000) York, D. G., Adelman, J., Anderson, Jr., J. E., et al. 2000, AJ, 120, 1579
Appendix A Additional data
There are some additional data associated with this study: a) SDSS photometric data that were processed but not used for this study and b) Hyperleda data that were compiled for the comparison presented in Sect. 4. These data are presented here and in http://amiga.iaa.es/ for future reference and to allow the data replication and reproducibility.
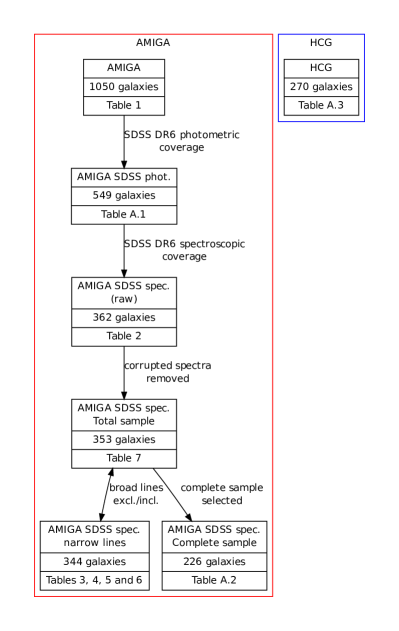
A diagram of the samples and data presented in the paper is shown in Fig. 11.
A.1 SDSS photometric data
We cross-correlated the positions of our galaxies (Leon & Verdes-Montenegro 2003) with the SDSS DR6 photometric catalogue using the interface available on the SDSS web-page (search radius of 0.5′). We obtained a list of photometric sources near the estimated centre of each galaxy as well as the corresponding SDSS spectral data when available. The right objects were identified using a semi-automatic selection algorithm selecting the object with the highest z band flux followed by a visual inspection as a cross-check. Only of the photometric objects were clearly misclassified with the usual source of confusion involving a nearby star. A total of 549 AMIGA galaxies were included in DR6.
In six cases the photometry for the galaxy was assigned to an object whose estimated position was shifted from the centre of the galaxy. In these cases, we manually chose the correct photometric object. We inspected in more detail some special cases that were finally discarded from our catalogue (CIG 402 is strongly affected by the light of a nearby star and CIG 802 and 388 are resolved Milky Way satellites). As a final check we compared the apparent magnitudes in g-band from the SDSS data and in B-band from the AMIGA database (Verdes-Montenegro et al. 2005). Although the filter shapes are different and the shape of the spectral energy distribution of the galaxy directly affects their ratio, a high difference between these two magnitudes may indicate an error in the selection of the photometric data. The mean of the ratio is 1.044 and the standard deviation is 0.070. In seven cases the difference was found to be above , suggesting that the SDSS photometric data might refer to a restricted region rather than the entire galaxy. The photometric data for these cases were flagged. The values for the SDSS photometry are presented in Table 10.
| CIG | ObjId | u | g | r | i | z | comment |
|---|---|---|---|---|---|---|---|
| 11 | 588015508197212201 | 15.76 | 14.45 | 13.83 | 13.52 | 13.33 | |
| 12 | 588290879491408031 | 17.04 | 15.57 | 14.88 | 14.55 | 14.30 | |
| 16 | 587731187816857647 | 17.04 | 15.26 | 14.51 | 14.12 | 13.83 | |
| 19 | 587730773354479638 | 16.83 | 14.95 | 14.10 | 13.68 | 13.32 | |
| 33 | 587731186208669747 | 14.90 | 13.57 | 12.95 | 12.65 | 12.40 | |
| … | … | … | … | … | … | … | … |
-
1
AMIGA galaxies with SDSS DR6 photometry (). Columns: (1) CIG catalogue number; (2) SDSS ObjId of the selected SDSS photometric object. In some cases it does not match the ObjId associated to the spectroscopic object. (3) to (7) SDSS photometric magnitudes; (8) comments for galaxies with poor photometry (see text).
A.2 Hyperleda data
Hyperleda data were compiled for the AMIGA and HCG samples (see Sect. 4). In Table 11, the compiled morphological classification and absolute magnitude for AMIGA galaxies are shown. In Table 12, the compiled morphological classification and absolute magnitude plus the nuclear activity classification obtained from Martínez et al. (2010) are shown.
| CIG | Morpho. | |
| 11 | 5.1 | |
| 56 | 3.4 | |
| 60 | 2.8 | |
| 187 | 3.9 | |
| 189 | ||
| … | … | … |
-
1
SDSS complete sample (). Columns: (1) CIG catalogue number; (2) morphological classification (RC3); (3) absolute magnitude in B-band.
| HCG | Morpho. | class. | |
|---|---|---|---|
| H01a | 4.6 | SFN | |
| H01b | - | ||
| H01c | AGN | ||
| H01d | AGN | ||
| H03a | 4.3 | AGN | |
| … | … | … | … |
-
1
HCG galaxies (). Columns: (1) HCG catalogue name; (2) morphological classification (RC3); (3) absolute magnitude in B-band; (4) nuclear activity classification. Possible values: AGN, SFN, TO, AGN/TO or unclassified (-).