Type I Superconductivity in ScGa3 and LuGa3 Single Crystals
Abstract
We present evidence of type I superconductivity in single crystals of ScGa3 and LuGa3, from magnetization, specific heat and resistivity measurements: low critical temperatures Tc = 2.1 - 2.2 K, field-induced second-to-first order phase transition in the specific heat, critical fields less than 240 Oe and low Ginzburg-Landau coefficients 0.23 and 0.30 for ScGa3 and LuGa3, respectively, are all traits of a type I superconducting ground state. These observations render ScGa3 and LuGa3 two of only several type I superconducting compounds, with most other superconductors being type II (compounds and alloys) or type I (elemental metals and metaloids).
pacs:
74.25.Bt, 74.25.F-, 74.70.AdI I Introduction
Despite the large number of known conventional and unconventional superconductors (SCs), new findings still emerge even from simple, binary intermetallic systems. The majority of the metallic elements are superconducting with small values of the critical temperatures Tc.1 It has been noted 2 that intermetallic compounds often have Tc values higher than those of the constituent elements, as is the case in Nb3Sn,3 V3Si,4 ZrB2 and NbB2.5 In this work, we present thermodynamic and transport measurements on single crystals of RGa3 (R = Sc or Lu), formed with superconducting Ga with Tc = 1.09 K,1 and either non-superconducting Sc or superconducting Lu whose critical temperature is Tc = 0.1 K.1
Past studies focused on the synthesis of polycrystalline samples of RGa3, with reports on single crystals limited to de Haas van Alphen measurements.6 Pluzhnikov et. al. characterized the geometry of the Fermi surface of three related intermetallic compounds, RGa3 (R = Sc, Lu) and LuIn3. Together with findings from band structure calculations 7 on the same systems, these reports suggested great similarities between the electronic properties of ScGa3 and LuGa3. Superconductivity below 2.3 K in LuGa3 had already been mentioned,8 but thermodynamic and transport properties measurements of both ScGa3 and LuGa3 have so far been limited to T 4.2 K.9, 10 The similarities in the electronic structures of ScGa3 and LuGa3 suggest that, if the superconductivity in the latter compound is confirmed, the former is likely to also display a superconducting ground state. In the current paper we show evidence that indeed both RGa3 (R = Sc and Lu) are superconducting. The low critical temperatures Tc around 2.2 K and small critical fields Hc 240 Oe point to type I superconductivity in both these compounds. Additional supporting evidence for the type I superconductivity is provided by the field-dependent specific heat and low values of the Ginzburg-Landau (GL) coefficient 0.23 and 0.3 for ScGa3 and LuGa3, respectively.
II II Experimental Methods
The RGa3 compounds (R = Sc, Dy-Tm, Lu) crystallize in the cubic Pmm space group, a structure suggested by Matthias 11 to be favorable for superconductivity. Single crystals of ScGa3 and LuGa3 were prepared using a self flux method by combining Sc or Lu (Hefa Rare Earth 99.999%) with Ga (Alfa Aesar 99.9999%). A R:Ga ratio of 1:9 was mixed in an alumina crucible, heated up to 930∘C, then slowly cooled down to 760∘C, followed by decanting of the residual flux in a centrifuge. Metallic cubic crystals with well-formed facets up to 222 mm3 in size were obtained. The crystals were then wrapped in Ta foil and annealed at 800∘C for a week. Temperature- and field-dependent magnetization measurements with the magnetic field H parallel to the crystallographic axis Ha were performed in a Quantum Design (QD) Magnetic Property Measurement System, while specific heat data were collected in a QD Physical Property Measurement System (PPMS) using an adiabatic relaxation method. AC resistivity measurements from 0.4 K to 300 K were carried out using the standard four-probe method in the QD PPMS, with the current along the a axis i = 0.5 mA and f = 17.77 Hz.
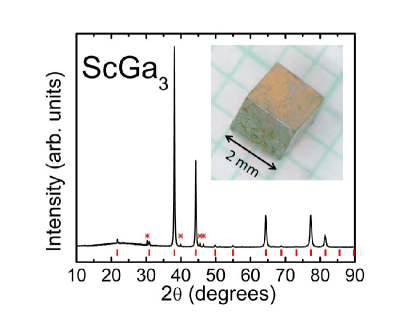
Powder X-ray diffraction data, shown in Fig. 1 for ScGa3, were collected for both compounds in a Rigaku D/Max diffractometer using Cu K radiation. The patterns for ScGa3 and LuGa3 were refined with the cubic space group Pmm, with lattice parameters a = 4.09 and a = 4.19 , respectively. A picture of a ScGa3 crystal is also shown in the inset in Fig. 1. Traces of residual Ga flux are apparent in the powder pattern, and are marked with asterisks in Fig. 1. Additional single crystal X-ray diffraction measurements confirmed the crystals structure, stoichiometry and purity of the ScGa3 crystals.
III III Results and Discussion
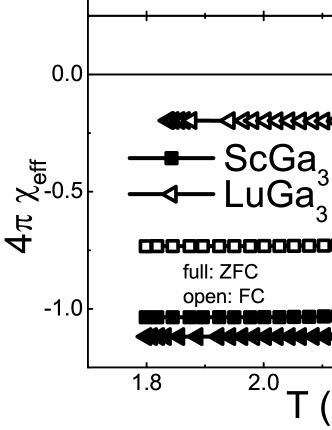
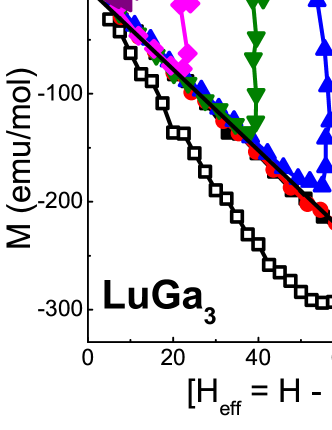
As-measured susceptibility data = M/H for RGa3 in various applied magnetic fields H was scaled by 4 and corrected for demagnetizing effects 4eff = 4/(1 - Nd) as shown in Fig. 2. The demagnetizing factor, Nd 1/3,12, 13 is associated with the cubic geometry of the crystals. As anticipated from their electronic properties,6 both R = Sc (Fig. 2a) and Lu (Fig. 2b) compounds display similar superconducting ground states below 2.2 - 2.3 K. Increasing magnetic field suppresses the transition for ScGa3 (Fig. 2a), such that Tc becomes smaller than 1.8 K for H 80 Oe. Fig. 2b illustrates the similarity between the H = 5 Oe M(T) data for ScGa3 (squares) and LuGa3 (triangles), for both zero-field cooled (full) and field-cooled (open) data. The critical field Hc for each compound can also be estimated from the M(H) data, shown in Fig. 3. Taking the demagnetization effect into consideration, a more accurate estimate of the field H is Heff = H - NdM, where, as before, for a cube and Ha, Nd 1/3. The resulting M(Heff) isotherms are displayed in Fig. 3 (full symbols, bottom axes) along with as-measured M(H) for T = 1.8 K (open symbols, top axes). The critical field values Hc, corresponding to the entrance to the normal state (M = 0), are not changed when demagnetizing effects are taken into account for Ha. The critical fields are remarkably low, Hc reaching only about 90 Oe at 1.8 K, the lowest temperature available for the magnetization measurements. Moreover, as will be shown below, the critical fields for both compounds remain small down to 0.4 K. This observation, along with the small critical temperatures and the shape of the M(H) isotherms, indicate type I superconductivity in both ScGa3 and LuGa3. While most elemental SCs are type I, this is a rare occurrence in superconducting compounds, making ScGa3 and LuGa3 two of only a few such known systems.14, 15, 16, 17, 18 It is therefore imperious to fully characterize the superconducting state in the RGa3 SCs. Specific heat and resistivity measurements allow us to extend the findings from magnetization data down to lower temperatures.
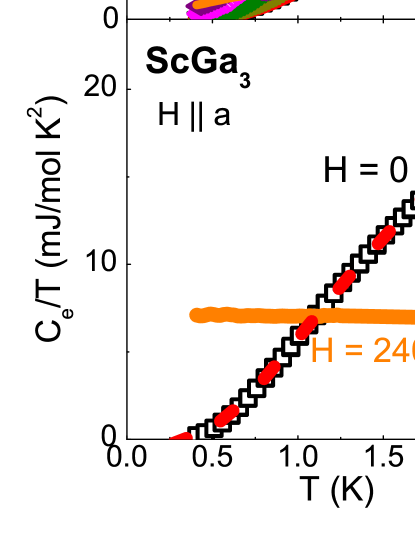
Field-dependent specific heat measurements for ScGa3 and LuGa3 were carried out in fields up to 240 Oe, as shown in Fig. 4. As expected, a sharp peak is observed for field values H 240 Oe, from which the critical temperature Tc can be determined as the point halfway between the peak and the normal state specific heat signal. Type I superconductivity in both compounds is confirmed by the increase of the jump in specific heat between zero and non-zero applied magnetic field H, indicating second-to-first order phase transition. Tc for ScGa3 and LuGa3 is suppressed from 2.1 K (open squares, Fig. 4a) and 2.0 K (open squares, Fig. 4b), respectively, at H = 0 to below 0.4 K at H = 240 Oe (solid line, Fig. 4c and d). The normal state electronic specific heat coefficient n and phonon specific heat coefficient were estimated from the linear fit of the normal state (H = 240 Oe) specific heat below 8 K, plotted as Cp/T vs. T2 (not shown). Very similar n values, 7.11 mJ mol-1 K-2 and 8.46 mJ mol-1 K-2, were obtained for ScGa3 and LuGa3, respectively. The experimental n values are larger than those estimated (n,PPPW = 2.4 mJ/mol K2 for ScGa3, and 1.2 mJ/mol K2 for LuGa3) from existing band structure calculations based on the Pseudo-Potential Plane Wave approximation (PPPW). 7 However, a more accurate estimate of n results from the Full Potential Linear Augmented Plane Wave method (FPLAPW),19 which gives n,FPLAPW = 7.1 mJ/mol K2 for ScGa3, identical with the experimental value of 7.11 mJ/mol K2. The superconducting electronic specific heat coefficient s can also be determined from n and the residual electronic specific heat coefficient res. The latter coefficient, res, estimated from Ce/T at T = 0.4 K and H = 0 (Fig. 4c and d), is much smaller than n for both compounds. This results in s = n - res n for both ScGa3 and LuGa3. The entropy-conservation construct shown in Fig. 4c and d for ScGa3 and LuGa3, respectively, yields the same value for the jump in the electronic specific heat Ce at Tc, Ce/nTc 1.44, consistent with BCS-type superconductivity.20 One more similarity between the two compounds is the minimum excitation energy (0): from the low-temperature fit of the electronic specific heat Ce e (dashed lines in Fig. 4c and d), (0) is estimated to be 0.18 meV for ScGa3 and 0.17 meV for LuGa3. The Debye temperature D = (124NArkB/5)1/3, where r = 4 is the number of atoms per formula unit, can be determined using the phonon specific heat coefficient (Table 1), also estimated from the linear fit of Cp/T vs. T2 (not shown). This yields D = 660 K for ScGa3 and 232 K for LuGa3. Moreover, the electron-phonon coupling constant el-ph, can be determined using McMillan’s theory:21
where ∗ represents the repulsive screened Coulomb potential and is usually between 0.1 and 0.15. Setting ∗ = 0.13, = 0.45 and 0.55 for ScGa3 and LuGa3, respectively, imply that both compounds are weakly coupled SCs.
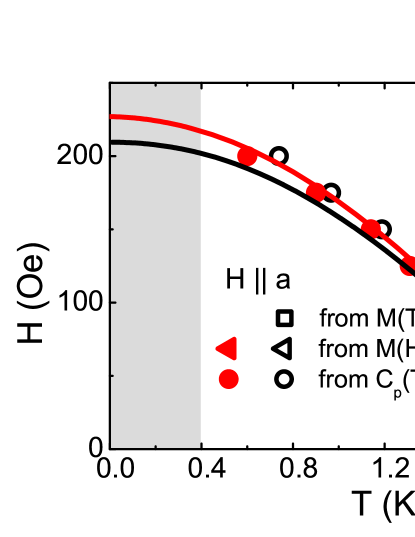
From the specific heat data for both the superconducting (H = 0) and the normal (H = 240 Oe) states, an estimate of the thermodynamic critical field Hc can be obtained using the free energy relation.22 The thermodynamic critical field values Hc = 209 10 Oe for ScGa3 and 226 10 Oe for LuGa3 are consistent with what has been observed in magnetization and specific heat data. The field- and temperature-dependent data can be summarized in the H - T phase diagram shown in Fig. 6 and discussed below.
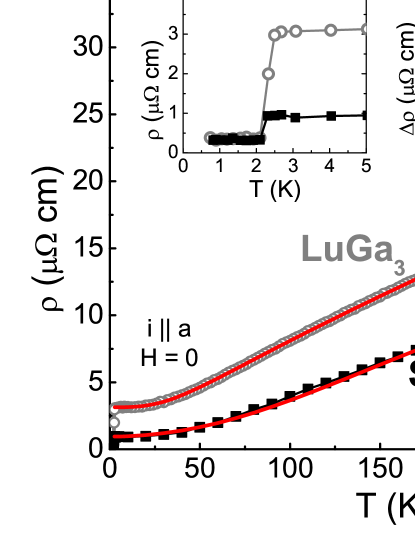
Previously reported resistivity measurements 9, 10 on LuGa3 were limited to temperatures above 4.2 K, while similar data had not been presented for ScGa3. Fig. 5 displays the H = 0 resistivity data for ScGa3 and LuGa3 (full and open symbols, respectively). The superconducting transition (left inset) is around 2.2 - 2.3 K for both compounds. The apparently finite resistivity in the superconducting state is likely an artifact of the measurement: the overall resistivity values are very small for both compounds; below Tc, the contact resistance, albeit small, might alter the measured voltage, which is very close to the instrument resolution. Above the transition and below 80 K for ScGa3 or 70 K for LuGa3, (T) exhibits Fermi liquid behavior, as illustrated by the AT2 plot, with A = 3.410-4 and 6.110-4 cmK-2, respectively (right inset, Fig. 5). At higher temperatures a slight curvature of the resitivity is apparent. Fits to the Bloch-Grüneisen-Mott (BGM) relation 23 (solid lines, Fig. 5)
with n = 2 for ScGa3 and n = 3 for LuGa3 describe the data well up to room temperature, even higher than D/4. This points to significant s-d band scattering, while the different exponents n suggest underlying differences in the electron-phonon scattering in the two compounds. The fits shown in Fig. 5 were performed using the D values determined from specific heat; the other BGM parameters were determined to be A = 38.5 and 28.6 cm and k = 1.310-7 and 0.310-7 cm/K3, for ScGa3 and LuGa3, respectively. If the parameter is also released for the BGM fits, equally good fits for n = 2 and n = 3 are achieved for ScGa3, for R values between 320 and 460 K, significantly smaller than the Debye temperature D = 660 K. For LuGa3, the parameters remain nearly unchanged, with the best fit for n = 3 and R = 230 K, virtually identical to D = 232 K.
Based on the Sommerfield coefficient extracted from the specific heat data, it is possible to estimate the London penetration depth L(0), the coherence length (0) and the GL parameter (0) = L(0)/(0). Since both ScGa3 and LuGa3 have one formula unit per unit cell, the conduction electron density n, due to three electrons contributed by Sc and Lu, can be estimated as n = 3/V where V is the volume of the unit cell. It results that n = 4.3910-2 Å-3 and n = 4.0810-2 Å-3 for ScGa3 and LuGa3, respectively. If a spherical Fermi surface is assumed for both compounds, the Fermi wave vector kF can be roughly calculated as kF = (3n2)1/3 = 1.09 Å-1 for ScGa3 and 1.07 Å-1 for LuGa3. The effective electron mass can then be determined as m* = 2kn/2nk = 3.03m0 and 3.49m0 for ScGa3 and LuGa3, respectively, where m0 is the free electron mass. The London penetration depth is given as L(0) = (m*/0ne2)1/2 = 59 nm for ScGa3 and 63 nm for LuGa3. The coherence length is then determined as = 0.18kF/kBTcm* = 0.26 m and 0.21 m for ScGa3 and LuGa3, respectively. The GL parameter (0) = L(0)/(0) is thus 0.23 for ScGa3 and 0.30 for LuGa3. This indicates that both compounds are type I SCs, since 1/. By comparison, MgB2 is an example of a type II SC and its (0) is close to 26,24 while (0) for LaRhSi3, a reported type I superconducting compound, is close to 0.25.14
| Tc | Hc | n | A | RRR | el-ph | m* | ||||||
| (K) | (Oe) | (mJmol-1K-2) | (mJmol-1K-4) | (cmK-2) | (m0) | (nm) | (m) | |||||
| ScGa3 | 2.1 0.2 | 209 10 | 7.03 0.08 | 0.027 | 3.410-4 | 14.0 | 1.44 | 0.45 | 3.03 | 59 | 0.26 | 0.23 |
| LuGa3 | 2.2 0.25 | 226 10 | 8.52 0.06 | 0.621 | 6.110-4 | 6.5 | 1.44 | 0.55 | 3.49 | 63 | 0.21 | 0.30 |
IV IV Conclusions
In summary, type I superconductivity in ScGa3 and LuGa3 is reported, with the parameters characteristic of the superconducting state shown in Table 1. The shape of the M(H) isotherms (Fig. 3), field-induced second-to-first order phase transition in specific heat (Fig. 4), low Tc, Hc and values (Table 1) suggest that ScGa3 and LuGa3 are both type I superconducting compounds. This is reflected also in the H - T phase diagram (Fig. 6), where the symbols represent experimental points from M(T) (squares), M(H) (triangles) and CP (circles). These data are in good agreement with the thermodynamic critical field Hc temperature dependence (solid lines). As suggested by the electronic properties,6 the superconducting parameters for the two compounds are very similar, as are their H - T phase diagrams. A careful analysis of the crystal structure on one hand, and the thermodynamic and transport properties of the type I superconducting compounds on the other hand, may offer valuable insights into the rare occurrence of type I superconductivity in binary or ternary systems. The relatively small electron-phonon coupling parameter el-ph indicates that both compounds are weakly-coupled BCS SCs.
V V Aknowledgements
This work was supported by NSF DMR 0847681. We thank A. Marcinkova, M. Beasley, A. Nevidomskyy, R. Prozorov and L. Zhao for useful discussions, J. Chan and G. McCandless for single crystal x-ray diffraction experiments and J. Wang for assistance with band structure calculations.
References
- Roberts 1976 B. W. Roberts, Journal of Physical and Chemical Reference Data 5, 581 (1976).
- Kakani 2006 S. L. Kakani, Material Science (2006).
- Matthias et al. 1954 B. T. Matthias, T. H. Geballe, S. Geller, and E. Corenzwit, Physical Review 95, 1435 (1954).
- Matthias 1953 B. T. Matthias, Physical Review 89, 884 (1953).
- Gasparov et al. 2001 V. A. Gasparov, N. S. Sidorov, I. I. Zver’kova, S. S. Khassanov, and M. P. Kulakov, Journal of Experimental and Theoretical Physics Letters 73, 532 (2001).
- Pluzhnikov et al. 1995 V. B. Pluzhnikov, A. Czopnik, and I. V. Svechkarev, Physica B 212, 375 (1995).
- http://www.aflowlib.org/index.html; S. Curtarolo et al. 2003 http://www.aflowlib.org/index.html; S. Curtarolo, D. Morgan, K. Persson, J. Rodgers, and G. Ceder, Physical Review Letters 91, 135503 (2003).
- Havinga et al. 1970 E. E. Havinga, H. Damsma, and M. H. van Maaren, Journal of Physics and Chemistry of Solids 31, 2653 (1970).
- Kletowski 1988 Z. Kletowski, Physica Status Solidi 108, 363 (1988).
- Kletowski et al. 1997 Z. Kletowski, R. Fabrowski, P. Slawinski, and Z. Henkie, Journal of Magnetism and Magnetic Materials 166, 361 (1997).
- Matthias 1954 B. T. Matthias, Physical Review 97, 74 (1954).
- Aharoni 1998 A. Aharoni, Journal of Applied Physics 83, 3432 (1998).
- Osborn 1945 J. A. Osborn, Physical Review 67, 351 (1945).
- Anand et al. 2011 V. K. Anand, A. D. Hillier, D. T. Adroja, A. M. Strydom, H. Michor, K. A. McEwen, and B. D. Rainford, Physical Review B 83, 064522 (2011).
- Yonezawa and Maeno 2005 S. Yonezawa and Y. Maeno, Physical Review B 72, 180504 (2005).
- Tsindlekht et al. 2006 M. I. Tsindlekht, G. I. Leviev, V. M. Genkin, I. Felner, Y. B. Paderno, and V. B. Filippov, Physical Review B 73, 104507 (2006).
- Wakui et al. 2009 K. Wakui, S. Akutagawa, N. Kase, K. Kawashima, T. Muranaka, Y. Iwahori, J. Abe, and J. Akimitsu, Journal of Physical Society of Japan 78, 034710 (2009).
- Zhao et al. submitted, Physical Review B L. L. Zhao, S. Lausberg, H. Kim, M. A. Tanatar, M. Brando, R. Prozorov, and E. Morosan (submitted, Physical Review B).
- Jia 2012 We performed band structure calculations for ScGa3 using the full-potential linearized augmented plane-wave method (FPLAPW), as implemented in the WIEN2K code. This gives the DOS(EF) 2 states/eV, from which it results that the electronic specific heat coefficient FPLAPW = 7.1 mJ/mol K2 (2012).
- Bardeen et al. 1957 J. Bardeen, L. N. Cooper, and J. R. Schrieffer, Physical Review 108, 1175 (1957).
- McMillan 1968 W. L. McMillan, Physical Review 167, 331 (1968).
- Tinkham 1996 M. Tinkham, Introduction to Superconductivity (1996).
- Bid et al. 2006 A. Bid, A. Bora, and A. K. Raychaudhuri, Physical Review B 74, 035426 (2006).
- Finnemore et al. 2001 D. K. Finnemore, J. E. Ostenson, S. L. Bud’ko, G. Lapertot, and P. C. Canfield, Physical Review Letters 86, 2420 (2001).