Burst statistics in Alcator C-Mod SOL turbulence
Abstract
Bursty fluctuations in the scrape-off layer (SOL) of Alcator C-Mod have been analyzed using gas puff imaging data. This reveals many of the same fluctuation properties as Langmuir probe measurements, including normal distributed fluctuations in the near SOL region while the far SOL plasma is dominated by large amplitude bursts due to radial motion of blob-like structures. Conditional averaging reveals burst wave forms with a fast rise and slow decay and exponentially distributed waiting times. Based on this, a stochastic model of burst dynamics is constructed. The model predicts that fluctuation amplitudes should follow a Gamma distribution. This is shown to be a good description of the gas puff imaging data, validating this aspect of the model.
I Introduction
Cross-field transport of particles and heat in the scrape-off layer (SOL) of magnetically confined plasmas is dominated by radial motion of blob-like structures review ; garcia-tcv ; labombard . The average cross-field particle and heat fluxes caused by such filaments depend on their amplitude distribution and frequency of occurrence. The statistical properties of plasma fluctuations in the SOL are thus crucial for development of a first-principles physics based description of transport and main-chamber interactions, and may also prove important for understanding the empirical discharge density limit review ; garcia-tcv ; labombard .
Plasma fluctuations in the Alcator C-Mod SOL have been investigated by analysis of data from gas puff imaging (GPI) measurements at the outboard mid-plane region in a set of ohmically heated, lower single null discharges with a scan in line-averaged density. It is shown that the GPI diagnostic reveals many of the same fluctuation properties as Langmuir probe measurements, including normal distributed fluctuations in the near SOL region while the far SOL plasma with a broad particle density profile is dominated by large amplitude bursts due to radially outward motion of blobs review ; garcia-tcv ; labombard . The fluctuation probability distributions in the far SOL are strongly skewed and flattened with an exponential tail towards large values for all line-averaged particle densities review ; garcia-tcv ; labombard .
The burst statistics are revealed by means of a standard conditional averaging technique. GPI measurements reproduce the familiar asymmetric burst wave forms with a fast rise and a slow decay and an average duration that is independent of the line-averaged density garcia-tcv . The waiting times between large amplitude events are found to be exponentially distributed for all line-averaged densities. Based on these results, a stochastic model for the intermittent fluctuations has been constructed. This model reveals the importance of burst duration, waiting times and amplitudes for large far SOL plasma densities and fluctuation levels. From the model it is shown that the fluctuation amplitudes follow a Gamma distribution and that there is a parabolic relationship between the skewness and kurtosis moments. This compares favourably with the GPI measurements.
II Experimental setup
For this investigation we analyze GPI data from a set of similar, deuterium fuelled, ohmically heated, lower single null plasmas with plasma current and toroidal magnetic field . The GPI diagnostic consists of a array of in-vessel optical fibres with toroidally viewing, horizontal lines of sight which are locally enhanced in the object plane by an extended He gas puff from a nearby nozzle. Excitation of the He neutral gas, and thus the intensity of the GPI signals, is determined by a combination of the local electron particle density and temperature cziegler . The fibres are coupled to high sensitivity avalanche photo diodes and the signals are digitized at a rate of frames per second. The viewing area covers the major radius from to and vertical coordinate from to with an in-focus spot size of for each of the 90 individual channels. The radial position of the last closed flux surface at the vertical centre of the image, , is in the range from to for all the discharges presented here. The limiter radius mapped to this vertical position is at . Further information about the GPI diagnostic can be found in LABEL:cziegler.
This paper reports on experiments performed during the FY2010 run campaign using GPI data from run 1100803. This comprises a four-point scan in line-averaged density with the Greenwald fraction from to . Here the Greenwald density is given by where is the plasma current in units of MA and is the plasma minor radius in units of meters. For the present density scan . The condition at the outer divertor goes from sheath limited at the lowest density to high recycling at the highest density in this scan. For each discharge the GPI diagnostic yields usable data time series during the flat-top of the plasma current. By combining data from two discharges at the same and two nearby diode channels with identical statistical properties, we obtain single-point time series of one second duration which allows calculation of statistical averages with high accuracy.
III GPI measurements
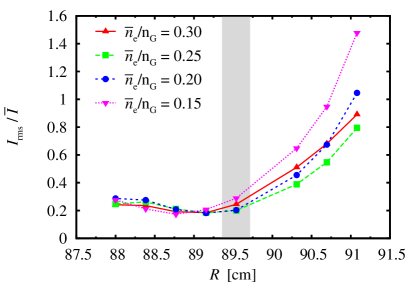
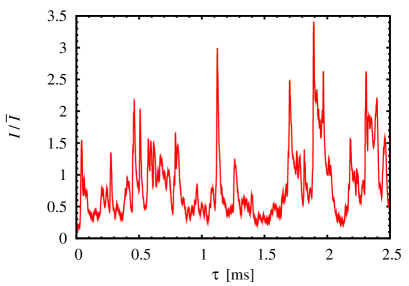
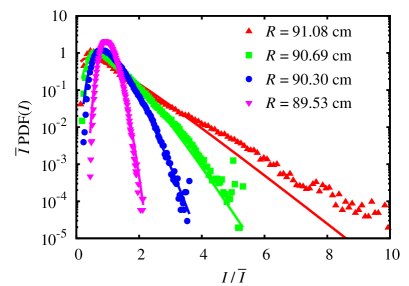
In Fig. 1 we show the radial variation of the relative fluctuation level of the GPI intensity signals at . The fluctuations increase drastically in magnitude with radial distance into the SOL. As shown in Fig. 2, the raw time series are here dominated by large-amplitude bursts due to the radial motion of blob-like structures kube . This results in positively skewed and flattened probability density functions (PDFs) of the intensity signals. As an example of this, we present in Fig. 3 the distribution function for the GPI signals for at for the four GPI fibre view positions radially outside the separatrix. It is clearly seen that the PDF changes from a normal distribution in the near SOL region to strongly skewed and flattened in the far SOL. At the limiter radius , the PDF has an exponential tail towards large signal amplitudes. This is similar to what has previously been found from Langmuir probe measurements labombard ; garcia-tcv .
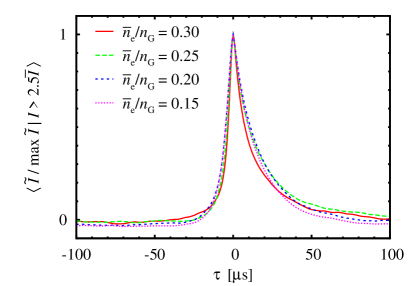
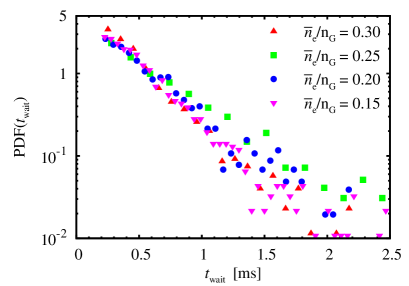
The radial motion of blob-like structures through the SOL results in single-point recordings dominated by bursts with a fast rise and a slow decay. This is demonstrated by the asymmetric wave form obtained from conditional averaging presented in Fig. 4. Here it is seen that the average burst duration is the same for all line-averaged densities. This is again similar to what has previously been found from probe measurements as well as numerical turbulence simulations garcia-tcv ; garcia-esel . The waiting time between large amplitude bursts is also obtained from the conditional averaging. As shown in Fig. 5, the burst waiting times are found to be exponentially distributed for all line-averaged densities. An exponential distribution describes the time between events for a Poisson process, in which events occur randomly and at a constant average rate. The large-amplitude blobs appearing in the far SOL are thus uncorrelated.
IV Stochastic modelling
The experimental measurements presented here suggest that fluctuations in the SOL can be represented as a random sequence of bursts similar to the classical ”shot noise” process campbell ,
| (1) |
where is the burst arrival time for event and is a fixed burst wave form. The burst waiting times, given by , are assumed to be exponentially distributed, consistent with the results presented in Fig. 5. The individual burst wave forms will for simplicity be approximated by a sharp rise followed by a slow exponential decay, , where is the step function and the burst duration time is taken to be constant. The burst amplitudes are also taken to be exponentially distributed,
| (2) |
where is the average burst amplitude. For the exponential burst wave form, the mean value of the signal in Eq. (1) is readily calculated campbell ; garcia-shotnoise ,
| (3) |
where is the average burst waiting time. The above equation elucidates the role of burst duration, waiting time and amplitude for large SOL plasma densities.
In the case of exponentially distributed burst amplitudes, the relative fluctuation level can be written as , while the skewness and kurtosis moments for are given by garcia-shotnoise
| (4) |
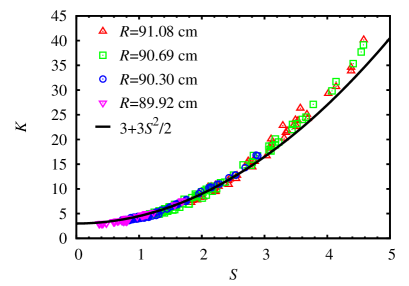
This shows that there is a parabolic relation between these moments given by . Like the relative fluctuation level, also the skewness and kurtosis increases with the ratio . The parameter is thus a measure of intermittency in the signal given by Eq. (1).
In Fig. 6 we present the kurtosis as function of skewness calculated for all GPI fibre view positions located in the SOL for the discharges in the present density scan. It is clearly seen that the skewness and kurtosis moments increase radially outwards in the SOL, similar to the relative fluctuation level presented in Fig. 1. Also shown in Fig. 6 is the predicted parabolic relation given by Eq. (4). This is an excellent description of the experimental data for all but the outermost diode channel positions. Reduced emission from the neutral He gas is expected for the cold and dilute plasma in the limiter shadow. Here significant emission levels only arise in the presence of large amplitude blob structures, which leads to excessively large higher order moments of the fluctuations. This is likely the cause of the apparent discrepancy from a parabolic relation for the signals from the outermost GPI views in Fig. 6. Such a parabolic relation between the skewness and kurtosis moments has been found for many other plasma experiments sattin ; graves .
For exponentially distributed burst waiting times and amplitudes, the PDF for given by the model (1) can be shown to be a Gamma distribution garcia-shotnoise ,
| (5) |
where the scale parameter is given by and the shape parameter is . In Fig. 3 we have presented the corresponding Gamma distribution, which is seen to be an excellent fit to the data for the innermost SOL positions. Note that the PDFs for the experimental data comprise more than four decades on the ordinate axis—a consequence of the long data time series used in this analysis. In the limiter shadow the PDF of the measured signals have a strongly elevated tail which is likely due to suppressed emission in the cold far SOL plasma as discussed above. The Gamma distribution has previously been found to accurately describe the ion saturation current signal in the SOL of TCV across a broad range of plasma parameters graves .
V Conclusions
GPI measurements in the SOL of Alcator C-Mod have shown that plasma fluctuations are dominated by large amplitude bursts due to radial motion of blob-like structures. The burst wave form is asymmetric with a fast rise and slow decay. Conditional averaging reveals that the burst waiting times and amplitudes are exponentially distributed, thus blobs appearing in the far SOL are uncorrelated. The PDF of the GPI intensity signal changes from a normal distribution in the near SOL to strongly skewed and flattened with an exponential tail in the far SOL. A stochastic model of burst dynamics is constructed based on three parameters: burst duration, waiting time and amplitude. Consistent with the predictions of the model, the PDFs of the GPI intensity fluctuations are well described by a Gamma distribution and there is correspondingly a parabolic relation between the skewness and flatness moments. These results indicate that the stochastic model is an accurate description of the burst dynamics in the tokamak SOL.
References
- (1) D. A. D’Ippolito et al., Phys. Plasmas 18 (2011) 060501; O. E. Garcia, Plasma Fusion Res. 4 (2009) 019.
- (2) O. E. Garcia et al., Plasma Phys. Control. Fusion 48 (2006) L1; 49 (2007) B47; Nucl. Fusion 47 (2007) 667.
- (3) B. LaBombard et al., Phys. Plasmas 8 (2001) 2107; Nucl. Fusion 45 (2005) 1658; Phys. Plasmas 15 (2008) 056106.
- (4) I. Cziegler et al., Phys. Plasmas 17 (2010) 056120; J. L. Terry et al., Nucl. Fusion 45 (2005) 1321; D. P. Stotler, J. Nuclear Mater. 313-316 (2003) 1066; J. R. Myra et al., Phys. Plasmas 18 (2011) 012305.
- (5) R. Kube et al., contribution P1-059 in these proceedings.
- (6) O. E. Garcia et al., Phys. Rev. Lett. 92 (2004) 165003; Phys. Plasmas 12 (2005) 062309; Phys. Scr. T122 (2006) 89.
- (7) N. Campbell, Proc. Cambridge Phil. Soc. 15 (1909) 117; S. O. Rice, Bell Sys. Tech. J. 23 (1944) 282.
- (8) O. E. Garcia, arXiv:1202.3603 (2012).
- (9) F. Sattin et al., Plasma Phys. Control. Fusion 51 (2009) 055013.
- (10) J. P. Graves et al., Plasma Phys. Control. Fusion 47 (2005) L1; J. Horacek et al., Czech. J. Phys. 55 (2005) 271.