Intra-day variability observations of S5 0716+714 over 4.5 years at 4.8 GHz
Abstract
Aims. We aim to search for evidence of annual modulation in the time scales of the BL Lac object S5 0716+714.
Methods. The intra-day variability (IDV) observations were carried out monthly from 2005 to 2009, with the Urumqi 25m radio telescope at 4.8 GHz.
Results. The source has shown prominent IDV as well as long-term flux variations. The IDV time scale does show evidence in favor of an annual modulation, suggesting that the IDV of 0716+714 is dominated by interstellar scintillation. The source underwent a strong outburst phase between mid-2008 and mid-2009; a second intense flare was observed in late 2009, but no correlation between the total flux density and the IDV time scale is found, implying that the flaring state of the source does not have serious implications for the general characteristics of its intra-day variability. However, we find that the inner-jet position angle is changing throughout the years, which could result in an annual modulation noise in the anisotropic ISS model fit. There is also an indication that the lowest IDV amplitudes (rms in flux density) correspond to the slowest time scales of IDV, which would be consistent with an ISS origin of the IDV of 0716+714.
Conclusions.
Key Words.:
BL Lacertae objects: individual: S5 0716+714 – radio continuum: galaxies – scattering1 Introduction
Blazars comprise an extreme subgroup of active galactic nuclei (AGNs), which consist of flat-spectrum radio quasars and BL Lac objects. They are variable on time scales ranging from less than a day to many years. This violent behavior of blazars is generally explained in terms of a relativistic jet oriented very close to our line of sight (Urry & Padovani 1995).
Intra-day variability (IDV) of AGN at centimeter wavelengths was discovered in the 1980s (Witzel et al. 1986; Heeschen et al. 1987). Today we know that IDV occurs in 25% – 50% of the flat-spectrum radio sources (Quirrenbach et al. 1992; Lovell et al. 2008), and 60% of the bright Fermi blazars (Liu et al. 2012). Since its discovery, two main explanations for the very short time scale variability have been proposed, one is that the IDV is intrinsic to the sources, but this frequently leads to a very high brightness temperature of the emitting components (Qian et al. 1991) that far exceeds the inverse-Compton limit (K, see Kellermann & Pauliny-Toth 1969). Another explanation is that the IDV is caused by propagation effects, namely by interstellar scintillation (ISS) in our galaxy (see Kedziora-Chudczer et al. 1997; Dennett-Thorpe & de Bruyn 2000; Bignall et al. 2003). For the “classical” type-II IDV sources (variability time scales 0.5–2 days), however, the origin of the variability is not completely understood (e.g Fuhrmann et al. 2008).
We have carried out a monitoring program for a sample of IDV sources from August 2005 to January 2010 with the Urumqi 25m radio telescope at 4.8 GHz. From the analyzed data, at least two IDV sources in the monitoring program have exhibited systematic changes of their variability time scales over the year (Gabányi et al. 2007; Marchili et al. 2012). This effect is known as the annual modulation of the time scales (e.g., Rickett et al. 2001); it is explained by assuming that the origin of the variability is interstellar scintillation. The scattering material is regarded to be located in a thin plasma screen at a distance on the order of tens or hundreds of parsecs from the Earth. The orbital motion of the Earth around the Sun leads to changes in the relative velocity between the observer and the scattering screen — the faster the Earth’s movement with respect to the scattering screen, the shorter the variability time scale. Because the Earth’s velocity follows a one-year periodic cycle, the relative velocity between the scattering screen and the observer should change accordingly, resulting in a seasonal cycle of the variability time scale.
The principal aim of our monitoring program is to search for evidence of annual modulation in the time scales of type-II IDV sources. Among the main targets of our monitoring campaign there is S5 0716+714. It is a BL Lac object; from optical imaging of the host galaxy, Nilsson et al. (2008) suggested a possible redshift of 0.31. S5 0716+714 is one of the most variable and compact blazars, showing multi-wavelength variability from radio to gamma ray (Raiteri et al. 2003; Abdo et al. 2010). VLA data show a halo-like jet (Antonucci et al. 1986; Wagner et al. 1996); VLBI images show a core-dominated jet pointing to the north that is misaligned with the VLA jets by (e.g., Bach et al. 2005). From multi-band long-term monitoring data, radio and optical light-curve behaviors appear to be quite different, only minor radio flux enhancements are found simultaneously with the major optical outbursts (Raiteri et al. 2003). On short time scales, strong intra-day variability is found in both radio and optical bands. In 1990, the detection of simultaneous transitions from fast to slow variability modes among radio and optical wavelengths during a four-week monitoring campaign suggested a common, source-intrinsic origin of the variability (see Quirrenbach et al. 1991). Since then, several multi-frequency observing campaigns have been carried out for S5 0716+714; significant evidence in favor of a correlation between optical and radio variability has not been found anymore, as discussed, e.g., in Fuhrmann et al. (2008). These authors hypothesized that both source-extrinsic and source-intrinsic mechanisms contribute to the IDV of the source, and that the importance of the two contributions may depend on the source opacity. In the source-extrinsic explanation, intra-day variations at frequencies of 3–8 GHz are attributed to ISS at the border between weak-ISS and strong-ISS (Rickett 2007). In the regime of weak scattering, relevant for 0716+714 at 5 GHz, the emitting components that are compact enough to show intrinsic variability on time scales of a day or less might also show ISS on similar time scales. However, to separate the source-intrinsic from the source-extrinsic contribution, it is necessary to carry on IDV monitoring programs that are sufficiently long to investigate the existence of possible annual modulation effects in the time scales of the variability.
2 Observation and data reduction
The IDV observations were carried out with the Urumqi 25m radio telescope, 3-5 days per month, when possible, from Aug. 2005 to Jan. 2010, with a central frequency of 4800 MHz and a bandwidth of 600 MHz; see Sun et al. (2007) for a description of the observing system. All observations were performed in ‘cross-scan’ mode, each scan consists of eight sub-scans in azimuth and elevation over the source position. This enabled us to check the pointing offsets in both coordinates. After applying a correction for pointing offsets, we corrected the measurements for the elevation-dependent antenna gain and the remaining systematic time-dependent effects by using several steep spectrum and non-variable secondary calibrators. Finally, we converted our measurements to absolute flux density with the frequently observed primary calibrator’s assumed flux densities (3C286, 3C48 and NGC7027). The complete data calibration procedure guarantees a high level of accuracy, on the order of 0.5%, in normal weather conditions.
Following the scheme by Kraus et al. (2003), some quantities were used to evaluate significance and amplitude of the variability, namely the reduced chi-square-test, the rms flux density over mean flux density (the so-called modulation index, ), and the 3 relative variability amplitude , which is corrected for noise-bias, defined as , where is the mean modulation index of all calibrators, describing the statistical measurement accuracy during the observation. In Table 1, we list the observational information and the results of the observations, in which the time scales are obtained from a structure function analysis (SF) as introduced in the next section. The columns give; (1) the epoch, (2) the day of year (DoY); (3) and (4) the duration of observation and the effective number of data points; (5) and (6) the SF time scale and relative error; (7), (8) and (9) the modulation index of calibrators, the modulation index of 0716+714 and the relative variability amplitude of the source; (10) the source’s average flux density and the rms variation of the flux density; (11) the reduced .
|

3 Variability analysis and discussion
From the results of the IDV observations in Table 1, and according to a test, 0716+714 exhibits prominent IDV in all observing sessions at a confidence level of %. Here, as a criterion for the source variability, the hypothesis of a constant function is examined; the datasets with a probability to be constant 0.1% are considered to be variable.
To analyze the variability time scales, we used the standard structure function method (SF), i.e. a first-order structure function analysis (Simonetti et al. 1985). Above the noise level, ideally, the SF rises monotonically with a power law shape and reaches its maximum at a ‘saturation’ level. The intersection of the power law fit with the plateau corresponding to this saturation level defines the characteristic variability time scale. In fact, the plateau is often not well pronounced, but it can be estimated by the mean of the SF around the first maximum. The errors of the power law fit to the SF have also to be taken into account. Depending on the uncertainties in the evaluation of both the SF saturation level and the power law fit, the estimated characteristic time scale changes. The error on the estimation of the time scale can therefore be obtained by taking into account the formal errors of the power-law fit and the fit to the SF plateau. Sometimes, the structure function may show more than one plateau, indicating the existence of multiple variability time scales. In those cases, we identified the characteristic time scale with the shortest one (Marchili et al. 2012).
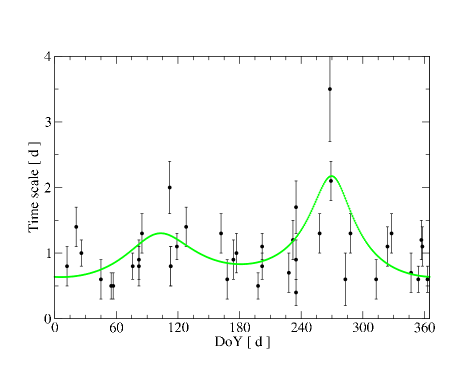
In Fig. 1 we plot the variability time scales versus the day of year (the so-called annual modulation plot) for all observing sessions. To investigate the possible existence of an annual modulation in the time scales of 0716+714, we fitted the time scales according to the model described in Qian & Zhang (2001), updated to take into account the case of anisotropic scattering (see, e.g., Bignall et al. 2006; Gabányi et al. 2007). An anisotropic scattering can be caused by either an elongation of the scintles (i.e., patches of focused or defocused light across which the Earth is moving) in a given direction, or an anisotropy of the emitting component (e.g., Gabányi et al. 2009).
According to our model (for more details of the ISS model-fit code, see Marchili et al. 2012) the variability time scale is expressed as a function of the day of year, and depends on the orientation of the elliptical scintillation pattern (a unit vector ), the relative velocity between the scattering screen and the Earth, , the distance to the screen, D, and the anisotropy factor, r:
| (1) |
The algorithm for the least-squares fitting of the time scales uses five free parameters: the relative velocity , projected onto the right ascension and the declination coordinates (which allows one to fit the screen velocity ( and ) relative to the Local Standard of Rest, since the Earth velocity is known with respect to the LSR), the distance to the screen, the anisotropy degree and the anisotropy angle (measured from east through north), which is derived from the vectorial product . The parameters that best fit the time scales of 0716+714 are reported in Table 2.
The result with the best fit anisotropic screen model is shown in Fig. 1; there is significant evidence in favor of an annual modulation of the time scales, which exhibit a remarkable slow-down peaking around DoY 270 and a secondary peak occurring around DoY 100. The screen appears to be slightly anisotropic, with an anisotropy ratio of about 1.7 and an anisotropy angle about 80 degrees. To follow the usual convention of radio image analysis, the position angle of the anisotropy is from north to east, this is roughly consistent with the inner-jet position angle ranging from a few to about 35 degrees in the VLBI images of 0716+714 (see, Britzen et al. 2009). Therefore the anisotropy might be also caused by an anisotropy of the emitting component in 0716+714. However, the data do not allow us to ambiguously determine whether the anisotropy originates from the intrinsic source structure or from the scattering screen. According to our model, the variability is associated to an interstellar cloud between the Earth and 0716+714 at a distance of 230 pc, whose characteristics could be investigated in the future, as was done for some other ISS-induced objects (Linsky, Rickett & Redfield 2008).
Anisotropic ISS models have been applied to several other IDV objects showing an annual modulation pattern, e.g., J1819+3845 (Dennett-Thorpe & de Bruyn 2003), PKS 1257326 (Bignall et al. 2006), J1128+592 (Gabányi et al. 2009), PKS 1519273 and PKS 1622253 (Carter et al. 2009), and S4 0954+65 (Marchili et al. 2012). It is challenging to detect an annual modulation of the variability time scales in IDV sources (in particular in the slower type-II sources) – a large amount of long (several days) IDV observations over years have to be performed. For our project, the observations were often not evenly and densely allocated over time; one has to overlap the data of years into the day of year (DoY); only after several years of observations, we were able to detect and fit an anisotropic seasonal cycle as shown in Fig. 1. The modeling assumes, however, that the ISS scattering screen is stable over several years. This assumption, however, is not necessarily true, as shown, e.g., in the case of J1819+3845, where the scattering medium that is responsible for the strong and rapid IDV of the source has moved away, leading to a significant decrease of the variability (Macquart & de Bruyn 2007; Koay et al. 2011). Changes in the scattering screen throughout the years, for instance, changes of the turbulent patches in the ISM (e.g. changes in the scattering measure, distance and/or anisotropy) will mostly result in changes of the scintillation strength, but may also affect and reduce the significance of the time scale fitting with an ISS model. This would explain the relatively high values frequently found for the best model fits of several IDV sources, such as J1819+3845 (=1.5; Dennett-Thorpe & de Bruyn 2003), PKS 1257326 (=1.97; Bignall et al. 2006), PKS 1519273, and PKS 1622253 (=0.8 and 2.1, respectively; Carter et al. 2009), and J1128+592 (=3.0; Gabányi et al. 2007). For 0716+714, we found a of 2.5, which is comparable with the results reported for the sources mentioned above. On the other hand, considering that the position angle of the 0716+714 jet is close to the anisotropy angle derived from our ISS model fit, it is plausible that the anisotropic scattering is caused by a source-intrinsic anisotropy. Because the inner-jet position angle is oscillating from to following a 5.70.5-year long-term variability cycle in the total flux density of 0716+714 (Raiteri et al. 2003; Fan et al. 2007; Britzen et al. 2009), the anisotropy angle may vary accordingly. This would also contribute to an increase of the of the annual modulation fit.
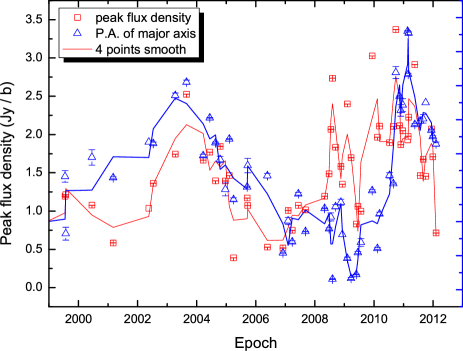
We have model-fitted the core (inner-jet) of the 15 GHz MOJAVE images (Lister et al. 2009) of 0716+714 and obtained the peak flux density (per beam) and the position angle evolution over 12 years; as shown in Fig. 2, the position angle (PA) positively correlates with the peak flux density, resulting a linear Pearson correlation coefficient of 0.44 (significance 4.6E-4). During our IDV observations in 2006-2009, the PA first decreased, then increased following the same trend of the flux density, and then decreased, with a PA variation of about 10. If the scintillating component in the source is anisotropic and contributes to the anisotropy of the ISS scattering, the ISS model fit to the 4.5 years of collected IDV time scales should be considerably affected, with a significant increase of the . The inner-jet PA evolution would influence the IDV time scales year by year; to investigate this effect, more densely sampled IDV observations and careful year-by-year anisotropic modeling would be necessary. In our case, the IDV time scale data are still too sparse in every single year to model a change of anisotropic scattering pattern induced by the source’s PA evolution.
In Table 2, the screen velocity from our model is much lower than the Earth orbiting velocity w.r.t. the LSR, indicating that the Sun’s motion plays the main role in the variation of the time scales. For 0716+714’s position on the sky, the time scale peak falls around DoY 270 (Fig. 1) as expected, supporting the hypothesis that ISS is the dominating contribution to the IDV of 0716+714.
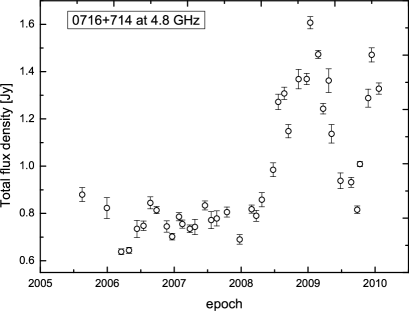
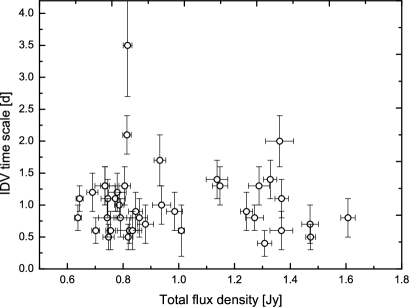
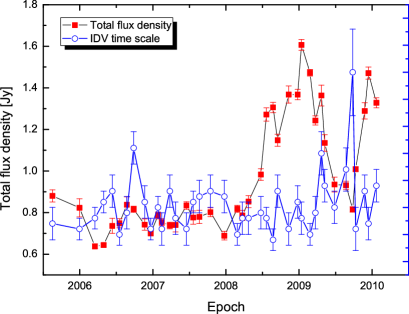
During the 4.5 years of monitoring, the flux density of 0716+714 showed strong variations also on time scales of months (Fig. 3); a flare appears from mid-2008 to mid-2009 with peak-to-through variations on the order of 100%, and a second flare occurs late in 2009. This long-term flux density variation should have a source-intrinsic origin. The IDV time scales during the flaring state could be prolonged due to, e.g., an enlargement of the scintillating component. However, in Table 1 and Fig. 4 we see that the IDV time scales in the flaring state (e.g. 1 Jy) are not very different compared to those estimated during the relatively ‘quiescent’ state (e.g. 1 Jy) in general, and no correlation is found between the IDV time scale and the total flux density, implying that the source flares do not seriously affect the variability time scales of 0716+714. The total flux density and the IDV time scale are plotted versus the observing epoch in Fig. 5. There is no correlation between the two, however, we can not completely rule out that the slower time scales observed in 2009 are somehow related to the 2008 flare taking into account a time delay of about one year. For the inner-jet kinematics of 0716+714, Britzen et al. (2009) proposed a model in which the VLBI components of 0716+714 are stationary with respect to the core, while the inner components are oscillating with regard to their PA. In this model, the flare in flux density is just caused by a geometric beaming effect — the inner components of 0716+714 do not change physically from a quiescent state (less beaming) to a flaring state (strong beaming), unlike the PA, which instead changes considerably; as a result, the projected size and/or anisotropy of the scintillating component onto our line of sight must change over the years. It is hypothesized that the inner-jet PA evolution of 0716+714 follows a 5.7-year modulation, which would affect the annual modulation of IDV time scales from year to year; future densely sampled IDV observations, e.g. every week, might be able to detect such an effect.
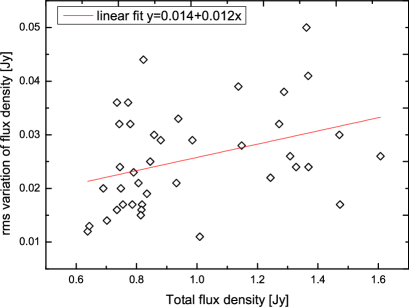
In the ISS-induced variability, the root mean square of the flux density is expected to increase linearly with the average flux density (Narayan 1992). Plotting the two parameters against each other (Fig. 6) indicates that there seems to be a weak positive correlation between them, with a linear Pearson correlation coefficient of 0.36 (significance of 0.02). This weak correlation may be explained either by an increase of the contribution of instrumental noise to the overall variability at the lowest flux densities, or by an rms dependence on the variability time scale — when this becomes longer than the observation duration, part of the variability may fall outside the observing window, leading to a decrease of the rms. If this is the case, we should see a decrease of the rms around the time of the year when the variability is slower. Plotting the rms flux density (with bins of 25 days) versus the day of year (Fig. 7), we find a trough around DoY 275 and a secondary trough around DoY 70. The result suggests that the IDV amplitude is low at the slowest time scales observed in the annual modulation plot (Fig. 1); the trough of the rms flux density around DoY 70 only poorly coincides with the secondary peak of time scale around DoY 100, but the difference is moderate.
|
4 Summary
We have carried out monthly IDV observations of the blazar 0716+714 over 4.5 years with the Urumqi 25m radio telescope at 4.8 GHz; the source has shown prominent IDV as well as long-term flux variations. With the structure function analysis we found that the IDV time scale does show evidence in favor of a seasonal cycle, a result which suggests that the IDV of 0716+714 is caused by interstellar scintillation. The source underwent a strong outburst phase between mid-2008 and mid-2009; a second intense flare was observed in late 2009, but no correlation between the total flux density and the IDV time scale is found, implying that the flaring state of the source does not have serious implications for the general characteristics of its intra-day variability. However, we know that the inner-jet position angle is changing during the years, which could result in a significant variation of the annual modulation pattern with time, and therefore a decrease in the significance of the anisotropic ISS model fit to the IDV time scales. We also found indications that the lowest IDV amplitudes (rms flux density) correspond to the slowest time scales of the variability, which we were able to explain reasonably well within the ISS model.
Acknowledgements.
We thank the anonymous referee for valuable comments, which have improved the paper. This research has made use of data from the MOJAVE database that is maintained by the MOJAVE team (Lister et al., 2009, AJ, 137, 3718). This work is supported by the National Natural Science Foundation of China (Grant No.11073036) and the 973 Program of China (2009CB824800). N.M. is funded by an ASI fellowship under contract number I/005/11/0.References
- (1) Abdo, A. A., Ackermann, M., Ajello, M., et al. 2010, ApJ, 722, 520
- (2) Antonucci, R. R. J., Hickson, P., Olszewski, E. W., Miller, J. S. 1986, AJ, 92, 1
- (3) Bach, U., Krichbaum, T. P., Ros, E., et al. 2005, A&A, 433, 815
- (4) Bignall, H. E., Jauncey, D. L., Lovell, J. E. J., et al. 2003, ApJ, 585, 653
- (5) Bignall, H. E., Macquart, J.-P., Jauncey, D. L., et al. 2006, ApJ, 652, 1050
- (6) Britzen, S., Kam, V. A., Witzel, A., et al. 2009, A&A, 508, 1205
- (7) Carter, S. J. B., Ellingsen, S. P., Macquart, J.-P., Lovell, J. E. J. 2009, MNRAS, 396, 1222
- (8) Dennett-Thorpe, J., & de Bruyn, A. G. 2000, ApJ, 529, L65
- (9) Dennett-Thorpe, J., & de Bruyn, A. G. 2003, A&A, 404, 113
- (10) Fan, J. H., Liu, Y., Yuan, H. Y., et al. 2007, A&A, 462, 547
- (11) Fuhrmann, L., Krichbaum, T. P., Witzel, A., et al. 2008, A&A, 490, 1019
- (12) Gabányi, K. E., Marchili, N., Krichbaum, T. P., et al. 2007, A&A, 470, 83
- (13) Gabanyi, K. E., Marchili, N., Krichbaum, T. P., et al. 2009, A&A, 508, 161
- (14) Heeschen, D. S., Krichbaum, T. P., Schalinski, C. J., & Witzel, A. 1987, AJ, 94, 1493
- (15) Kedziora-Chudczer, L., Jauncey, D. L., Wieringa M. H., et al. 1997, ApJ, 490, L9
- (16) Kellermann, K. I., & Pauliny-Toth, I. I. K. 1969, ApJ, 155, L71
- (17) Koay, J. Y., Bignall, H. E., Macquart, J.-P., et al. 2011, A&A, 534, L1
- (18) Kraus, A., Krichbaum, T. P., Wegner, R., et al. 2003, A&A, 401, 161
- (19) Linsky, J. L., Rickett, B. J., & Redfield, S. 2008, ApJ, 675, 413
- (20) Lister, M. L., Aller, H. D., Aller, M. F., et al. 2009, AJ, 137, 3718
- (21) Liu, X., Song, H.-G., Liu, J., et al. 2012, RAA, 12, 147
- (22) Lovell, J. E. J., Rickett, B. J., Macquart, J.-P., et al. 2008, ApJ, 689, 108
- (23) Macquart, J.-P. & de Bruyn, A. G. 2007, MNRAS, 380, L20
- (24) Marchili, N., Krichbaum, T. P., Liu, X., et al. 2012, A&A, accepted
- (25) Narayan, R. 1992, Royal Society of London Philosophical Transactions Series A, 341, 151
- (26) Nilsson, K., Pursimo, T., Sillanpää, A., et al. 2008, A&A, 487, L29
- (27) Qian, S. J., Quirrenbach, A., Witzel, A., et al. 1991, A&A, 241, 15
- (28) Qian, S.-J., & Zhang, X.-Z. 2001, Chinese J. Astron. Astrophys., 1, 133
- (29) Quirrenbach, A., Witzel, A., Krichbaum, T. P., et al. 1992, A&A, 258, 279
- (30) Quirrenbach, A., Witzel, A., Wagner, S., et al. 1991, ApJ, 372, L71
- (31) Raiteri, C. M., Villata, M., Tosti, G., et al. 2003, A&A, 402, 151
- (32) Rickett, B. J., Witzel, A., Kraus, A., et al. 2001, ApJ, 550, L11
- (33) Rickett, B. J. (2007) ‘Interstellar scintillation: observational highlights’, Astronomical & Astrophysical Transactions, 26:6, 429
- (34) Simonetti, J. H., Cordes, J. M., & Heeschen, D. S. 1985, ApJ, 296, 46
- (35) Sun, X. H., Han, J. L., Reich, W., et al. 2007, A&A, 463, 993
- (36) Urry, C. M., & Padovani, P. 1995, PASP, 107, 803
- (37) Wagner, S. J., Witzel, A., Heidt, J., et al. 1996, AJ, 111, 2187
- (38) Witzel, A., Heeschen, D. S., Schalinski, C., & Krichbaum, T. P. 1986, Mitteilungen der Astronomischen Gesellschaft Hamburg, 65, 239
S5 0716+71 [HB89] 0716+714