Chandra Observations of Galaxy Zoo Mergers: Frequency of Binary Active Nuclei in Massive Mergers
Abstract
We present the results from a Chandra pilot study of 12 massive galaxy mergers selected from Galaxy Zoo. The sample includes major mergers down to a host galaxy mass of 1011 that already have optical AGN signatures in at least one of the progenitors. We find that the coincidences of optically selected active nuclei with mildly obscured ( cm-2) X-ray nuclei are relatively common (8/12), but the detections are too faint ( counts per nucleus; erg s-1 cm-2) to reliably separate starburst and nuclear activity as the origin of the X-ray emission. Only one merger is found to have confirmed binary X-ray nuclei, though the X-ray emission from its southern nucleus could be due solely to star formation. Thus, the occurrences of binary AGN in these mergers are rare (0–8%), unless most merger-induced active nuclei are very heavily obscured or Compton thick.
Subject headings:
galaxies: active — X-rays: galaxies1. Introduction
Major mergers are a key component of current models for galaxy formation in a CDM Universe. Mergers can disrupt the star-forming gas and stellar disks of the progenitors, trigger a powerful burst of star formation, and reshape the remaining stellar content into a bulge. Perhaps with a small time delay, the supermassive black holes may feed on gas from the destabilized or destroyed disk, injecting energy in the form of radiation or kinetic outflows that sweep the remnant clear of dust and gas. First proposed by Sanders et al. (1988), this picture directly links the triggering of active galactic nuclei (AGNs) phases to the destructive potential induced by a merger. Recent semi-analytic models and hydrodynamic simulations have adopted this scenario to explain the fueling of AGNs and the red spheroidal remnants that are difficult to reproduce without some kind of “AGN feedback” (Springel et al., 2005; Di Matteo et al., 2005; Hopkins et al., 2006, 2008; Somerville et al., 2008).
In principle, major mergers carry with them two black holes, both of which may be accreting and be visible as distinct AGN during a phase of abundant gas availability that a major, gas-rich merger represents. Yet the evidence associating AGN phases with major mergers remains contested (De Robertis et al., 1998; Malkan et al., 1998; Schmitt, 2001; Pierce et al., 2007; Georgakakis et al., 2009; Gabor et al., 2009; Schawinski et al., 2011). Large optical surveys using Sloan Digital Sky Survey (SDSS) data have found 3.6% of spectroscopically confirmed AGNs are in closed binaries (5–100 kpc separation; Liu et al., 2011). The DEEP2 survey also found that binary AGN exist in 2.2% (2/91) of red galaxies with type 2 Seyfert optical spectra (Gerke et al., 2007; Comerford et al., 2009). However, optical surveys can easily miss obscured AGNs especially in merger systems where the gas is driven toward the center through dissipation (e.g., Hopkins et al., 2008). X-ray surveys are needed to identify the more highly obscured systems ( cm-2). We know of only a small number of binary AGN resolved directly using X-ray observations (e.g., Komossa et al., 2003; Guainazzi et al., 2005; Hudson et al., 2006; Bianchi et al., 2008; Foreman et al., 2009; Comerford et al., 2011; Fabbiano et al., 2011). The intrinsic frequency of binary AGN phases has not been observationally constrained, as the separation of individual X-ray sources is not possible in high-redshift sources and there has been no systematic search for such systems in known mergers. A study of the host galaxies of 185 nearby () BAT AGNs by Koss et al. (2011) found that these hard X-ray selected AGNs are preferentially found in massive galaxies with large bulge-to-disk ratios and large supermassive black holes. This may imply that the frequency of binary AGNs is higher in massive mergers.
In order to quantify the intrinsic frequency of double AGNs in the local universe, we embarked on a study of the presence of binary AGNs and their dependence on the mass of the host galaxies. The results from the present survey represent a pilot effort as the sample is comprised of only the most massive galaxies in the Galaxy Zoo merger sample. Thus, this paper aims to quantify the intrinsic frequency of double AGNs in the mass limit down to 1011 using a study of 12 merging galaxies with the Chandra X-ray observatory. Throughout this paper, we adopt km s-1 Mpc-1, , and .
2. Sample Selection
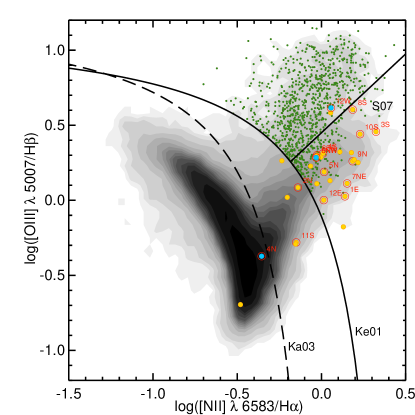
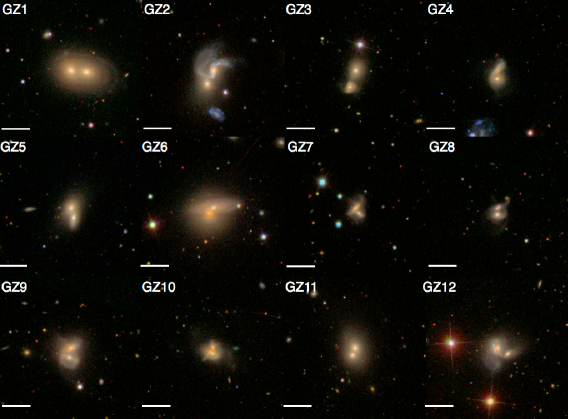
The initial parent sample was created from 3003 mergers identified via visual inspection by citizen scientists taking part in the Galaxy Zoo project (Lintott et al., 2008; Darg et al., 2010a, b). To date, this is the largest unbiased sample of mergers in the local Universe (). From this catalog, we whittled the sample down to only 328 major mergers (i.e., with a mass ratio of 3:1 or less) in which the primary galaxy has a mass111The stellar masses of the galaxies were calculated following the methodology outlined in Schawinski et al. (2010). Briefly, measurements from the five SDSS photometric bands were fitted to a library of model star formation histories generated from Maraston (1998, 2005) stellar models. Stellar masses are measured by finding the minimum of the statistic in the parameter space probed. ; we also required that the galaxies have SDSS spectroscopic data with signal-to-noise ratio greater than 3 and that at least one of the nuclei shows an AGN signature based on [O III]/H and [N II]/H narrow line ratios (Baldwin et al., 1981; Kewley et al., 2006). In addition, the AGN must be relatively luminous, with erg s-1 (yellow points in Figure 1). This last cut is to ensure that the AGN will be luminous enough for detection in the X-rays. Most of the objects in this final sample are LINERs or AGN and star-forming composites, from which we selected 12 that spanned the full starburst-composite-LINER/AGN range. The primary nuclei of the selected sample (yellow dots circled in red) also have roughly even distributions in the composite but not extreme starbursts (40%) and the LINER (53%) regimes of Figure 1 and these mergers have projected nuclear separations between 5 to 14 kpc. The optical line ratios are taken from Oh et al. (2011). The 12 galaxies in our sample are listed in Table 1; for convenience, we will identify the targets as Galaxy Zoo (GZ) objects throughout this paper. For clarity, we will refer to the merging galaxies as either “mergers” or “galaxies” and the individual progenitors of these mergers as “nuclei” for the remainder of this paper. Figure 2 is a collage of the SDSS images of the sample. All of these mergers show disturbed morphology indicative of tidal disruptions.
3. Observations, Data Reduction and Analysis
The 12 mergers were observed with Chandra between November 2010 and May 2011 (PI: Schawinski). Each pair of galaxies was observed in a single exposure of 4.9 ks. For each merger, the more massive primary nucleus was placed at the nominal aim point of the ACIS-I3 chip.The progenitors of the mergers are close enough that the secondary nuclei were also within the same chip.
The data were reduced using CIAO version 4.3 and CALDB version 4.4.3. The data reduction followed procedures outlined in the Science Analysis Threads for ACIS imaging data on the CIAO web page222http://cxc.harvard.edu/ciao/threads/index.html. For each of the 12 detected nuclei, we extracted counts in the soft (0.5–2 keV) and hard (2–8 keV) bands. Two of these nuclei were detected having only two counts in the soft band, but none in the hard band. Therefore, only 10 nuclei have valid hardness ratios (HRs333, where H and S are the total counts in the hard and soft bands, respectively.; Table 1) for estimating spectral properties. For the rest of this paper, only the 10 nuclei with valid HRs will be discussed.
An HR analysis was performed using the latest version of FTOOLS released as part of HEASoft 6.11. Due to the low number of counts measured from our sample, we followed Teng et al. (2005) and used the measured HR to estimate a photon index () by assuming a redshifted power law model modified only by Galactic absorption. The nominal HR and the estimated photon indices are tabulated in Table 1. The X-ray fluxes were then estimated using PIMMS by assuming the HR-derived photon indices and the count rates from the observations.
4. Discussion
The shapes of the X-ray spectra differ for AGNs, obscured AGNs, starbursts, and AGN-star forming composites. Typically, unobscured AGNs have spectra that are well-represented by a power law with photon index of 1.8. Obscuration affects the lower energy (2 keV) photons more readily than the higher energy photons and thus flatten or harden the AGN spectra. Starburst spectra are dominated by emission in the lower energies, but low-mass X-ray binaries tend to have relatively flat spectra. Composite objects generally have softened spectra compared to simple AGN spectra due to the soft-energy contribution of the starburst.
Given that these mergers contain optically selected AGNs, it is unsurprising that eight of the 10 nuclei have HRs that are consistent with the canonical spectral shape of unobscured AGNs (). As many as five could be steeper (GZ 1E, GZ 4S, GZ 5S, GZ 7SW, and GZ 9S), as if star formation is a significant contributor, though the errors in HR and allow for unobscured AGN values. Similarly, three nuclei (GZ 2N, GZ 9N, and GZ 11S) have nominally flat spectra, implying dominance from star formation or obscured nuclear activity. However, the errors in HR cannot rule out unobscured AGN as the source of the X-ray emission. Finally, two nuclei (GZ 3S and GZ 10S) have flat or inverted photon indices ( after accounting for the measurement errors), suggesting some level of obscuration. If we assume a power law with fixed at 1.8, the observed HRs imply column densities () cm-2 (Table 1). At these column densities, the HR estimates of the 2–10 keV luminosity are reliable to within 40% (Teng & Veilleux, 2010). These columns do not suggest the presence of Compton-thick nuclei though there remains a possibility of leaky, Compton-thick absorbers.
4.1. Starburst Contamination
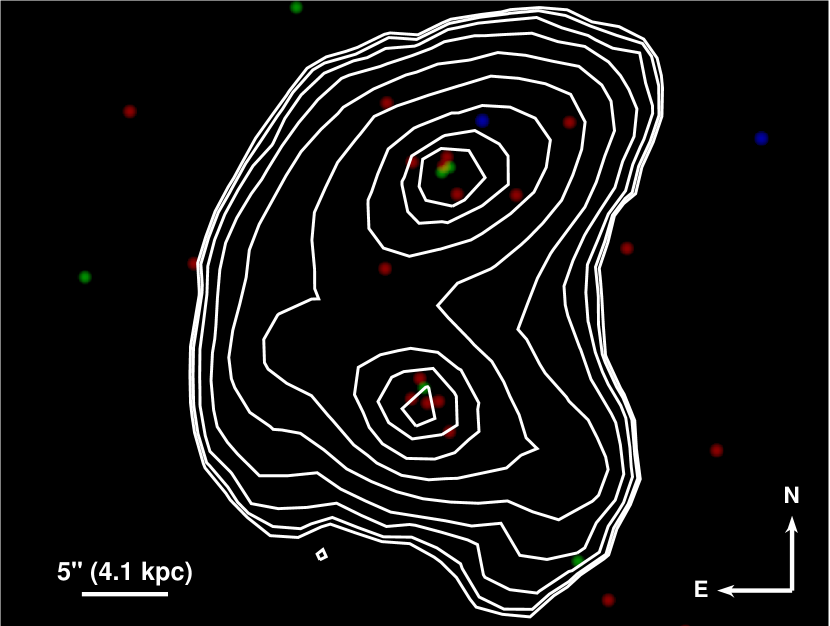
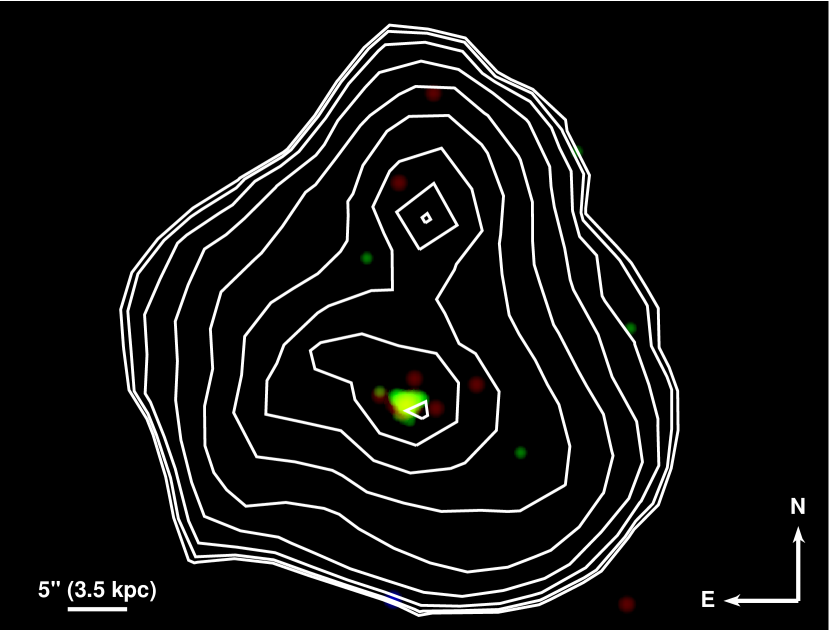
Of the 12 mergers in the sample, one has no X-ray detection (GZ 8) and only one (GZ 9) exhibits binary X-ray nuclei (Figure 3). The remaining 10 mergers have one detected nucleus each. In GZ 5, GZ 7, and GZ 12, the X-ray-detected nucleus is not the one with an optical AGN classification, so in that sense they are double nuclei. In addition, the detected southern nucleus of GZ 10 has extended soft X-ray emission (Figure 3), suggesting a contribution from star formation. This raises the question of whether more of the detections might be contaminated by star formation.
To explore this possibility, we compare star formation rates derived from the SDSS u band luminosities following Hopkins et al. (2003) with those derived from the 2–10 keV luminosity following Ranalli et al. (2003) in Figure 4. When compared with the SDSS -band derived star formation rates (Figure 4), the X-ray derived star formation rates of four nuclei (GZ 1E, GZ 5S, GZ 7SW, and GZ 9S) have unconstrained lower limits. While the nominal X-ray derived star formation rates are above the line of equality implying the presence of AGNs, we cannot rule out the possibility that the X-ray emission can be accounted for solely by star formation in these four nuclei. The X-ray luminosities of the remaining nuclei are above those expected from star formation even after the consideration of the 40% error in the calculation of the X-ray luminosity, consistent with additional contribution to the X-ray luminosity by nuclear activity. Accounting for the error bars, the southern nucleus in GZ 9 may also be dominated by star formation, suggesting GZ 9 does not contain an AGN pair.
4.2. Compton-thick Nuclei
Three nuclei of the 12 SDSS-selected mergers are not detected in X-rays (GZ 5N, GZ 7NE, and GZ 12E). We already know these have optically identified AGN components, so it is unclear whether the non-detections are due to faint AGNs (two of the three have the highest redshifts in our sample) or Compton-thick AGNs. If we assume these are faint AGNs, a power law model with = 1.8 and mild absorption from the Milky Way places upper limits to the luminosity of these objects. Not accounting for intrinsic absorption, the 2-10 keV luminosity for GZ 5N is erg s-1 cm-2 and erg s-1 cm-2 for GZ 7NE and GZ 12E. In the case of the Compton-thick AGNs, the optical signature is coming from the much larger scale narrow- and broad-line regions while the X-ray is sensitive to the small scale emission from the black hole itself. The presence of undetected obscured nuclei would affect our statistics of the frequency of binary AGNs. It is unlikely that all of the secondary nuclei contain Compton-thick X-ray sources, unless an obscured phase is common to mergers (unlike isolated AGNs). Even without a merger-induced obscured phase, the number of heavily obscured AGNs is comparable to the number of less obscured AGNs (Treister et al., 2009); the presence of Compton-thick nuclei remains a possibility.
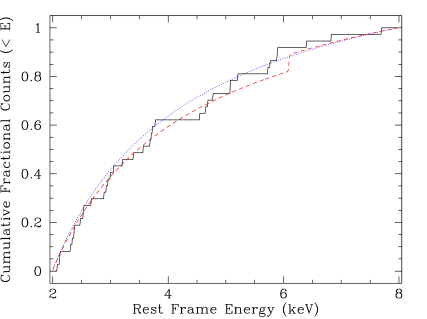
While the individual detected nuclei have too few counts for spectral fitting to definitively establish whether Compton-thick AGNs are present, we considered the cumulative rest-frame photon distribution of the detected nuclei in the hard band. We compared this observed distribution with the expected photon distributions from unobscured AGNs and from Compton-thick AGNs. In the former case, we assumed a single unabsorbed power law; in the latter case, we assumed a power law with an iron emission line at 6.4 keV with an equivalent width of 1 keV, a typical signature of Compton-thick AGNs. For both cases, the total photon counts were normalized to be the same as the total detected counts. In Figure 5 we plot the cumulative distribution of the detected photons in our sample. There is no clear distinction between the observed distribution with either model. In fact, the two-tailed Kolmogorov-Smirnov (K-S) test statistics for the two cases are nearly identical. As a sanity check, we compared the two modeled distributions with each other and there is a clear difference at the 80% confidence level. Therefore, we cannot rule out the possibility that Compton-thick AGNs are present at the level that we are able to detected these sources.
4.3. U/LIRGs in Formation?
In theoretical models of galaxy mergers (e.g., Hopkins et al., 2008), luminous and ultraluminous infrared galaxies (U/LIRGs) represent a stage that mergers go through before the formation of elliptical galaxies. Initially, tidal torques enhance star formation and black hole accretion. Then in the final coalescence of the galaxies, massive inflows of gas trigger starbursts with strengths similar to those inferred for U/LIRGs.
The mergers in our sample appear to be the predecessors to U/LIRGs in this evolutionary picture. The X-ray luminosities estimated for our mergers are approximately 10 times lower than those observed in most U/LIRGs, but are consistent with the lower end of the range measured in LIRGs (Teng & Veilleux, 2010; Lehmer et al., 2010; Iwasawa et al., 2011). This implies mergers in our sample are in the earliest stages of interaction, where the growth of the central black hole has not yet peaked.
The incidence of binary AGNs in U/LIRGs is also rare. The Revised Bright Galaxy Survey (RBGS; Sanders et al., 2003) is a flux-limited sample of U/LIRGs from the IRAS All Sky Survey. Of the 629 extragalactic objects with 60 m flux greater than 5.24 Jy, 86 are interacting galaxies that are visually similar to our sample in the optical (i.e. close binaries). Of these, 32 have high-quality X-ray data from either Chandra or XMM-Newton that is sensitive to the presence of an AGN. Not accounting for the presence of undetected Compton-thick nuclei, only 3% (1/32) of the RBGS sources with X-ray data show binary X-ray nuclei (NGC 6240; Komossa et al., 2003). This is consistent with the 0–8% (0–1 out of 12) we observe in our modest SDSS sample.
4.4. Frequency of Binary AGNs in SDSS Mergers
From the very short snapshots of our study, we have found that coincidence of optically selected active nucleus with mildly obscured X-ray nucleus is relatively common (8/12). Given the faint detections, these snapshots are too short to place strong limits on the absence of AGN in the undetected galaxies, so it is difficult to comment on the frequency of binary active nuclei. However, we do detect a pair of X-ray nuclei in GZ 9, implying that this is uncommon unless the second nucleus is heavily obscured. In that instance, the most likely scenario would be that all nuclei are obscured. That is, either binary nuclei are uncommon, or merger nuclei in general have a high probability of being heavily obscured. The latter possibility cannot be addressed by the current sample. To do better, we will need to increase the exposure times, expand our merger sample for better statistics, and include a sample of major mergers for which there are no optically detected nuclei. Another natural follow-up would be to extend the study to a similarly selected sample with a lower mass limit to examine the dependence of binary AGNs on the mass of the host galaxies.
References
- Baldwin et al. (1981) Balwdin, J.A., Phillips, M.M., & Terlevich, R., 1981, PASP, 93, 5
- Bianchi et al. (2008) Bianchi, S. et al. 2008, MNRAS 386, 105
- Comerford et al. (2009) Comerford, J.M. et al. 2009, ApJ, 698, 956
- Comerford et al. (2011) Comerford, J.M.,, Pooley, D., Gerke, B.F., & Madejski, G.M. 2011, ApJ, 737, L19
- Darg et al. (2010a) Darg, D.W. et al. 2010a, MNRAS, 401, 1552
- Darg et al. (2010b) Darg, D.W. et al. 2010b, MNRAS, 401, 1043
- De Robertis et al. (1998) De Robertis, M.M., Yee, H.K.C., & Hayhoe, K. 1998, ApJ, 496, 93
- Dickey & Lockman (1990) Dickey, J.M. & Lockman, F.J. 1990, ARA&A, 28, 215
- Di Matteo et al. (2005) Di Matteo, T. et al. 2005, Nature, 433, 604
- Fabbiano et al. (2011) Fabbiano, G., Wang, J., Elvis, M., & Risaliti, G. 2011, Nature, 477, 431
- Foreman et al. (2009) Foreman, G., Volonteri, M., & Dotti, M. 2009, ApJ, 693, 1554
- Gabor et al. (2009) Gabor, J.M. et al. 2009, ApJ, 691, 705
- Gehrels (1986) Gehrels, N. 1986, ApJ, 303, 336
- Georgakakis et al. (2009) Georgakakis, A., et al. 2009, MNRAS, 397, 623
- Gerke et al. (2007) Gerke, B.F. et al. 2007, ApJ, 660, L23
- Guainazzi et al. (2005) Guainazzi, M. et al. 2005, A&A, 429, L9
- Hopkins et al. (2003) Hopkins, A.M. et al. 2003, ApJ, 599, 971
- Hopkins et al. (2006) Hopkins, P.F. et al. 2006, ApJS, 163, 1
- Hopkins et al. (2008) Hopkins, P.F. et al. 2008, ApJS, 175, 356
- Hudson et al. (2006) Hudson, D.S., Reiprich, T.H., Clarke, T.E., & Sarazin, C.L., 2006, A&A, 453, 433
- Iwasawa et al. (2011) Iwasawa, K. et al. 2010, A&A, 529, 106
- Kauffman et al. (2003) Kauffman, G. et al. 2003, MNRAS, 397, 135
- Kewley et al. (2001) Kewley, L.J., Dopita, M. A., Sutherland, R. S., Heisler, C. A., & Trevena, J. 2001, ApJ, 556, 121
- Kewley et al. (2006) Kewley, L.J., Groves, B., Kauffmann, G., & Heckman, T. 2006, MNRAS, 372, 961
- Komossa et al. (2003) Komossa, S. et al. 2003, ApJ, 582, L15
- Koss et al. (2011) Koss et al. 2011, ApJ, 739, 57
- Lehmer et al. (2010) Lehmer, B.D. et al. 2010, ApJ, 724, 559
- Lintott et al. (2008) Lintott, C.J. et al. 2008, MNRAS, 389, L1179
- Liu et al. (2011) Liu, X., Shen, Y., Strauss, M.A., & Hao, L. 2011, ApJ, 737, 101
- Malkan et al. (1998) Malkan, M.A., Gorjian, V., & Tam, R. 1998, ApJS, 117, 25
- Maraston (1998) Maraston, C. 1998, MNRAS, 300, 872
- Maraston (2005) Maraston, C. 2005, MNRAS, 362, 799
- Oh et al. (2011) Oh, K., Sarzi, M., Schawinski, K., & Yi, S.K., 2011, ApJS, 193, 13
- Pierce et al. (2007) Pierce, C.M. et al. 2007, ApJ, 660, L19
- Ranalli et al. (2003) Ranalli, P., Comastri, A., & Setti, G. 2003, A&A, 399, 39
- Sanders et al. (1988) Sanders, D.B. et al. 1988, ApJ, 325, 74
- Sanders et al. (2003) Sanders, D.B. et al. 2003, ApJ, 126, 1607
- Schawinski et al. (2007) Schawinski, K. et al. 2007, MNRAS, 382, 1415
- Schawinski et al. (2010) Schawinski, K. et al. 2010, ApJ, 711, 284
- Schawinski et al. (2011) Schawinski, K. et al. 2011, ApJ, 727, L31
- Schmitt (2001) Schmitt, H.R. 2001, AJ, 122, 2243
- Somerville et al. (2008) Somerville, R.S. et al. 2008, MNRAS, 391, 481
- Springel et al. (2005) Springel, V. et al. 2005, MNRAS, 361, 776
- Teng et al. (2005) Teng, S.H. et al. 2005, ApJ, 633, 664
- Teng & Veilleux (2010) Teng, S.H. & Veilleux, S. 2010, ApJ, 725, 1848
- Treister et al. (2009) Treister, E., Urry, C.M., & Virani, S. 2009, ApJ, 696, 110
| AGN ID | SDSS ID | R.A. | Dec. | Sep. | Type | M⋆ | S | H | HR | Est. | Est. | ||||
|---|---|---|---|---|---|---|---|---|---|---|---|---|---|---|---|
| (1) | (2) | (3) | (4) | (5) | (6) | (7) | (8) | (9) | (10) | (11) | (12) | (13) | (14) | (15) | (16) |
| GZ 1 | 0.024 | 5.12 | 0.366 | ||||||||||||
| E∗ | 38195576881250 | 07:51:21.0 | +50:14:10.0 | (10.5) | L | 11.19 | 3 | 1 | 2.12 | 0.46 | 0.57 | ||||
| W | 38195576881249 | 07:51:18.7 | +50:14:08.0 | 11.18 | |||||||||||
| GZ 2 | 0.026 | 1.22 | 0.352 | ||||||||||||
| N∗ | 39130806861890 | 14:01:41.4 | +33:49:36.8 | (10.9) | C | 11.10 | 2 | 2 | 1.00 | 63.0 | 1.33 | 1.96 | |||
| S | 39130806861889 | 14:01:42.1 | +33:49:17.6 | 10.89 | |||||||||||
| GZ 3 | 0.046 | 2.83 | 0.416 | ||||||||||||
| N | 36916218937372 | 15:11:20.9 | +11:23:54.5 | (22.3) | 11.18 | ||||||||||
| S∗ | 36916218937373 | 15:11:21.5 | +11:23:31.4 | L | 11.05 | 3 | 4 | 0.75 | 95.0 | 2.87 | 13.5 | ||||
| GZ 4 | 0.028 | 2.67 | 0.198 | ||||||||||||
| N | 41532774793359 | 09:36:34.0 | +23:26:39.3 | (6.6) | S | 10.68 | |||||||||
| S∗ | 41532774793358 | 09:36:34.0 | +23:26:27.0 | L | 11.04 | 6 | 2 | 2.10 | 0.88 | 1.50 | |||||
| GZ 5 | 0.029 | 2.93 | 0.233 | ||||||||||||
| N∗ | 29388212322361 | 08:46:20.2 | +47:09:23.1 | (8.0) | L | 11.05 | |||||||||
| S | 29388212322360 | 08:46:19.9 | +47:09:09.3 | 11.01 | 3 | 1 | 2.09 | 223.9 | 0.46 | 0.85 | |||||
| GZ 6 | 0.029 | 0.92 | 0.165 | ||||||||||||
| NW | 29652348223597 | 16:29:57.5 | +40:37:50.8 | (5.7) | L | 11.18 | |||||||||
| SE∗ | 29652348223595 | 16:29:58.1 | +40:37:42.9 | L | 11.66 | 3 | 0 | ||||||||
| GZ 7 | 0.048 | 4.03 | 0.148 | ||||||||||||
| NE∗ | 34621631086789 | 08:38:17.9 | +30:55:00.7 | (8.2) | L | 11.22 | |||||||||
| SW | 34621631086790 | 08:38:17.6 | +30:54:53.3 | 10.77 | 7 | 1 | 2.95 | 0.36 | 1.83 | ||||||
| GZ 8 | 0.056 | 1.44 | 0.161 | ||||||||||||
| N | 38618094354457 | 10:22:56.5 | +34:46:56.5 | (10.4) | 10.82 | ||||||||||
| S∗ | 38618094354456 | 10:22:56.6 | +34:46:46.6 | L | 11.10 | ||||||||||
| GZ 9 | 0.033 | 1.18 | 0.225 | ||||||||||||
| N∗ | 29156279631878 | 11:07:13.3 | +65:06:06.5 | (8.8) | L | 11.14 | 4 | 2 | 1.65 | 10.5 | 1.03 | 2.46 | |||
| S | 29156279631879 | 11:07:13.5 | +65:05:53.2 | 10.81 | 5 | 1 | 2.55 | 0.40 | 0.96 | ||||||
| GZ 10 | 0.034 | 2.19 | 0.123 | ||||||||||||
| N | 39647816761431 | 10:47:11.2 | +30:43:35.5 | (4.9) | 11.00 | ||||||||||
| S∗ | 39647816761430 | 10:47:11.2 | +30:43:27.6 | L | 11.08 | 20 | 19 | 1.06 | 50.1 | 12.4 | 31.5 | ||||
| GZ 11 | 0.039 | 1.34 | 0.175 | ||||||||||||
| N | 35661548929057 | 09:57:52.9 | +36:20:57.5 | (8.0) | 11.27 | ||||||||||
| S∗ | 35661548929058 | 09:57:53.2 | +36:20:47.1 | C | 11.16 | 1 | 1 | 1.02 | 0.65 | 2.18 | |||||
| GZ 12 | 0.041 | 1.74 | 0.281 | ||||||||||||
| E∗ | 38570323918904 | 13:52:26.7 | +14:29:27.2 | (13.5) | L | 11.19 | |||||||||
| W | 38570323918903 | 13:52:25.7 | +14:29:19.3 | A | 10.86 | 2 | 0 |
Note. — Col.(1): Galaxy Zoo merger identifier in this paper. ∗ represents the nucleus in the pair with an optical spectrum from SDSS. Col. (2): SDSS spectroscopic object ID with a prefix of 5877. Col.(3)-(4): Right ascension and declination in J2000. Col.(5): Redshift. Col.(6): Galactic column density in units of cm-2(Dickey & Lockman, 1990). Col.(7): Projected optical separation of the nuclei in arcminutes (kpc). Col.(8) Optical spectral type classification based on Figure 1 (A=AGN, L=LINER, C=AGN/Star-forming composite, and S = star-forming). Col.(9): of the galaxy mass, derived from the SDSS data (e.g., Schawinski et al., 2010). Col.(10)-(11): Number of counts in the soft (0.5–2 keV) and hard (2–8 keV) bands, respectively. Col.(12): Hardness ratio. The error bars are propagated assuming Poisson statistics (Gehrels, 1986). Col.(13): Photon index estimated from the observed hardness ratio assuming Galactic . Col.(14): Estimated intrinsic column density for the source assuming a power law with in units of cm-2. Col.(15): Estimated 2–10 keV flux by assuming a redshifted power law with estimated from Column 13 normalized by the detected count rate. The flux is given in units of erg s-1 cm-2. Col.(16): Estimated 2–10 keV luminosity based on flux in Column 15. The luminosity is given in units of erg s-1.