Graduate School of Science, Nagoya University, Nagoya, Japan
E-mail
On behalf of the Belle collaboration and
supported by a Grant-in-Aid for Scientific
Research on Innovative Areas “Elucidation of New Hadrons with a
Variety of Flavors” from the ministry of Education, Culture,
Sports, Science and Technology of Japan and a Grant-in-Aid for
for Young Scientists (B) under contract 24740158.
Abstract:
We review recent studies on exotic states at the Belle experiment.
The results include: (1) The measurement of the cross
sections of ,
, and for masses that range from threshold to 4.0 GeV.
In addition to signals from well
established spin-zero and spin-two
charmonium states, there are clear resonant structures below charmonium threshold,
which have not been previously observed. We report a spin-parity analysis for the new structures;
(2) No signal is observed in or
mode in decays. A narrow peak at 3823.5 MeV/ (named as
) to with a significance of
4.2 standard deviations including systematic uncertainty is
observed in ;
(3) The bottomonium states , and
are observed in the reaction ;
(4) The observation of two narrow charged structures (named as
and ) in the mass spectra of the
and pairs
that are produced in association with a single charged pion in Y(5S) decays.
1 Introduction
In hadronic physics, the best understood quark-antiquark systems are heavy quarkonia,
i.e, or mesons. The discovery of the missing
or states and the precise measurements of properties of the
already observed ones are important.
The QCD-motivated models predict the existence of hadrons of more complex structure
than conventional mesons or baryons, such as hybrids, multiquark states of either
molecular, tetraquark or hadrocharmonium configuration. As the conventional
hadron spectrum is much cleaner than the dense spectrum of light states, exotic
states containing or are expected
to be identified more easily than the ones predicted in the
light spectrum. Any resonance observed in addition to predicted multiplets might give a hint of
such an exotic spectroscopy.
Some of the recently observed charmonium-like or bottomonium-like XYZ states could be candidates for the
exotic hadrons mentioned. However most of them still await confirmation or their properties need to be
further studied before any decisive interpretation is made. Here, we review some recent results
on the exotic hadrons from Belle experiment.
2 Observation of new resonant structures in , and
Recently a clear signal for a new state
[1] and evidence for
another state [2]
have been reported, thereby introducing new puzzles to
charmonium or charmonium-like spectroscopy.
It is natural to extend the above theoretical picture to similar
states coupling to , or .
The measurements of the cross sections for
[3], where and
, are based on an analysis of an 870 fb-1 data sample taken at or
near the () resonances with the Belle detector
operating at the KEKB asymmetric-energy collider.
After event selections, clear or signal is observed.
The magnitude of the vector sum of the final particles’ transverse
momenta in the center-of-mass (C.M.) frame, , which approximates the transverse momentum of the
two-photon-collision system, is used as a discriminating variable
to separate signal from background.
We obtain the number of
events in each invariant mass bin by fitting the distribution between zero and 0.9 GeV/.
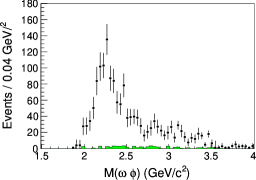
The resulting invariant mass
distributions are shown in Fig. 1, where
there are some obvious structures in the low
invariant mass region.
Figure 1: The (a) , (b) and (c) invariant mass distributions.
The shaded histograms are from the corresponding
normalized sidebands, which will be subtracted in calculating
the final cross sections.
Two-dimensional (2D) angular distributions are
investigated to obtain the of the structures. In the process , five angles are kinematically independent.
We choose , , ,
, and [4] and
use the transversity angle
() and polar-angle product () variables to analyze the
angular distributions. They are defined as , .
We obtain the number of signal events by fitting the
distribution in each and bin in the 2D
space, which is divided into , , and
bins for , , and , respectively, for GeV/,
in some wider mass bins as shown in Fig. 2.
The obtained 2D angular distribution data are fitted with the
signal shapes from MC-simulated samples with different
assumptions (, , , ). We find:
(1) for : (-wave) or (-wave)
can describe data with or 1.2, while
a mixture of (-wave)
and (-wave) describes data with (
is the number of degrees of freedom); (2) for : a mixture
of (-wave) and (-wave) describes data with
; and (3) for : a mixture of
(-wave) and (-wave) describes data with
.
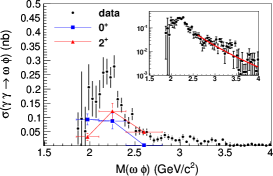
The cross sections are shown in
Fig. 2. The cross sections for
different values as a function of are also shown in
Fig. 2. While there are substantial
spin-zero components in all three modes, there are also
significant spin-two components, at least in the and modes.
Figure 2: The cross sections of
(a), (b), and (c)
are shown as points with error
bars. The cross sections for different values as a
function of are shown as the triangles and squares with error bars.
The inset also shows the cross section on
a semi-logarithmic scale. In the high energy region, the solid curve
shows a fit to a dependence for the cross section after the significant charmonium contributions
(, and ) were excluded.
The cross sections for are
much lower than the prediction of the tetraquark model [5]
of 1 nb, while the resonant structure in the mode is
nearly at the predicted position. However, the cross section
is an order of magnitude lower than the expectation in the tetraquark model.
On the other hand, the t-channel factorization model [6] predicted that
the cross sections vary between 0.001 nb and 0.05 nb in the mass region
of 2.0 GeV/ to 5.0 GeV/, which are much lower than the experimental data.
For , the t-channel factorization model [6]
predicted a broad structure between 1.8 GeV/ and 3.0 GeV/ with a peak cross section
of 10-30 nb near 2.2 GeV/, while the one-pion-exchange model [7] predicted an
enhancement near threshold around 1.6 GeV/ with a peak cross section of 13 nb using
a preferred value of the slope parameter.
Both the peak position and the peak height predicted in [6] and [7]
disagree with our measurements.
3 Charmonium and charmonium-like states
If is a tetraquark state, then it has a -odd parity () partner,
which can dominantly decay into
and . and decay modes are used in the search for
-odd partner of the and other new narrow resonances. In all
the decay modes, is reconstructed via and .
candidates are identified using energy difference and beam-energy constrained mass , where is the beam
energy in the C.M. frame, and and are the energy and momentum of
the reconstructed particles in the C.M. frame.
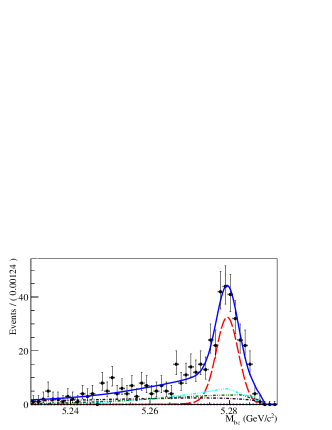
The signal region for candidates
is defined as GeV and -35 MeV 30
MeV. The final invariant mass distribution is shown in Fig. 3
together with the fitted results. No hint of a narrow resonance is
evident from the current statistics. No signal is seen and
we obtain the limit
at 90% C.L.
Figure 3: The fit to the distribution. Red dashed (green long dashed) curve shows the signal for (phase space component ), while black dashed-dotted curve shows the background parameterized using MC sample.
Complimentary to study, the search for the
’s -odd partner is also
carried in process. Besides the
’s -odd partner,
we also keep an eye on any other possible narrow charmonium or charmonium-like candidate.
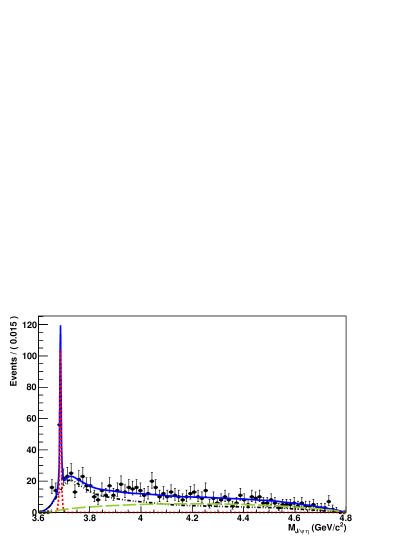
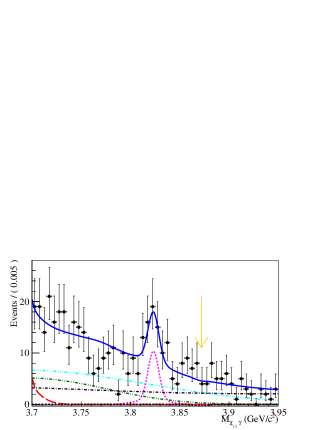
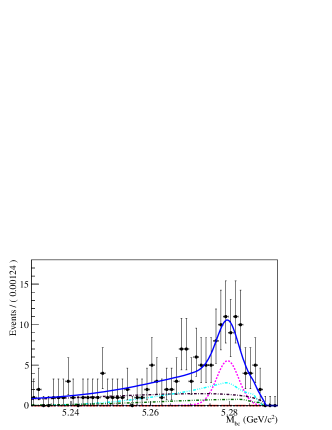
After all the event selections, Fig. 4 shows the distribution with GeV (top left),
enlarged distribution (top right),
distribution with GeV (bottom left),
and distribution with GeV (bottom right).
The dots with error bars are data, and the blue solid lines are the projections from 2D unbinned
maximum likelihood fits. No signal is seen and
the limit
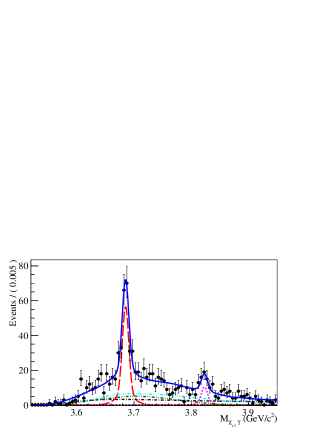
at 90% C.L. is obtained. Besides the clear signal, we find a clear evidence of a narrow peak
at MeV in , as shown in Fig. 4 with pink dashed curve (named as ).
The signal significance is 4.2 with systematic error included.
The mass and width of this peak are estimated to be
MeV and MeV, respectively. We noticed that
charmonium model predicts a narrow state ( ) at around
3810-3840 MeV/ [8]. So the is probably state.
The measured
is , where the first errors are statistical and the
second systematic.
Figure 4: The projections from 2D unbinned maximum likelihood fits to
the distribution with GeV (top left),
enlarged distribution (top right, yellow arrow shows the position),
distribution with GeV (bottom left),
and distribution with GeV (bottom right).
The dots with error bars are data. The blue solid line is form the overall fit. The
red large-dashed and pink dashed curves are for and signals, respectively, while
black dotted-dashed, dark green two dotted-dashed, and cyan three dotted-dashed curves
are for the combinatorial background, other than events,
and peaking background component, respectively.
4 Bottomonium and bottomonium-like states
The spin-singlet states and alone provide information
concerning the spin-spin (or hyperfine) interaction in bottomonium.
Measurements of the masses provide
unique access to the -wave hyperfine splitting, ,
the difference between the spin-weighted average mass of the -wave triplet states ( or )
and that of the corresponding , or . We use
a data sample collected
near the peak of the resonance () with the Belle detector
to report the first observation of the and
produced via in the region [9].
We observe the states in the missing mass spectrum of hadronic events.
The missing mass is defined as
where is the 4-momentum of the determined from the
beam momenta and is the 4-momentum of the
system. The transitions between states provide
high-statistics reference signals.
To reconstruct the transitions
inclusively, we use a general hadronic event selection.
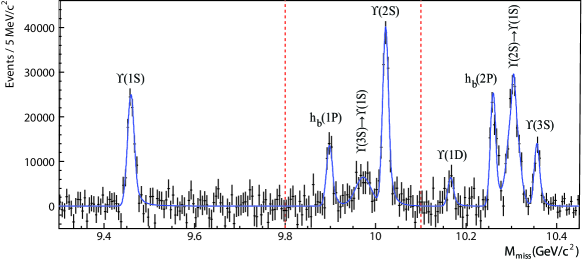
The spectrum after subtraction of both the combinatoric and contributions
is shown with the fitted signal functions overlaid in Fig. 5.
The significances of the and signals, with systematic uncertainties accounted for,
are and , respectively. The measured masses of and are and
, respectively. Using
the world average masses of the states, we determine the hyperfine splittings to be
and ,
respectively, where statistical and systematic uncertainties are combined in quadrature.
Figure 5: The inclusive spectrum with the combinatoric background and
contribution subtracted (points with errors) and signal
component of the fit function overlaid (smooth curve). The vertical
lines indicate boundaries of the fit regions.
The observation of anomalously high rates for
() and ()
transitions suggests that exotic mechanisms are contributing to decays.
Amplitude analyses of the three-body decays with are
performed by means of unbinned maximum likelihood fits to two-dimensional
vs. Dalitz distributions [10]. One-dimensional invariant mass projections for
events in the signal regions are shown in Fig. 6,
where two peaks are observed in the system near
and (named as
and ). The combined statistical significance of the two peaks exceeds
for all channels.
Figure 6:
Comparison of fit results (open histogram) with
experimental data (points with error bars) for events in the
(a) , (c) , and (e)
signal regions. The hatched histogram shows the background component.
To study the resonant substructure of the ()
decays we measure their yield as a function of the invariant
mass. The decays are reconstructed inclusively using the missing mass of
the pair, . We fit the spectra in bins of
invariant mass, defined as the missing mass of the opposite sign pion,
. We combine the spectra for the corresponding
and bins and we use half of the available range
to avoid double counting.
The results for the yield of () decays as a
function of the are shown in Fig. 7, where
the fit results are shown as solid
histograms. The two-peak structures are clear in both of them.
The default fit hypothesis is favored
over the phase-space fit hypothesis at the
[] level for the [].
Weighted averages over all five channels give
,
for the and
,
for the ,
where statistical and systematic errors are added in quadrature.
Angular analysis favors a assignment for both
states, which must also have negative -parity.
Transitions through
to the saturate the observed cross sections.
The two masses of states are just a few MeV above
the and thresholds, respectively.
The cannot be simple mesons because
they are charged and have content.
Figure 7: The (a) and (b) yields as a function of
(points with error bars) and results of the fit (histogram).
5 Summary
We reviewed here some recent results on exotic states at the Belle experiment,
including the measurement of the cross
sections of ,
, and ; the search for the ’s C-odd partner
in and modes in decays;
the evidence of in ; the observation of
, , , and two charged and states.
References
[1]
S. Uehara et al. (Belle Collaboration),
Phys. Rev. Lett. 104, 092001 (2010).
[2]
C. P. Shen et al. (Belle Collaboration),
Phys. Rev. Lett. 104, 112004 (2010).
[3] Z. Q. Liu et al. (Belle Collaboration),
Phys. Rev. Lett. 108, 232001 (2012).
[4] Using as an example, is the
cosine of the scattering polar angle of in the C.M. system; and are the cosine of the
helicity angle of in the decays and the azimuthal
angle defined in the rest frame with respect to the scattering plane; and are the
cosine of the helicity angle of normal direction to the decay
plane of the and the azimuthal angle
defined in the rest frame.
[5] N. N. Achasov and G. N. Shestakov,
Usp. Fiz. Nauk 161, 53 (1991) [Sov. Phys. Usp. 34, 471
(1991)].
[6] G. Alexander, A. Levy and U. Maor, Z. Phys. C 30, 65 (1986).
[7] N. N. Achasov, V. A. Karnakov and G. N. Shestakov, Z. Phys. C 36, 661 (1987).
[8] S. Godfrey and N. Isgur, Phys. Rev. D 32, 189 (1985);
E. Eichten et al., Phys. Rev. D 89, 162002 (2002);
E. Eichten et al., Phys. Rev. D 69, 094019 (2004).
[9] I. Adachi et al. (Belle Collaboration),
Phys. Rev. Lett. 108, 032001 (2012).
[10] A. Bondar et al. (Belle Collaboration),
Phys. Rev. Lett. 108, 122001 (2012).