Evidences of merging in the Seyfert galaxy NGC 3393 revealed by modelling the spectra
Abstract
The discovery of two active black holes in the Seyfert galaxy NGC 3393, separated by about 490 light years, revealed a merging event. This led us to look for other evidences of galaxy collision and merging through the analysis of the observed spectra in different frequency ranges. We found preshock densities higher by a factor of about 10 in the NGC 3393 NLR than in other AGN and patches of ionized matter beyond the observed NLR bulk. They can be explained by compression and heating of the gas downstream of shock waves created by collision. Metallicity in terms of the O/H relative abundance, is about 0.78 solar. Mg/H depletion by a factor of about 3 compared with solar cannot be explained by Mg trapping into dust grains, due to rather high shock velocities. The low O/H and Mg/H abundances indicate mixing with external matter during collision. Twice solar N/H is predicted by modelling the spectra of high shock velocity clouds reached by a 105 K black-body flux. This suggests that Wolf-Rayet stars could be created by galaxy collision in the central region.
keywords:
radiation mechanisms: general — shock waves — ISM: abundances — galaxies: Seyfert — galaxies: individual: NGC 33931 Introduction
The new galaxy which results from collision of galaxies or from collision of a galaxy with the ISM keeps a few records of the parent objects. The most obvious evidence is the multiple (generally double) AGN when at least two objects are involved. Yet, also the morphological and physical pictures across the product galaxy show collisional processes involving gas and dust clouds, from supersonic flows throughout the galactic medium, up to star birth and powerful starbursts, depending on the characteristics of the colliding parents. Theoretical simulation and modelling (e.g. Cox et al 2008 and references therein, Hammer et al, 2010) were confirmed by the observations of some mergers such as Arp 220, NGC 6240, NGC 7212, etc.
In Seyfert galaxies the ranges of pre- and post-shock densities and of shock velocities may show some traces of collision in some regions inside and outside the narrow line region (NLR) cone (e.g. for NGC 7212, Contini, Cracco, Ciroi 2012). An important issue is related with metallicity, which depends on mixing with external matter enclosed by merging, new relative abundances of elements ejected by starbursts, gas trapping into dust grains and matter from regions close to the AGN accompanying the outward wind (Torrey et al 2012). Sub-solar and over-solar relative abundances are both predicted.
Recently, Fabbiano et al (2011) reported the presence of two active massive black holes, separated by about 490 light years, in the Seyfert galaxy NGC 3393. They claim that the observation of two black holes very close and located deep into the bulge of a regular spiral galaxy, is important to understand AGNs in general and merging galaxies in particular.
NGC 3393 was observed by Fabbiano et al (2011) with the Chandra X-ray Observatory camera ACIS-S on 28 February 2004 (ObsID 4868 for 29.7 kiloseconds) and 12 March 2011 (ObsID 12290 for 70 kiloseconds). Two obscured AGNs appear in the central regions of NGC 3393. They are most probably powered by mass accretion. The lower limits of the black hole mass are 8. 105 M⊙ and 106 M⊙ for the NE and SW sources, respectively (Fabbiano et al. 2011). Simulation results show that the massive black hole separation and the appearance of the spiral arms created by the merger, could resemble those of NGC 3393 after about five billion years from collision (Mayer et al. 2007).
The new discovery turned NGC 3393 into an interesting target to test merging phenomena.
NGC 3393 is a close (z = 0.0125), bright (mB = 13.1; de Vaucouleurs et al. 1991) Seyfert 2, classified as an early type barred galaxy, appearing face-on. It is located in the outskirts of the Hydra cluster (de Vaucouleurs et al. 1991), covering more than an arcminute on the sky. Cooke et al (2000) derived from the redshift a scale of 180 h-1 pc arcsec-1 (h = H0/100 km s-1 Mpc-1). Cid Fernandes et al. (2004) give a linear scale of 242 pc/ arcsec.
The strong emission lines in the IUE spectrum suggested that modelling could lead to interesting results, therefore Diaz, Prieto, Wamsteker (1988) presented the integrated fluxes of optical and UV spectra providing a first hint to the physical conditions in the nuclear region. Cooke et al. (2000) explored the NGC 3393 NLR, on the basis of the characteristic HST image.
IRAS fluxes from NGC3393 (Moshir et al. 1990) yield a total IR luminosity of 1010 L⊙ and a dust mass of 5 105 M⊙ . If the IR flux is due only to star formation, a star formation rate of 4 M⊙ yr-1 on kpc scale is predicted (Veilleux 1994), corresponding to a rather low star formation efficiency. Fabbiano et al. (2011) claim on the basis of lack of young stars in the central region of the galaxy that the double black hole located deep in the bulge of the NGC 3393 AGN results from a minor merger event.
NGC 3393 is a source of a water maser which is the only resolvable tracer of warm dense molecular gas in the inner parsec (Kondratko et al 2008).
Radio emission at 13 cm taken by the Australia Telescope Compact Array, shows an outflow from the nucleus, not coincident with spiral arms or a bar (Bransford et al. 1998). The expanding radio lobes sweep up, shock, and accelerate gas into shells (Pedlar et al 1985) which are fragmented by Richtmyer–Meshkov instability due to the underlying turbulence near the shock front. Aligning the VLA radio and HST optical central sources, Cooke et al. found that the [OIII] and radio images superpose. The coincidence of radio and optical emission features indicates that shocks are at work.
Long slit spectroscopy (Whittle et al 1988) has confirmed morphological and kinematic association between the radio lobes and the line-emission gas in Seyfert galaxies. Therefore, the high excitation gas extending beyond the radio source observed by Cooke et al. (2000) in NGC 3393 will be interpreted as a record of the galaxy collision. Whichever the case, the spectra emitted by the clouds will account for both the photoionizing flux (from the AGN and from the stars) and shocks.
In this paper, we would like to investigate the role of the AGN and of prominent stars and their location in NGC 3393, and to determine the range and distribution throughout the galaxy of shock velocities and preshock densities. In particular, we would like to calculate the relative abundances to hydrogen of the heavy elements throughout the galaxy, focusing on those identified with metallicity (e.g. oxygen in the present case), because metallicity is affected by star formation and by outflows of matter, i.e. by the interactions between the forming galaxy and the intergalactic medium (Sommariva et al 2011).
We will investigate NGC 3393 by modelling the emitted spectra. Formation of shock waves is predicted in colliding systems, therefore we adopt for the calculations the code suma111http://wise-obs.tau.ac.il/marcel/suma/index.htm which simulates the physical conditions of an emitting gaseous nebula under the coupled effect of photoionization from an external source and shocks.
The observations of the line spectrum of NGC 3393 by Diaz et al (1988) and modelling results are described in Sect. 2. HST imaging and spectra, ground-based optical images, long slit spectra presented by Cooke et al (2000) are reported and interpreted in Sect. 3. The continuum spectral energy distribution (SED) calculated consistently with the line spectra is compared with the observations in Sect. 4. Discussion and concluding remarks follow in Sect. 5.
2 The combined UV-optical-IR line spectrum
Diaz et al. (1988) presented a rich spectrum of emission lines from NGC 3393, covering the 1200 and 7000 Å range. The line ratios are characteristic of a Seyfert type 2. The UV spectrum shows relatively strong lines, which will be useful to constrain the models. Diaz et al thought, at that time, that NGC 3393 was an early spiral (Sa) that most probably did not have a quasi-stellar nucleus.
Using the low-resolution mode of IUE and its large aperture (20” 10”) Diaz et al (1988) detected a strong, flat UV continuum source (Fλ = 1.7 10-15 Å-1) spectrum. Comparing the IUE flux of He II 1640 with a ground-based measure of the He II 4686 taken through a 4” 4” aperture, they deduced a very low reddening of the emission-line spectrum (E(B-V) 0.07, compared to E(B-V) = 0.06-0.09 in the Galaxy). Yet, NGC 3393 is an IRAS source, indicating the presence of warm dust (Boisson & Durret 1986).
The optical spectrum was obtained with the Image Dissector Scanner (IDS) attached to the Boller and Chivens spectrograph at the Cassegrain focus of the European Southern Observatory (ESO), La Silla, 1.5m telescope in 1981. The UV observations come from the International Ultraviolet Explorer (IUE) in low dispersion mode through large spectrograph aperture (SWP20148: 400 min, LWP 2844: 110 min and LWP 7602: 361 min).
The combined UV-optical spectrum presented by Diaz et al shows many lines that will be used to find out the physical and chemical characteristics of NGC 3393 by modelling the line ratios.
2.1 Modelling the line spectra
| line | obs | msd | mpl | mbb | mAV | mGB | FOS |
|---|---|---|---|---|---|---|---|
| Ly | 25.7 | 127. | 36. | 30.6 | 35.4 | - | - |
| NV 1252 | 1.58 | 28.9 | 1.29 | 0.04 | 1.43 | - | - |
| SiIV]+ 1403 | 0.63 | 40. | 0.87 | 0.00 | 1.7 | - | - |
| NIV 1486 | 0.26 | 8. | 0.98 | 0.02 | 0.5 | - | - |
| CIV 1550 | 4.8 | 76.8 | 3.39 | 0.13 | 4. | - | - |
| HeII 1640 | 2.7 | 1. | 4.5 | 1.88 | 2.3 | - | - |
| CIII] 1909 | 1.23 | 33.8 | 1.84 | 0.43 | 2. | - | - |
| NeIV] 2424 | 1.05 | 5.2 | 0.35 | 0.035 | 0.3 | - | 0.32 |
| MgII 2789 | 0.78 | 2.38 | 0.5 | 2.27 | 2. | - | 0.33 |
| [OII] 3727 | 1.9 | 3.3 | 1.5 | 1. | 1.2 | 1.65 | 2.15 |
| [NeIII] 3869+ | 0.7 | 2.5 | 1.7 | 1.3 | 1.42 | 1.13 | 1.2 |
| [OIII] 4363 | 0.13 | 1.53 | 0.17 | 0.06 | 0.14 | 0.10 | 0.09 |
| HeII 4686 | 0.3 | 0.074 | 0.67 | 0.28 | 0.34 | 0.29 | 0.25 |
| [NeIV] 4726 | 0.05 | 0.53 | 0.014 | 5.e-4 | 0.024 | - | - |
| [AIV] 4740 | 0.06 | 0.34 | 0.1 | 0.003 | 0.033 | - | - |
| H | 1. | 1. | 1. | 1. | 1. | 1. | 1. |
| [OIII] 5007+ | 16.88 | 16.3 | 14.24 | 13.5 | 14. | 13.6 | 13.56 |
| [FeVII] 6087 | 0.19 | 1. | 0.15 | 0.011 | 0.1 | - | - |
| [OI] 6300+ | 0.33 | 0.5 | 0.137 | 0.33 | 0.3 | 0.41 | 0.5 |
| [NII] 6584+ | 6.15 | 2.75 | 6.3 | 3.4 | 4. | 4.63 | 4.87 |
| H | 3.8 | 5. | 2.9 | 2.9 | 3. | 3.38 | 3. |
| [SII] 6717 | 0.9 | 0.11 | 0.033 | 0.37 | 0.3 | 1.89 | - |
| [SII] 6731 | 1.25 | 0.25 | 0.073 | 0.8 | 0.65 | - | |
| [AIII] 7135 | 0.4 | 0.42 | 0.7 | 0.42 | 0.47 | - | - |
| [NeII] 12.8 | - | 0.9 | 0.076 | 0.04 | - | - | - |
| [NeV] 14.3 | 42.41 | 0.3 | 0.22 | 0.014 | - | - | - |
| [NeIII] 15.5 | 95.1 | 0.33 | 1.2 | 1.67 | - | - | - |
| H absolute flux 2 | - | 3.8e-3 | 4.5 | 0.59 | 1.24 | - | - |
| () | - | 300. | 100. | 600. | - | - | - |
| () | - . | 1500. | 3000. | 300. | - | - | - |
| - | - | 2.3e12 | - | - | - | - | |
| (K) | - | - | - | 8.6e4 | - | - | - |
| - | - | - | 1. | - | - | - | |
| (cm) | - | 1.e16 | 4.9e16 | 1.e17 | - | - | - |
| str4 | - | - | 0. | 1. | - | - | - |
| RW | - | 0.886 | 0.003 | 0.111 | - | - | - |
| p[OIII] | - | 4.8 | 77.4 | 17.8 | - | - | - |
1 in 10-21 W cm-2, from Wu et al. (2011) for the non hidden BLR Sy2 sample; 2 in ;
3 in number of photons cm-2 s-1 eV-1 at the Lyman limit; 4 str indicates infalling (0) or outflow (1).
On the basis of the arguments previously mentioned, namely, 1) collision of matter originated at the galaxy encounter and collision of NLR matter with the radio outflow from the nucleus, 2) NGC 3393 contains two black holes in its active centre and 3) stars and starbursts are generally observed in mergers, we have run a grid of models which account for the coupled effect of shocks and photoionization (the primary flux) in both the cases of radiation from an active centre and radiation from the stars. A brief summary of the calculation code is given in the following (see also Contini et al 2009).
The input parameters: the shock velocity , the atomic preshock density and the preshock magnetic field define the hydrodynamical field. They are used in the resolution of the Rankine-Hugoniot equations at the shock front and downstream. These equations are combined into the compression equation which leads to the calculations of the density profile downstream. We adopt for all the models =10-4 gauss.
The input parameter that represents the radiation field is the power-law (pl) flux from the active centre in number of photons cm-2 s-1 eV-1 at the Lyman limit, if the photoionization source is an active nucleus. The spectral indices are =-1.5 and =-0.7. is combined with the ionization parameter by = (/(n c ( -1)) (( - () (Contini & Aldrovandi, 1983), where is H ionization potential and is the high energy cutoff, n the density, the spectral index, and c the speed of light.
If the radiation flux is black body radiation from the stars (bb), the input parameters are the colour temperature of the star and the ionization parameter (in number of photons per number of electrons at the nebula).
In models accounting for the shock, another important radiation source is the secondary diffuse radiation emitted from the slabs of gas heated by the shocks at relatively high temperatures.
The geometrical thickness of the emitting nebula , the dust-to-gas ratio , and the abundances of He, C, N, O, Ne, Mg, Si, S, Cl, A, and Fe relative to H are also accounted for. The distribution of the grain radius downstream is determined by sputtering, beginning with an initial radius of 1. m .
The sets of the model input parameters which best reproduce the data are regarded as results. The data contain errors both random and systematic and the calculation results depend on the uncertainties of the atomic coefficients for 12 elements in all the ionization levels. Therefore, it is generally accepted that the models would reproduce the data within a factor of two.
The calculations start at the edge of an emitting cloud which corresponds to the shock front. (see Contini et al., 2012 for a detailed description of the calculation). Our models adopt a plane-parallel geometry.
The gas is compressed and thermalized adiabatically at the shock front, reaching the maximum temperature in the immediate post-shock region downstream : ( km s-1. The downstream region is cut into a maximum of 300 plane-parallel slabs with different geometrical widths, which are calculated automatically, in order to follow smoothly the temperature gradient.
Each line intensity calculated in each slab downstream depends on the electron density, the electron temperature, and the fractional abundance of the corresponding ion. The density of the gas is calculated by the compression equation. The fractional abundances of the ions is calculated resolving the ionization equations accounting for the primary flux (the photoionization), the secondary flux and collisional ionization. Both the flux from the active centre and from the stars as well as the secondary radiation are calculated by radiation transfer throughout the slabs downstream.
The ionization equations are coupled with the energy equation for the calculation of the temperature in each slab. T decreases downstream following the cooling rate by free-free, free-bound and line emission, which are calculated in each slab. The line fluxes and dust reprocessed radiation are integrated throughout the geometrical thickness of the cloud downstream.
We have calculated a large grid of models changing the input parameters in a consistent way, namely by considering the effect of each of them on the different line ratios, until a fine tuning of all the line ratios to the data is obtained. The calculated spectrum is finally selected comparing the calculated with the observed line ratios in the optical range and constraining the precision of the fit by discrepancies which are set at 20 % for the strongest lines (e.g. Ly , [OIII]5007+) and 50% for the weakest ones.
2.2 Comparison of models with the observations
We start by modelling the observations of Diaz et al because many lines are given in a large frequency range. The observed spectra are presented in Table 1. In the top of the table the UV-optical line ratios to H are shown, in the middle we report the [NeV] 14.3 and [NeIII] 15.6 IR line absolute fluxes observed at Earth by Wu et al (2011). Notice, however, that in Table 1 the calculated line ratios are referred to H =1, while the observed IR spectral lines are absolute fluxes, so we will constrain the models by the [NeV]/[NeIII] line ratios, to avoid problems of distance, obscuration, etc. In the bottom of Table 1 the models are described by the set of the input parameters.
Before discussing the results, we would like to recall that in our models the shocks are present also in radiation dominated clouds. Moreover, we will account for the flux from the stars, even if Diaz et al. claim that the UV emission comes from the nuclear region only and that NGC 3393 spectral type is late enough as to yield a negligible stellar contribution in the UV.
Three grids of models were computed adopting power-law photoionization + shock (mpl), black-body photoionization + shock (mbb) and shock dominated (msd) clouds. The models which best fit the data, are presented in Table 1.
The method adopted for modelling proceeds in two main steps.
2.2.1 The physical parameters
First, we determine the physical conditions of the gas, adopting the most plausible relative abundances.
We start by calculating the line ratios of oxygen from different ionization levels, [OIII]5007+/H , [OII]3727+/H and [OI]6300+/H (the + indicates that the doublet is summed up), which depend on the fractional abundance of the ions and on and , and the [OIII] 5007+ /[OIII]4363 line ratio which depends strongly on and . In fact, various oxygen lines are generally observed in the optical range, and [OIII] 5007+ lines are the strongest in Seyfert 2 galaxy spectra.
We try to reproduce the data by changing the input parameters, in particular, , , and , considering that n/ ranges between a minimum of 4 (the adiabatic jump) and 100, depending on and , the temperature of the gas depends on the shock velocity, and the photoionization flux heats the gas to 2-3 104K and ionizes the gas.
However, the model cannot be definitive until a satisfactory fit is found also for HeII/H and for CIV/CIII] in the UV. Both the He and H lines depend directly on the radiation flux from the active center (AC)(primary radiation) in radiation dominated models, while they depend on secondary diffuse radiation in collisionally dominated regimes.
The consistent fit of the O, He, and C line ratios is complicated by the fact that, changing one of the input parameters affects the cooling rate downstream. Consequently, the stratification of the ions changes and the lines must be recalculated by a different set of input parameters.
The nitrogen lines NV 1252, NIV] 1486 in the UV and the doublet [NII] 6548+6584 in the optical range are also important to constrain the models. However, we do not know which of the lines of the NIV] multiplet is observed, so we will refer to the sum of all the terms as an upper limit. NV/[NII] depends on the reddening correction. In case of relatively large FWHM of the line profiles, [NII] lines are blended with H , increasing their uncertainty. The models which give an acceptable approximation to the data were run with N/H twice solar.
2.2.2 The relative abundances
The second step of our modelling method consists in completing the fit of all the line ratios by changing the relative abundance of elements which appear in the spectrum by a single line. Generally, these elements are not strong coolants, namely, the corresponding lines are not strong enough to affect the cooling rate downstream.
Lines such as MgII and [FeVII] are the unique representative of the respective elements, therefore they are modelled on the basis of their relative abundance, after the physical conditions of the emitting gas have been determined by the line ratios previously mentioned (Sect. 2.2.1).
The [SII]6717 / [SII] 6731 line ratio depends particularly on the density of the emitting gas. The [SII]/H line ratios depend on the geometrical thickness of the emitting cloud, which is mainly determined by [OI]/H . So the calculated [SII]/H can be adjusted to the observed ones by changing the S/H relative abundance.
| line | obs | corr | mAV |
|---|---|---|---|
| Ly 1215.7 | 374 | 440 | 885. |
| N V 1238.8 | 18 | 20 | 35.7 |
| N V 1242.8 | 9 | 10 | |
| O I 1303 | 8 | - | |
| C II 1335 | - | ||
| Si IV 1397 | 42.5 | ||
| O IV] 1402 | 18 | 18 | |
| N IV] 1486 | 12.5 | ||
| C IV 1548.2 | 64 | 64 | 100. |
| C IV 1550.8 | 36 | 36 | |
| C IV … | 100 | 100 | 100 |
| ? 1593.0 | 9 | 9 | - |
| He II 1640.7 | 38 | 37 | 57.5 |
| O III] 1663 | - | ||
| N III] 1750 | - | ||
| Si III] 1892.0 | - | ||
| C III] 1908.7 | 34 | 34 | 50. |
2.3 Results
2.3.1 AGN, star and shock dominated clouds
Model mpl was calculated considering that the power-law radiation from the AGN reaches the shock front. In the opposite case, the radiation flux from the AC reaches the cloud edge opposite to the shock front. This case has been checked and has been dropped because many lines were unfitting, in particular [OI]/H 1.5. This result suggests that in NGC 3393 the NLR gas falls toward the black hole(s).
The absolute fluxes of [NeIII] and [NeV] observed by Wu et al (Table 1) can be used to calculate the distance of the emitting gas from the galaxy centre r. Combining the observed flux at Earth with the flux calculated at the nebula for [NeIII] which is a relatively strong line: d2= r2, where is the filling factor, d the distance of NGC 3393 from Earth (d=54 Mpc, adopting Ho=70 km/Mpc) and = [NeIII]/H H (absolute flux), r results 23/ pc for clouds reached by the AGN radiation.
Table 1 shows that the most acceptable approximation to the observed spectrum is obtained by model mpl. However, the [SII]/H line ratios are very low compared to observations and the HeII/H line ratio too high, indicating that the flux from the AC required to fit the [OIII[/H line ratio is too high. Reducing the flux intensity, however, it will spoil the fit of the oxygen lines from three ionization levels. We check whether the contributions of a shock dominated model msd, representing clouds screened from radiation or too far to be reached, and of a model mbb accounting for radiation from the stars, could help.
The mbb and the msd models were selected from grids with the same criteria as those used to select mpl.
The best fitting mbb model refers to the case representing matter propagating outwards from the stars. The opposite case was dropped due to unacceptable [OI]/H (=0.02) relative to the other oxygen line ratios, and very low [SII]/H . Stars can drive large-scale winds ejecting circumstellar gas. The winds and radiation fluxes from the stars enrich and heat the neighbourhood medium, respectively.
The effective temperature of the stars which leads to an acceptable fit of the calculated to the observed optical spectrum of NGC 3393 (Table 1) is rather high, 105 K. Recall that Wolf-Rayet (WR) stars can reach much hotter temperatures than main sequence stars. A 140,000 K WC star can yield [NeIII]15.6/[NeII] 12.8 10. Similarly, a 120,000 K WN star can reach [NeIII]/[NeII] = 100 (Rigby & Rieke 2004). Unfortunately, we do not have the datum of the [NII] 12.8 line (Table 1) to constrain the models. We will see in the next section that these WR stars, ionizing and heating the surrounding gas which is characterised by relatively high , nicely explain both the [OIII]/H line ratio () and the high FWHM observed in the centre of the NGC 3393 galaxy (Fig. 2).
Cid Fernandes et al (2004, table 2) refer to star formation in Seyfert 2. They present model synthesis results which show the percentage in flux at 4020 Å of the featureless continuum, young, intermediate and old stellar populations. They find for NGC 3393 a percentage of 83% for old stars and of 4 % for young stars, in spite of Gu et al. (2006) claim that, in general, the Seyfert 2 nuclear emission luminosity is mainly due to young stars and that central starbursts are found in merger Seyfert galaxies (e.g. NGC 6240).
2.3.2 Densities and velocities of the emitting gas
The pre-shock densities relative to model mbb are similar to those found throughout other starburst galaxies (100-800 , Viegas et al. 1999). On the other hand, the model representing the AGN, and that representing shock dominated clouds, show pre-shock densities higher by a factor 10 than in the NLR of AGN (300-1000 , Contini et al 2004 and references therein) and in LINERs (100- 600 , Contini 1997, table 3). This yields downstream densities of 104-105 after compression, depending on and . We suggest that the high densities adopted in models mpl and msd could be a record of merging.
The velocities throughout the NGC 3393 NLR (Cooke et al. 2000, fig.8) are relatively low ( 100 ) similar to those found in the clouds in the ”region of quiescent regime” (Tadhunter et al. 2000) in the NLR cone of the Seyfert galaxy NGC 7212, most likely a merger, and similar to the shock velocities found close to the Galactic centre (Contini & Goldman 2011) most likely a low luminosity AGN (Contini 2011). Higher velocities are found close to the NGC 3393 NLR centre between -20” and 20” (Cooke et al. 2000, fig.8).
2.3.3 Metallicities
In agreement with previous works on NGC 3393 (Diaz et al., Cooke et al.), we find that Mg/H relative abundance should be about one third of the solar value in the shock dominated and starburst gas, while in the clouds close to the AGN Mg/H is about solar. Solar relative abundances from Allen (1976) are : C/H=3.3 10-4, N/H=9.1 10-5, O/H=6.6 10-4, Ne/H=10-4, Mg/H=2.6 10-5, Si/H=3.3 10-5, S/H=1.6 10-5, Cl/H=4. 10-7, Fe/H=3.2 10-5. Generally, Mg is included into silicate grains, however at shock velocities higher than 200 the grains are destroyed by sputtering. Table 1 shows that the models which overpredict the MgII/H line ratio are msd and mbb, both calculated by 200 . Therefore, the Mg depletion could be due to mixing with external matter during the merger process. The same is valid for Si.
The models were calculated adopting N/H twice solar and C/H =0.7 solar, while the other relative abundances were solar. However, the [SII]/H line ratios depend on the models which are matter bound. We generally choose the geometrically thickness of the clouds on the basis of [OI]/H . The larger the cloud, the higher both the [SII]/H and [OI]/H line ratios, because the first ionization potential of sulphur (10.36 eV) is much lower than that of oxygen (13.61 eV).
In Table 2 we compare the UV lines calculated by the mAV average model (Sect. 2.3.4) with the FOS blue observations presented by Cooke et al (2000, table 9). The observed line ratios to CIV =100 are all overpredicted by the model by factors 2. The carbon lines in Table 1 were well reproduced adopting C/H =0.7 solar. Table 2 shows that a solar abundance should be adopted for C/H and that most probably the reddening correction adopted by Diaz et al. was slightly misleading.
2.3.4 The average spectrum
Table 1 shows that the shock dominated model, although fitting the [OIII] : [OII] : [OI] ratios and their ratios to H , as well as the CIV CIII] requirement, overpredicts most of the UV lines by a large factor. On the other hand, the model mbb selected in particular by the agreement of He/H line ratios, underpredicts the UV lines (except the Ly /H line ratio), compensating the results of model msd . Therefore, the spectra accounting for the different radiation sources were summed up with relative weights (RW) (which appear in the row before the last in Table 1). The average model mAV is shown in Table 1 (col. 6) and is compared with Diaz et al observation data (col. 2), the ground based observations (col. 7) and FOS Red Detector observations (col. 8) reported by Cooke et al. (2000, table 7 and table 8, respectively). In the last column of Table 1 a fit to the ground-based low-resolution spectra, coadded over a 8” 8” region centered on the nucleus (Cooke et al 2000), are given for comparison. FOS spectra are also included in the table.
The high RW of the shock dominated model compensates the very small absolute flux of the calculated lines, (that can be calculated by the H absolute flux). The RW were selected by the best fit of mAV to the data. The criteria are the same as those adopted to select models mpl, mbb and mbb (discrepancies 20 % for strong lines and 50 % for weaker lines), but considering the total combined UV-optical spectrum.
In the last row of Table 1 the resulting percentage of the absolute [OIII] 5007+ line for the three models is given, 4.8 % for shock dominated clouds, 77.4 % for the AGN photoionizad clouds and 17.8 % for those illuminated by the stars. The AGN contribution dominates, however both the shock and star dominated models are not negligible because they improve the fit to the data.
3 The physical conditions throughout the galaxy
| log | type | symbol | ||||
| () | () | - | (104K) | (cm) | - | - |
| 100 | 3000 | 12.36 | - | 2.9e16-3.9e16-4.9e16-5.9e16-7.9e16-1.e17 | pl | dashed blue |
| 100 | 3000 | 11.3 | - | 1.e15-2.6e15-3.e15-4.2e15-1.26e16-2.26e16 | pl | dot-dashed blue |
| 100 | 2000 | 9.7 | - | 6.e13-1.4e14-2.4e14-2.9e15 | pl | solid cyan |
| 300 | 2000 | 11. | - | 4.3e14-4.5e14-5.e14-1.1e15-2.5e15 | pl | solid blue |
| 400 | 2000 | 11. | - | 5.48e14-5.5e14-5.6e14-5.9e14-6.9e14 | pl | solid green |
| 400 | 2000 | 11.77 | - | 5.8e14-7.e14-1.8e15-4.28e15-1.17e16 | pl | dashed green |
| 600 | 300 | =1. | 2.6-3.6-4.6-5.6-8.6 | 1.e16 | sb | solid magenta |
| 100 | 1000 | =0.4 | 3.0-4.0-5.0 | 1.e16 | sb | dashed magenta |
| 100 | 1000 | =0.5 | 2.6 -3.0-4.0-5.0 | 1.e16 | sb | dot-dashed magenta |
| 100-200-300-400-500 | 1000 | - | - | sd | dot-dashed red | |
| 100-200-300-400-500 | 100 | - | - | sd | dashed red | |
| 100-200-300-400-500 | 1500 | - | - | sd | solid red |
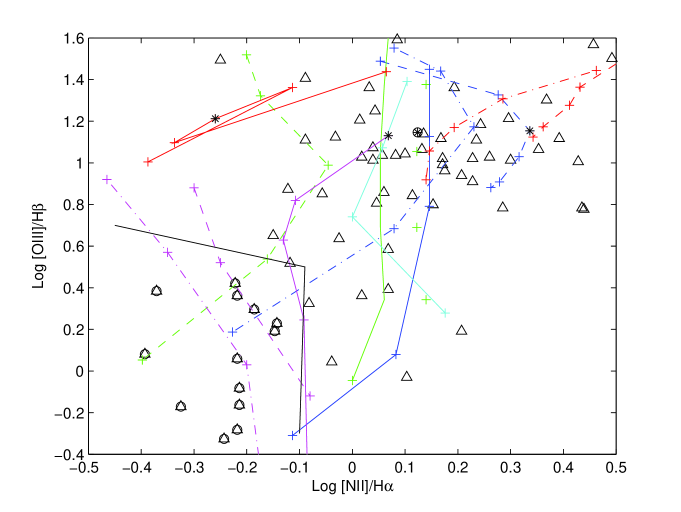
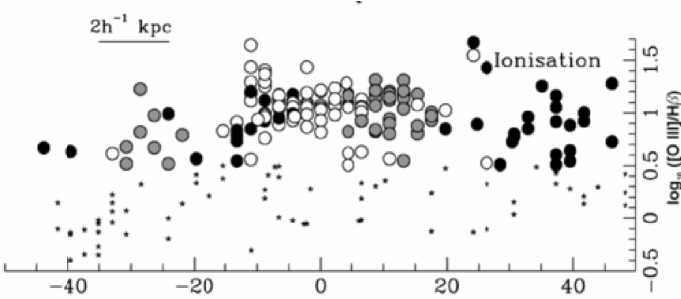
To obtain some information about the distribution of the physical conditions throughout the NLR, we present in Fig. 1 the modelling of the spectra reported in the different regions of NGC 3393 by Cooke et al. (2000, fig. 5). The lines are the most significant ([OIII], H , H and [NII]), but they are too few to constrain the models. Nevertheless, we have tried to build up a grid on the basis of the models which were used to fit the spectrum observed by Diaz et al. (Table 1). The input parameters of the models are described in Table 3. In Fig. 1 we show the results selected from the grid. They reproduce the observed [OIII]/H and [NII]/H line ratios, corresponding to different physical situations. The models however, are not constrained by the other line ratios (see Table 1). If these lines were observed in the different regions of NGC 3393 NLR, some models would disappear from Fig. 1. However, Table 3 shows that the input parameters included in the grid, change smoothly throughout ranges that are consistent with the Seyfert 2 NLR physical conditions. avoiding unsuitable large jumps.
3.1 Calculation results
Notice that for certain strong line ratios, e.g. [OIII]/H , a high flux from the AC and a high shock velocity can give similar results, while the other spectral lines change, so the results are shifted in different positions through Fig 1. The same may occur for star dominated and AGN dominated models calculated with different geometrical thickness.
We adopted N/H twice solar, on the basis of the modelling of the average spectrum. Fig. 1 shows that calculating the models by N/H between 1 and 2 solar, we could reproduce all the Cooke et al (2000, fig. 5) data.
The observations cover the NLR throughout the galaxy. In this regions the FWHM of the line profiles show different velocities from 100 to 400 (Fig. 2). Shocks are created by the underlying turbulence, which may originate from collision and merging of galaxies, leading to fragmentation of matter. Therefore, the models are calculated by different geometrical thickness.
The power-law dominated models are matter bound. We have calculated the line ratios at different distances from the shock front in each cloud (Table 3), mimicking fragmentation. The results are indicated in Fig. 1 by the + over the curves at the distances () reported in Table 3. Lower correspond to higher [OIII]/H .
High velocity models ( 300-400 ) with a flux log() 12 and different geometrical thickness reproduce most of the cloud spectra (solid blue and green lines). Low velocity ( 100 ) power-law flux dominated models (blue dashed and dot-dashed lines) reproduce the spectra showing both high [OIII]/H and high [NII]/H line ratios.
Shock dominated models were calculated for the different indicated by + over the curves. The values are given in Table 3. Higher correspond to lower [OIII]/H . Characteristic of shock dominated models are the relatively high [NII]/[OIII] line ratios (red dashed and dot-dashed lines), but at high 1500 (red solid lines) the [NII]/H line ratios decreases due to the relatively low critical density for collisional deexcitation of [NII].
The star radiation dominated models were calculated at different effective star temperatures (Table 3) which are indicated by + over the curves. The higher the higher [OIII]/H . The black-body flux calculated by a high ( 8.6 104 K) (magenta solid line) contributes to reproduce the spectrum observed by Diaz et al (Table 1). At relatively low ( 5 104 K) the model results follow the line separating the AGN from the HII regions. The line ratios from the HII regions (Cooke et al. 2000, fig 5, open circles) are well fitted by the star dominated model calculated by a black body flux corresponding to 5. 104 K. The ionization parameter which better fits the spectrum observed by Diaz et al is =1, but lower (0.4-0.5) characterize the spectra from the HII regions (magenta dot-dashed and dashed lines, respectively).
3.2 Interpretation of the data
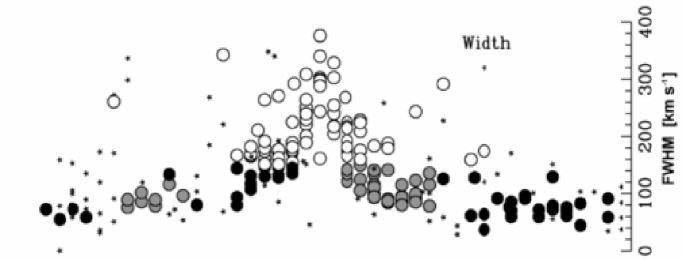
We refer to Fig. 2. The modelling is constrained only by the FWHM of the line profiles and the [OIII]/H line ratios. We consider that the FWHM indicate roughly the shock velocity in the observed position.
Schematically, we distinguish four types of clouds : 1) high [OIII]/H , high ; 2) high [OIII]/H , intermediate ; 3) high [OIII]/H , low ; 4) low [OIII]/H , low . High [OIII]/H are close to 10 and the low ones are close to 1. High are 400 , intermediate are 100 400 , low are 100 .
In particular, the velocities as well as the [OIII]/H flux peak at the centre of the NLR, within -0.5 and 0.5 arcsec. Our models (Fig. 1) show that the emitting gas is ionized by the power-law flux from the AGN (log() 11- 12). Relatively strong shocks are at work, characterizing the velocity field ( =400 ) and yielding fragmentation of the clouds which is revealed by their low geometrical thickness . The emission line fluxes from the clouds illuminated by stars with 8.6 104 K are blended with those photoionised by the AGN power-law flux. Eventually, also shock dominated clouds contribute.
The top panel of Fig. 2 shows that high and low velocities coexist at slightly larger radii from the centre, while log ([OIII]/H ) are rather constant at two values : 1 and 0. - 0.5 (bottom panel). The lowest ratios are better explained by the black-body photoionization in HII regions, while the highest ones are reproduced by both power-law radiation dominated and shock dominated clouds corresponding to different . Notice that the AGN dominated model explains the =100 clouds with high ionization throughout most of the NLR from East to West.
The FWHM picture is hardly symmetric, even close to the centre, due to clouds corresponding to higher on the East. At about -10” the ionization jumps to high values (Fig. 2 bottom panel), which can be explained by shock dominated clouds with rather low velocities ( 100 ) and the stars correspond to the low ionization gas (small asterisks). Particularly, at -30” some highly ionised clouds with 100 indicate shocks outside the NLR bulk. We interpret them as a collision record. On the West (Fig. 2), the shock dominated clouds are less evident but cannot be excluded.
4 The continuum SED
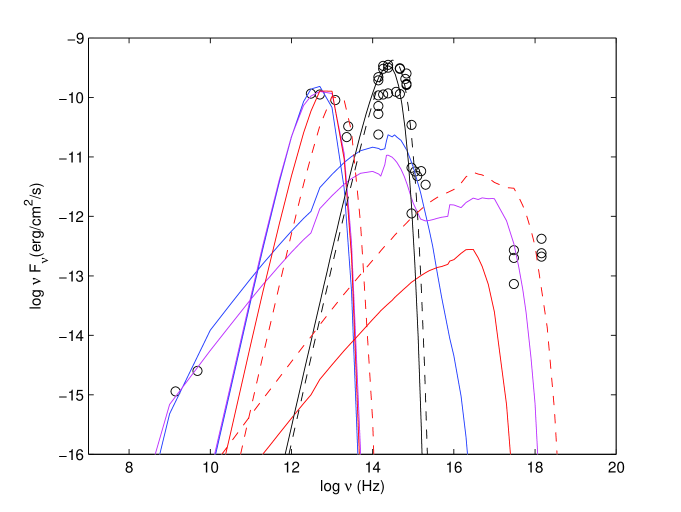
The SED of the NGC 3393 continuum is shown in Fig. 3. The data come from the NED (Levenson et al. 2006; Kinney et al 1993; Munoz Marin et al. 2007 ; Lauberts & Valentijn 1989; De Vaucouleurs et al 1991; Doyle et al. 2005; Peng et al. 2006; Moshir et al. 1990, Gandhi et al. 2009; Griffith et al. 1994; Condon et al. 1998).
We try to reproduce the data by the same models as those which lead to the fitting of the combined optical-UV spectrum presented by Diaz et al. (1988). Two lines correspond to each model, one representing the bremsstrahlung emitted from the gas and the other showing the dust reprocessed radiation flux. Recall that the dust reradiation peak shifts at higher frequencies the higher the shock velocity, because dust grains are heated collisionally by the gas and radiatively by the power-law or black-body flux. Collisional heating prevails at relatively high shock velocities. Also the maximum frequency of the bremsstrahlung increases with the shock velocity (Contini, Viegas, Prieto 2004).
Therefore we present in Fig. 3 the bremsstrahlung calculated by model mbb which was calculated by =600 . The calculation results give a good fit to the observed soft X-ray data. Model mpl calculated by photoionization from the AGN and a relatively low velocity, =100 , reproduces the data in the near UV.
The data in the radio frequency range are few but enough to show that the flux is a bremsstrahlung with some self-absorption of free-free radiation. The bremsstrahlung are emitted by the same power-law and star black-body dominated models which fit the flux in the near-IR and in the soft X-ray ranges, respectively. The radio emission is optically thick to free-free absorption in luminous infrared galaxies (Condon et al 1991), in agreement with model calculations. Actually, radio synchrotron radiation by the Fermi mechanism at the shock front is not observed in NGC 3393.
Fig. 3 shows that the IR data are well reproduced by the sum of the reprocessed radiation fluxes calculated by mbb and mpl models which appear in Table 1. The IR peak corresponds to a relatively low dust-to-gas ratio ( 10-4 by mass).
The peak in the optical-UV range is due to the old background star population. The data are nested inside the black body curves corresponding to star temperatures between 3 and 4 103 K. The young hot stars predicted by model calculations have a temperature of 8.6 104 K. The corresponding black body flux peaks in the UV frequency range. However, below the Lyman limit, up to 0.2 keV, we have very little observational information; the observations are difficult because of the heavy absorption by our Galaxy (Fig. 3).
Our results agree with Levenson et al. (2006) who fitted the NGC 3393 nuclear and central spectra by models which account for gas heated at a temperature of 3.9 105 K. Such a temperature can be found downstream of a shock with 160 . Moreover Levenson et al report that most of the soft X-ray emission ( 60 %) is spread (as well as the optical one) throughout an area of 1700pc 770 pc. Actually, the consistent modelling of the line and continuum spectra presented in the previous sections indicates that shocks are present throughout the whole NLR with velocities between 100 and 600 .
Levenson et al claim that most of the hard X-rays are emitted as reflection continuum emission from the obscured AGN. Although broad FWHM line profiles were not observed in the optical-near IR spectra observed up to now, nevertheless, Fig. 3 shows that bremsstrahlung emitted downstream of shocks corresponding to at least = 1000 might contribute to the hard X-rays emission. Moreover, the near-IR reradiation by dust calculated by such a high , would complete the fit of the IR data in NGC 3393.
5 Discussion and concluding remarks
Modelling the spectra in the previous sections we have obtained the physical and chemical conditions throughout the NLR of the NGC 3393 Seyfert galaxy. In this paper we searched for some evidence of merging within this galaxy, following the results of the observations in the X-ray presented by Fabbiano et al (2011). They found that two black holes coexist in the centre of the galaxy.
The collision of two galaxies suggests immediately that shock waves will result leading in general to star formation in the centre (Cox et al. 2008) and throughout the galaxy.
Therefore our models account for gas+dust clouds ionized and heated by the power-law flux from the active centre(s), by stars and by the shock.
We have found that the power-law radiation flux from the AGN largely dominates the spectral emission from the gas clouds throughout the galaxy. The flux ranges between 1011 and 3 1012 in number of photons cm-2 s-1 eV-1 at the Lyman limit, which is characteristic of the NLR of AGN. Due to their small distance, we treat the two black holes as the unique source of power-law radiation flux.
The preshock densities are unusually high, by a factor of 10 higher than in the NLR of Seyfert galaxies. Higher densities can reveal that a shock front has crossed the colliding region compressing the gas throughout the galaxy. The shock wave was most probably the result of different densities on large scales in the colliding galaxy gas.
We have searched for the distribution of the shock fronts and their strength throughout the galaxy and in the surrounding medium. By modelling the spectra in the optical-UV range, we have found that shock velocities range between 100 and 600 . The velocities peak in the central region of NGC 3393 (Fig. 2). The merging of the disc matter could occur through fragmentation of dust and gas clouds, typical result of turbulence at the shock front. Indeed fragmentation is predicted by modelling the emitting cloud spectra which shows various and small geometrical thickness.
Downstream of the shock fronts the gas is compressed and heated to temperatures which depend on the shock velocity. The spread of shock fronts throughout the NLR agrees with Levenson et al (2006) who claim that NGC 3393 is characterised by extranuclear soft X-ray emission.
A galaxy collision evidence in NGC 7212 was provided by the observations (Cracco et al 2011) of high [OIII]/H line ratios and relatively large [OIII] FWHM profiles outside the NLR cone edges. A similar case is found in NGC 3393. Cooke et al. (2000, fig. 8) show a region to the NE, separated from the core, which they identified with the bright patch of [OIII] emission line at 20”E, 20, 20”N of the nucleus. They claimed it could be some kind of bow shock. We suggest that these patches could be the record of a collisional event.
Our results show that stars are present in NGC 3393 with a series of temperatures, from 3 104 to 8.6 104 K. Those corresponding to the highest temperature ( =8.6 104 K) are explained by Wolf-Rayet stars. The clouds in the neighbourhood of the high stars have pre-shock densities of 300 , shock velocities 600 and the ionized matter is highly fragmented. Fig. 2 shows that they are most probably located close to the galaxy centre, whereas the oldest stars accompanied by relatively low velocities (100 ) are located throughout the NLR.
The results of Cox et al (2008) analysis of the starbursts that result from tidal forces in mergers, indicate that galaxies with similar mass produce the most intense bursts of star formation, while mergers of galaxies with different mass are not expected to give birth to new stars. A starburst generally appears in the centre of merging Seyfert galaxy, between the black holes (e.g. in NGC 6240). Starbursts are not predicted in NGC 3393 by the population model analysis of Cid Fernandes et al (2004) who evaluated a 4% fraction of young stars and 83% of old stars. However, we have found that high velocity clouds illuminated by the young hot stars contribute by 17.8% to the [OIII] 5007+ line flux compared to low velocity clouds ionised by the AGN which contribute by 80 % in the NLR. The high velocity gas surrounding the hot stars provides a relatively large fraction of the central X-ray flux. The relative fraction of the young hot stars cannot be easily evaluated because the continuum SED of NGC 3393 shows that the black body flux corresponding to T=8.6 104 K peaks in the UV frequency range where absorption by our Galaxy is very strong (Fig. 3).
Wolf-Rayet stars of type N are characteristic of strong winds spreading nitrogen rich gas in the NLR. In fact, Table 1 indicates that the emitting nitrogen-rich gas exhibits the highest velocities. Our modelling shows that besides matter ejected from the stars, also the shock dominated clouds with =300 would better fit the [NII]/H data adopting N/H relative abundance at least twice solar. These clouds are most probably screened from the star radiation flux by dusty clumps or/and are too far to be reached by the photoionizing flux.
The metallicity of the wind is the same as the metallicity of gas in the star-forming region from which the wind emerges (Torrey et al 2011). Nitrogen rich NGC 3393 results from the competition between included low-metallicity gas and enrichment from star formation. Yet metallicity is generally related with the oxygen abundance. In previous sections we have found solar O/H relative abundances adopting Allen (1976) values (O/H= 6.6 10-4) in the calculation of the spectra. The solar abundances presented by Anders & Grevesse (1989) and Feldman (1992) give O/H=8.51 10-4, reducing the metallicity in NGC 3393 to 0.78 solar. We found also depletion of Mg by a factor of 3, compared to solar. Mg cannot be trapped into dust grains which are sputtered throughout the strong shocks.
We suggest that the low O/H and Mg/H relative abundances show mixing with external matter as a result of merging. The high N/H is an ”indirect” evidence of merging, because it is a product of the central stars which, in turn, are created by the collision of near-equal mass galaxies.
In conclusion, by modelling the spectra of NGC 3393 we have found some evidence of galaxy collision and merging. Our results obtained by consistent calculations are valid, but not definitive due to scarcity of data.
Aknowledgements
I am grateful to the referee for enlightening questions which improved the presentation of the paper. I thank Hagai Netzer for allowing to reproduce Cooke et al (2000, fig. 8). This research has made use of the NASA Astrophysics Data System (ADS) and the NED, which is operated by the Jet Propulsion Laboratory, California Institute of Technology, under contract with NASA.
References
Allen C. W., 1976, Astrophysical Quantities, London: Athlone (3rd edition)
Anders E., Grevesse N. 1989, Geochimica et Cosmochimica Acta, 53, 197
Boisson, C, Durret, F. 1986, ESASP, 263, 687
Bransford, M. A.; Appleton, P. N.; Heisler, C. A.; Norris, R. P.; Marston, A. P. 1998, ApJ, 497, 133
Cid Fernandes, R.; Gu, Q.; Melnick, J.; Terlevich, E.; Terlevich, R.; Kunth, D.; Rodrigues Lacerda, R.; Joguet, B. 2004, MNRAS, 355, 273
Condon, J. J.; Cotton, W. D.; Greisen, E. W.; Yin, Q. F.; Perley, R. A.; Taylor, G. B.; Broderick, J. J. 1998, AJ, 115,1693
Contini, M., Cracco, V. Ciroi, S. 2012, submitted
Contini, M. 2011, MNRAS, 418, 1935
Contini, M. 2009, MNRAS, 399, 1175
Contini, M. 1997, A&A, 323, 71
Contini, M.. Aldrovandi, S.M.V., 1983, A&A, 127, 15
Contini, M., Goldman, I. 2011, MNRAS, 411, 792
Contini, M., Viegas, S.M., Prieto, M.A. 2004, MNRAS, 348, 1065
Cooke, A.J., Baldwin, J.A., Ferland, G.J., Netzer, H., Wilson, A.S. 2000, ApJS, 129, 517
Cox, T. J.; Dutta, S. N.; Di Matteo, T.; Hernquist, L.; Hopkins, P. F.; Robertson, B.; Springel, V. 2006, ApJ, 650, 791
Cox, T.J., Jonsson, P., Somerville, R.S., Primack, J. R., Dekel, A., 2008, MNRAS, 384, 386
Cox, T.J., Dutta, S. N., Hopkins, P.F., Hernquist, L. Panoramic Views of Galaxy Formation and Evolution ASP Conference Series, Vol. 399, c 2008 T. Kodama, T. Yamada, and K. Aoki, eds.
Cracco, V. et al. 2011 MNRAS, 418, 263
de Vaucouleurs, G., de Vaucouleurs, A., Corwin JR., H.G., Buta, R. J. Paturel, G., and Fouque, P. 1991 Third Reference Catalogue of Bright Galaxies (New York:Springer)
Diaz,A.I., Prieto, M.A., Wamsteker, W. 1988, A&A,195, 53
Doyle, M. T.; Drinkwater, M. J.; Rohde, D. J. 2005, MNRAS, 361,34
Duc, P.A., Renaud, F. 2011, ArXiv:1112.1922
Fabbiano, G., Wang, J., Elvis, M., Risaliti, G. 2011, Natur, 477, 431
Feldman, U. 1992, Physica Scripta, 46, 202
Griffith, M. R.; Wright, A. E.; Burke, B. F.; Ekers, R. D. 1994, ApJS, 90, 179
Gu, Q.; Melnick, J.; Cid Fernandes, R.; Kunth, D.; Terlevich, E.; Terlevich, R. 2006, MNRAS, 366, 480
Hammer, F., Yang, Y.B., Wang, J.L., Puech, M., Flores, H., Fouquet, S. 2010, ApJ, 725, 542
Hopkins, P. F.; Somerville, R. S.; Hernquist, L; Cox, T. J.; Robertson, B; Li, Y. 2006, ApJ, 652, 864
Kewley, L. J.; Geller, M. J.; Barton, E. J. 2006, AJ, 131, 2004
Kinney, A. L.; Bohlin, R. C.; Calzetti, D.; Panagia, N.; Wyse, Rosemary F. G. 1993, ApJS, 86, 5
Lauberts, A. and Valentijn, E. A. 1989 The surface photometry catalogue of the ESO-Uppsala Galaxies, Garching Bei Munchen: European Southern Observatory
Levenson, N. A.; Heckman, T. M.; Krolik, J. H.; Weaver, K. A.; Zycki, P. T. 2006, ApJ, 648, 111
Mayer, L. et al. 2007, Science 316, 1874
Moshir, M. et al. 1990 in Faint Source catalogue, version 2.0(JPLD-10015 8/92; Pasadena: Jet Propulsion Laboratory)
Muñoz Marìn, V. M.; Gonzàlez Delgado, R. M.; Schmitt, H. R.; Cid Fernandes, R.; Pèrez, E.; Storchi-Bergmann, T.; Heckman, T.; Leitherer, C. 2007, AJ, 134, 648
Pedlar, A.; Unger, S. W.; Dyson, J. E. 1985, MNRAS, 214, 463
Peng, Z.; Gu, Q.; Melnick, J.; Zhao, Y. 2006, A&A, 453, 863
Rigby, J.R., Rieke, G.H. 2004, ApJ, 606, 237
Shir, M. et al. 1990, Infrared Astronomical Satellite Catalogs, The Faint Source Catalogue, version 2.0 1990
Sommariva, V. et al. 2012, ArXiv:1112.2403
Springel, V.; Di Matteo, T.; Hernquist, L. 2005, MNRAS, 361, 776
Tadhunter, C. N.; Villar-Martin, M.; Morganti, R.; Bland-Hawthorn, J.; Axon, D. 2000, MNRAS, 314, 849
Torrey, P., Cox, T. J., Kewley, L., Hernquist, L. 2012, ApJ, 746, 108
Two Micron all Sky Survey Team 2Mass Extended Objects. 2003 final release
Veilleux, S.; Cecil, G.; Bland-Hawthorn, J.; Tully, R. B.; Filippenko, A. V.; Sargent, W. L. W. 1994, ApJ, 433, 48
Viegas, S.M., Contini, M., Contini, T. 1999, A&A, 347, 112
Whittle et al. 1988 ApJ, 326, 125
Wu, Y.-Z., Zhao, Y.-H., Meng, X.-M. 2011, ApJS, 195, 17