Characterisation and calibration of a scintillating fibre detector with 4 000 multi-anode photomultiplier channels
Abstract
In the Kaos spectrometer at the Mainz Microtron a high-resolution coordinate detector for high-energy particles is operated. It consists of scintillating fibres with diameters of 1 mm and is read out by 4 000 multi-anode photomultiplier channels. It is one of the most modern focal-plane detectors for magnetic spectrometers world-wide.
To correct variations in the detection efficiency, caused by the different gains and the different optical transmittances, a fully automated off-line calibration procedure has been developed. The process includes the positioning of a radioisotope source alongside the detector plane and the automated acquisition and analysis of the detector signals. It was possible to characterise and calibrate each individual fibre channel with a low degree of human interaction.
keywords:
Position sensitive detectors , scintillating fibers , optoelectronic device characterization , multi-anode photomultiplier1 The scintillating fibre detector
The high resolution coordinate detector in the Kaos spectrometer operated at Mainz Microtron consists of two identical planes of 9 216 Kuraray SCSF-78 scintillating fibres of 0.83 mm outer diameter. Each plane is read out by 72 Hamamatsu H7259K multi-anode photomultipliers (MaPMT) with 32 channels in a linear array. The MaPMT have an average anode luminous sensitivity of Alm (according to data sheet 140 Alm is typical), an average cathode luminous sensitivity Alm (70 Alm is typical), and an average gain ( is typical). Fig. 1 shows a photograph of one detector plane during the assembly stage.

Individual Cockcroft-Walton voltage multipliers provide the high-voltages for the MaPMTs [1]. The high voltage is distributed linearly between the 10 stages of metal channel dynodes. The signals of the 144 MaPMTs are transmitted by 96-channel front-end boards and digitised by double-threshold discriminators. The position information and signal time are picked up by state-of-the-art 1 time-to-digital converters [2]. A fast trigger logic based on a total of 37 FPGA modules controls the data acquisition. This DAQ system is nearly dead-time free [3].
This detector combines a precise charged particle track determination with a high resolution timing information and can tolerate background particle rates of the order of several hundred MHz.
2 Calibration setup
To correct variations in the detection efficiency, caused by the different gains of the MaPMTs and variations of the optical transmittance and coupling of the fibres to the photocathode, a fully automated calibration procedure has been developed.
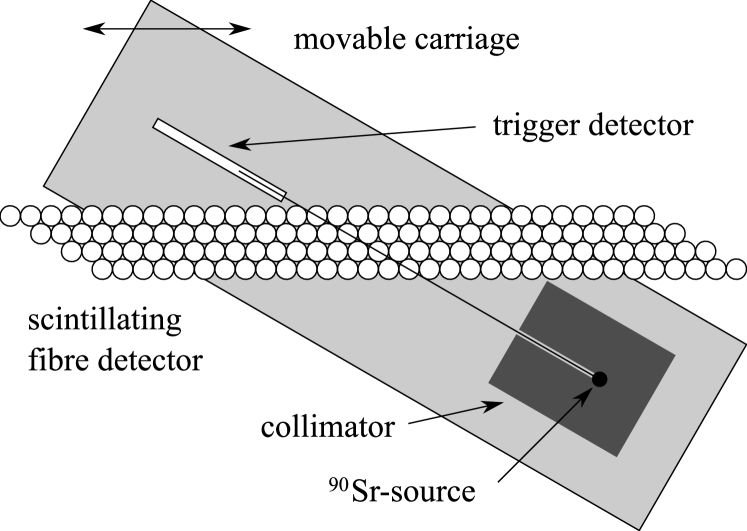
A collimated 90Sr-source with a beam diameter of 1 mm and a total activity of 22 MBq is placed in an acrylic glass block. On the opposite side a narrow trigger detector consisting of a stack of scintillating fibres assures that the electrons have crossed the fibre detector. This trigger detector has a size of L W H 20 0.5 20 mm3 and is read out by a conventional PMT. The setup is mounted on a linear guidance and is positioned alongside the detector plane by a stepping motor with a precision of 0.1 mm. A scheme of the calibration setup can be seen in Fig. 2.
To normalise the energy loss of the electrons inside the fibre detector, the trigger detector discriminator threshold is chosen so high that only the most energetic particles are accepted thus requiring minimum ionisation in the fibre detector.
3 Characterisation and alignment
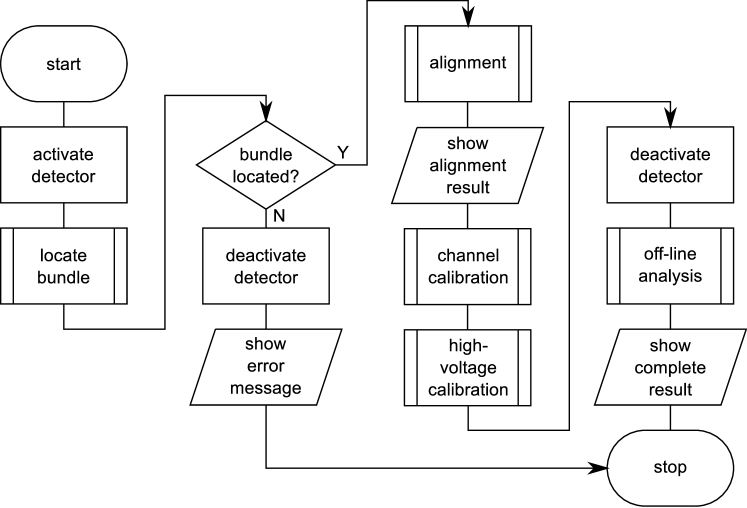
The process of calibration and characterisation for a detector section of 32 channels coupled to one MaPMT is divided into three major steps as shown in Fig. 3. First, an alignment between the detector coordinates and the calibration setup is found. This provides the position information for the channels in this section. Second, the gain measurement of all 32 channels is performed. Finally, the gain variation with the high-voltage for this particular MaPMT is determined. All collected data is stored for off-line analysis.
3.1 Position alignment
Since the detector will be used for tracking particles, it is essential to know the precise position of every channel. Each detector plane is assembled from bundles of 128 fibres to allow for easy replacement of parts of the plane. The fibres of one individual bundle show very small position variations since they are pressed together during the building process by a precise aluminium matrix. However, gaps between the fibres of two neighbouring MaPMTs can be of the order of 1 mm.
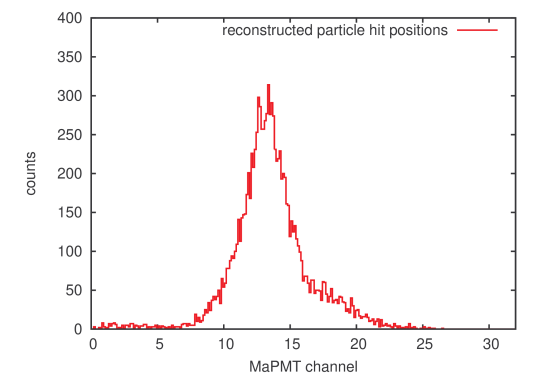
After the calibration software has located one fibre bundle by moving the carriage to its approximate position and taking a test measurement, the first step is to measure its position. Therefore the source is placed in front of the bundle at 10 equidistant positions between channel 6 and 24. For every position a data set of 2 000 events is acquired. From this data the hit positions are reconstructed by analysing signal clusters. These clusters are caused by particles hitting scintillating fibres of multiple channels as well as optical cross-talk between neighbouring channels. The hit position is calculated as the mean channel of the cluster where all channels are weighted with their ADC value. This allows to achieve a position resolution below the channel width. The position of the radiation source is used as a reference point.
A typical position measurement is shown in Fig. 4. The sizes of the collimated electron beam and the trigger detector cause the width of this distribution, the asymmetry of the peak shape is caused by the tilted channel arrangement of the fibre detector, which increases the likelihood of particles on the higher channel side to be scattered into the trigger detector. This systematic error only results in a uniform shift of all channel positions and does not contribute to the position resolution.
The obtained positions of the individual bundles of scintillating fibres is used to reconstruct the precise hit position in the analysis of the data from the coordinate detector in real operation. The relative deviations of the fibre bundle positions with respect to a linear arrangement is shown in Fig. 5.
3.2 Gain measurement
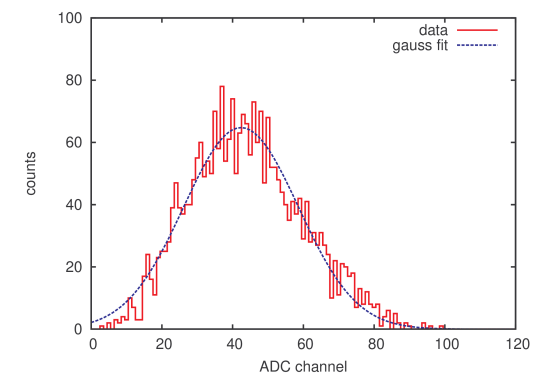
After the position of a bundle has been measured, in the next step the individual gain of every channel is determined. Therefore the assembly of trigger detector and source is placed to every channel and 10 000 events of data are collected at a fixed high-voltage of 900 V.
To achieve a good energy resolution it has to be assured that the entries in the ADC spectrum correspond to particles which have crossed similar track lengths inside the active fibre cores. Therefore, only events with hit positions in the range of the regarded channel contribute to the spectrum. An example for a resulting ADC spectrum is shown in Fig. 6. The relative energy resolution which can be achieved by this method of data acquisition and analysis is of the order of 0.6. This leads to an accuracy for these measurements of the order of 1%.
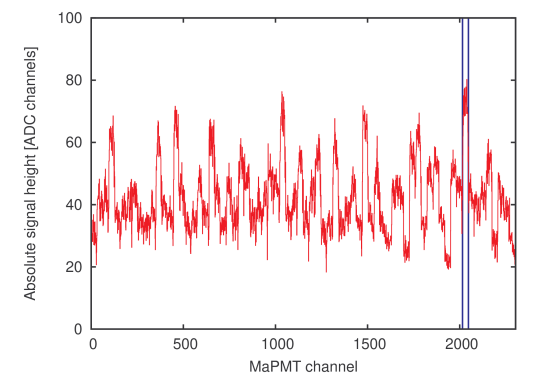
In the signal heights for all 2 304 channels of one plane as displayed in Fig. 7, large gain variations of the order of 40% can be observed between individual MaPMTs, smaller variations of the order of 10% appear between the channels of one MaPMT. According to the data sheet, the gain uniformity between anodes is specified to be between 1:1.1 and 1:1.25 (1:1.5 typical), with the edge anodes having slightly lower gains on average. Few channels have less than 70% of the maximum gain of the MaPMT. However the gain values specified in the data sheet do not correspond to the measured values, since the measurement also takes into account the optical properties of each channel.
3.3 High-voltage adjustment
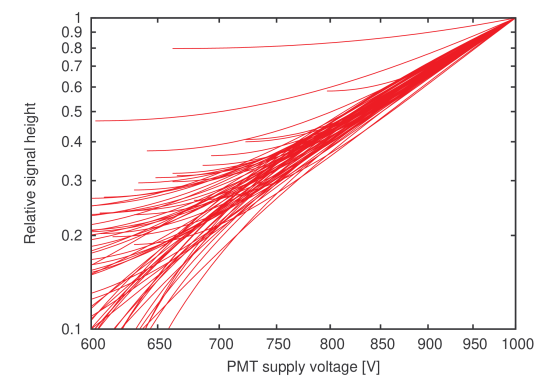
The signal height of the two channels with the highest gain and the channel with the lowest gain is measured for each MaPMT with 9 different high-voltages in the range of 600 V to 1000 V. The relative signal height variation with the high-voltage shows a similar behaviour for all 72 PMTs of one detector plane as shown in Fig. 8. The signal height changes proportional to the 4.5th power of the high-voltage. The gain increase specified in the data sheet is proportional to the 9th power of the high-voltage. However, the manufacturer measures the gain as the ratio between the anode current and the current from the photocathode, while the signals in this calibration procedure are charge integrated single anode pulses. Some MaPMTs with significantly lower gain than the average can be distinguished from the general trend. For these MaPMTs the signal height increase with high-voltage is lower.
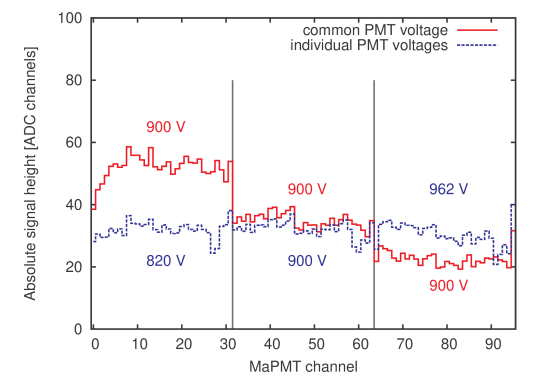
With the response measured for all MaPMTs the high-voltages can be adjusted to correct the gain variations between different MaPMTs. The high-voltages are adjusted so that the ADC values of the channels with the highest gain of each MaPMT are equal. The effect of this adjustment can be seen in Fig. 9. Variations between different channels of one MaPMT are compensated by setting individual discriminator thresholds.
3.4 Identification of faulty channels
During the first calibration runs several faulty channels were identified by missing entries in the ADC spectra. The main reasons were broken connectors and cables between the MaPMT bases and the front-end boards which retransmit the signals to the discriminators. The modular detector construction allowed to replace all faulty parts.
4 Conclusion
The high number of channels leading to a total of almost 9 000 measurements needed to characterise this detector made it necessary to implement a setup that works highly autonomously. Using this setup all data was collected which is necessary to set the high-voltages for the MaPMTs and discriminator thresholds to achieve equal detection efficiency in all channels, and to correct the channel positions in the off-line data analysis to maximise the spatial resolution of the charged particle track determination. The only form of human interaction needed with the setup is the rewiring of the MaPMTs and the manual repair of broken connectors leading to faulty channels.
Acknowledgements
This work was supported in part by the Federal State of Rhineland-Palatinate and by the Deutsche Forschungsgemeinschaft with the Collaborative Research Center 443.
We acknowledge the support by the Research Infrastructure Integrating Activity “Study of Stongly Interacting Matter” HadronPhysics2 under the 7th Framework Programme of EU.
The assistance of staff, particularly from the mechanics and electronics workshops, is gratefully acknowledged.
Part of this work is contained in the PhD thesis of C. Ayerbe Gayoso.
References
- [1] Dubna, Multichannel high Voltage System for Photomultiplier Tube Arrays, available online at http://www.hvsys.dubna.ru/HVS-2.pdf (2002).
- [2] P. Achenbach, et al., Front-end electronics for the Kaos spectrometer at MAMI, IEEE Trans. Nucl. Sci. 56 (2009) 316.
- [3] P. Achenbach, et al., A large-scale FPGA-based trigger and dead-time free DAQ system for the Kaos spectrometer at MAMI, IEEE Trans. Nucl. Sci. 58 (2011) 1677.