ALMA OBSERVATIONS OF THE OUTFLOW FROM THE SOURCE I IN THE ORION-KL REGION
Abstract
In this Letter, we present sensitive millimeter SiO (J=5-4; =0) line observations of the outflow arising from the enigmatic object Orion Source I made with the Atacama Large Millimeter/Submillimeter Array (ALMA). The observations reveal that at scales of a few thousand AU, the outflow has a marked ”butterfly” morphology along a northeast-southwest axis. However, contrary to what is found in the SiO and H2O maser observations at scales of tens of AU, the blueshifted radial velocities of the moving gas are found to the northwest, while the redshifted velocities are in the southeast. The ALMA observations are complemented with SiO (J=8-7; =0) maps (with a similar spatial resolution) obtained with the Submillimeter Array (SMA). These observations also show a similar morphology and velocity structure in this outflow. We discuss some possibilities to explain these differences at small and large scales across the flow.
Subject headings:
stars: pre-main sequence – ISM: jets and outflows – individual: (Orion Source I) – individual: (Orion BN/KL)1. Introduction
Since its discovery, the radio Source I in the middle of the Kleinmann-Low nebula in Orion, has always been an enigmatic object (Menten & Reid, 1995; Churchwell et al., 1987). Recent proper motion measurements suggest that the Orion Source I might have been part of a multiple system that disintegrated some 500 years ago (Gómez et al., 2008; Rodríguez et al., 2005; Goddi et al., 2011) originating an explosive outflow in the Orion BN/KL region (Zapata et al., 2009; Bally et al., 2011; Zapata et al., 2011a). Bally et al. (2011) proposed that probably the Orion Source I is a short-period binary formed just before the stellar ejection and the formation of the explosive outflow. It is estimated that the separation of the binary is only a few Astronomical Units (AU) (Bally et al., 2011).
Strong H2O and SiO vibrationally excited ( and 2) masers are concentrated very close to the Orion Source I. The H2O masers are distributed in an elongated pattern along a northeast-southwest axis and seem to be expanding about Source I (Genzel et al., 1981). The bulk of the SiO masers are found surrounding Source I and form an X-shaped structure; the emission in the southeast arms is predominantly blueshifted, while the emission in the northwest is predominantly redshifted. The intermediate-velocity emission is observed connecting the red and blue sides of the emission distribution. The SiO masers seem to be arising from a wide-angle bipolar wind emanating from a rotating, ionized edge-on disk with a southeast-northwest orientation (Matthews et al., 2010). The ionized disk has been imaged at 7 mm. and appears to be surrounding a young massive star (Reid et al., 2007; Goddi et al., 2011).
At scales of a few hundreds of AU, Plambeck et al. (2009) imaged the outflow from the Orion Source I using CARMA (The Combined Array for Research in Millimeter-wave Astronomy) in the J = from the vibrational ground state of SiO, and found that the central velocity channels showed the limb-brightened edges of two cones centered on Source I. However, since the outflow appears to lie nearly in the plane of the sky, there is no measurable red-blue velocity asymmetry in the cones, as observed for the masers.
We report 1.5′′ resolution images in the SiO J=5-4; =0 obtained with the Atacama Large Millimeter/Submillimeter Array111ALMA is a partnership of ESO (representing its member states), NSF (USA) and NINS (Japan), together with NRC (Canada) and NSC and ASIAA (Taiwan), in cooperation with the Republic of Chile. The Joint ALMA Observatory is operated by ESO, AUI/NRAO and NAOJ. (ALMA) from the Orion Source I. These observations are complemented with SiO (J=8-7; =0) maps obtained with the Submillimeter Array222The Submillimeter Array (SMA) is a joint project between the Smithsonian Astrophysical Observatory and the Academia Sinica Institute of Astronomy and Astrophysics, and is funded by the Smithsonian Institution and the Academia Sinica. (SMA). Both observations reveal that the outflow from the Orion Source I has a “butterfly” morphology along a northeast-southwest axis. The blueshifted radial velocities are found to the northwest, while the redshifted velocities toward the southeast.
2. Observations
2.1. ALMA
The observations were made with sixteen antennas of ALMA on January 2012, during the ALMA science verification data program. The array at that point only included antennas with diameters of 12 meters. The 120 independent baselines ranged in projected length from 18 to 253 k. The phase reference center for the observations was at = , = . The primary beam of ALMA at 217 GHz has a FWHM . The emission from the outflow powered by the Orion Source I falls very well inside of the FWHM.
The ALMA digital correlator was configured in 4 spectral windows of 1875 MHz and 3840 channels each. This provides a spectral resolution of 0.488 MHz ( 0.7 km s-1) per channel. As a special case, this observation consisted of 5 different spectral tunings resulting on 20 spectral windows. The spectral window where the line SiO (J=5-4; =0) at a rest frequency of 217.10498 GHz was detected, has a central frequency of 217.225 GHz.
Observations of Callisto provided the absolute scale for the flux density calibration while observations of the the quasar J0607085 (with a flux of 1.4 Jy) provide the gain phase calibration. The total on-source integration time was about 100 min. This time was divided to observe the 5 spectral tunings. For time-dependent gain calibration, the nearby quasar J0607085 was observed every 7 minutes.
The data were calibrated, imaged, and analyzed using the Common Astronomy Software Applications (CASA). To analyze the data, we also used the KARMA software (Gooch, 1996). The resulting r.m.s. noise for the line images was about 100 mJy beam-1 at an angular resolution of with a P.A. = . We used uniform weighting to obtain a slightly better angular resolution.
2.2. SMA
The observations were obtained from the SMA, and were collected on December 2009, when the array was in its compact configuration. The 21 independent baselines in the compact configuration ranged in projected length from 16 to 70 k. The phase reference center for the observations was at = , = . Two frequency bands, centered at 335.3306310 GHz LSB (Lower Sideband) and 345.3306310 GHz USB (Upper Sideband) were observed simultaneously. The observations were made in mosaicing mode using half-power point spacing between field centers and thus covering the entire BN/KL region. The primary beam of the SMA at 345 GHz has a FWHM .
The SMA digital correlator was configured in 24 spectral windows (“chunks”) of 104 MHz and 128 channels each. This provides a spectral resolution of 0.812 MHz ( 0.7 km s-1) per channel. The zenith opacity (), measured with the NRAO tipping radiometer located at the nearby Caltech Submillimeter Observatory, was about 0.07 , indicating excellent weather conditions during the observations. Observations of Uranus provided the absolute scale for the flux density calibration. The gain calibrators were the quasars J0541-056 and J0607-085, while 3C454.3 was used for bandpass calibration. The uncertainty in the flux scale is estimated to be between 15 and 20, based on the SMA monitoring of quasars. Further technical descriptions of the SMA and its calibration schemes can be found in Ho et al. (2004).
The data were calibrated using the IDL superset MIR, originally developed for the Owens Valley Radio Observatory (OVRO, Scoville et al., 1993) and adapted for the SMA.333The MIR-IDL cookbook by C. Qi can be found at http://cfa-www.harvard.edu/cqi/mircook.html. The calibrated data were imaged and analyzed in the standard manner using the MIRIAD and KARMA (Gooch, 1996) softwares. We set the ROBUST parameter of the task INVERT to 0 to obtain an optimal compromise between resolution and sensitivity. The r.m.s. noise in each channel of the spectral line data was about 170 mJy beam-1 at an angular resolution of with a P.A. = . The SiO J=8-7; =0 was detected in the USB at a rest frequency of about 347.3 GHz.
3. Results
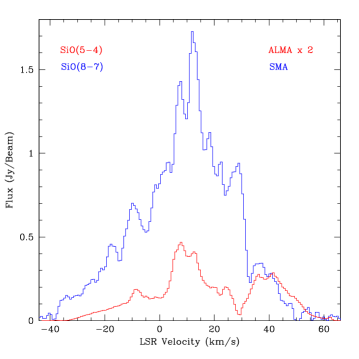
In Figure 1, we show the total power SiO spectra of the ALMA and SMA observations toward the central part of the BN/KL region. The total area from the spectra was obtained covers approximately one arcmin2 centered at the position of the Source I. No obvious maser emission is detected at these transitions. The spectra are very similar, but with that obtained at higher frequencies (SMA) being much stronger than the obtained with ALMA. This has also been observed in outflows associated with young low mass stars (e.g. HH 211; Lee et al., 2007; Palau et al., 2006) and is attributed to the SiO excitation within the outflow. The spectra have two central strong peaks, one peaking around of 6 and the second approximately at 12 . These peaks are associated with the emission from the outflow of the Orion Source I around the systemic velocity of the cloud (9 ). The dip at 9 could be self-absorption. The high-velocity structure has multiple components, some of them come from the outflow of the Orion Source I, but others come from the molecular bubble reported by Zapata et al. (2011b), and objects located in BN/KL. We estimated that the radial velocity of the Orion Source I is about 6 , in good agreement with that value found by Plambeck et al. (2009) and Matthews et al. (2010).
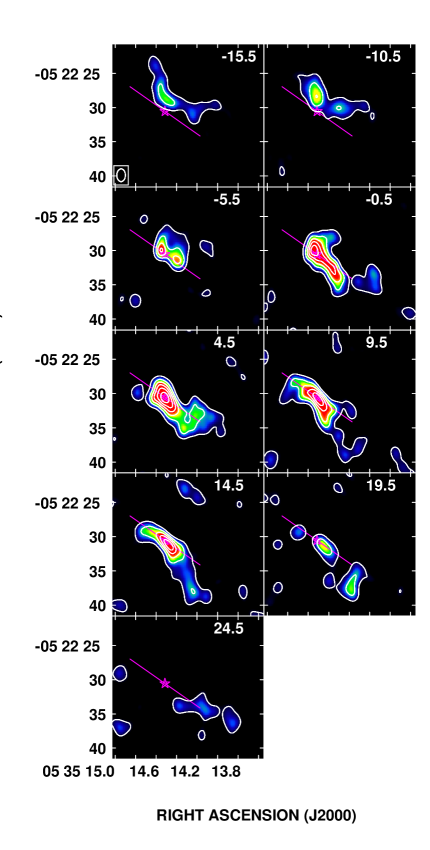
The channel velocity map of the SiO (J=5-4; =0) emission from the Orion Source I mapped with ALMA is shown in Figure 2. The range of radial velocities (15.5 to 24.5 ) is in good agreement with the one obtained by Plambeck et al. (2009) shown in their Figure 1. However, our maps with lower angular resolution seem to recover some extended parts of the outflow lost in their maps. This is more evident in our channels maps with central velocities of 15.5 and 14.5 . In these channels, we observe some north-south structures with a “wing” shape, extending in an east-west orientation. The emission arising from the central velocity channels could not be resolved with our actual resolution, as in Plambeck et al. (2009).
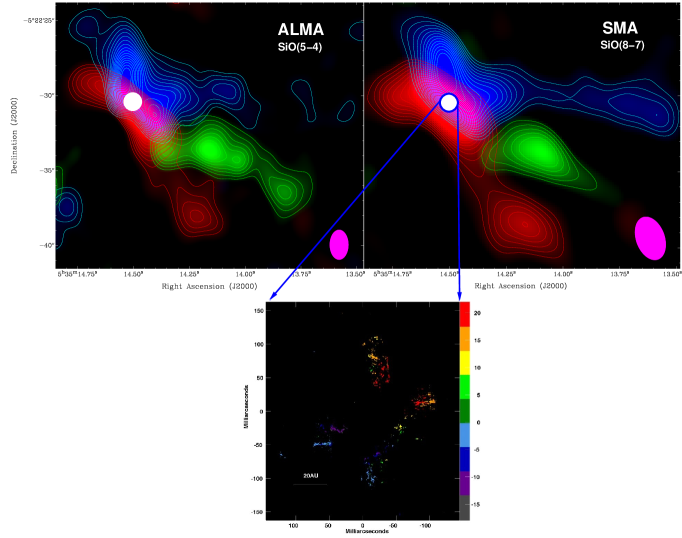
Integrated intensity maps (moment 0) of the SiO emission obtained with ALMA and SMA are presented in Figure 3. In these maps, we only integrated over redshifted and blueshifted radial velocities associated with the outflow from the Orion Source I. The blueshifted gas emission was integrated over LSR velocities ranging from 15 km s-1 to 5 km s-1. The redshifted gas emission was integrated over the LSR velocities range from 15 km s-1 to 25 km s-1. The very high redshifted velocities range from 26 km s-1 to 30 km s-1. These maps reveal that the outflow from the Orion Source I has a marked “butterfly” morphology along a northeast-southwest axis, with the blueshifted radial velocities found to the northwest, while the redshifted velocities are toward the southeast. This velocity structure is different of what is observed at smaller scales, see the Figure 7 of Matthews et al. (2010) or our Figure 3. The ranges of radial velocities of the SiO masers are similar to those obtained by us. The wings of the “butterfly” shape extend several arcseconds along the east-west direction.

At the middle of the “wings”, we find very high velocity emission (see Figure 2, the green color-scale and contours) that also appears to emanate from the Source I, this component is observed at small scales with the same orientation by Matthews et al. (2010). In the ALMA map, with a better sensitivity and angular resolution than the SMA one, the tail extends a few more arcseconds. The “butterfly” morphology can also be seen in the 0.5′′ resolution map of Wright et al. (1995) in the SiO (J=2-1; =0) and in Figure 3 of Plambeck et al. (2009) which was derived from 1′ resolution data . The wings of the butterfly also show some differences between both maps. The red wing is only half, different from the blue wing that is shaped like an U in the ALMA map. Something seems to suppress the other red half. Maybe it is due to some density inhomogeneities in the surroundings of the bipolar outflow.
4. Discusion
In the following, we will discuss some possibilities trying to explain the nature of the velocity structure and morphology of the outflow emanating from Source I.
4.1. Two bipolar outflows
A likely possibility is to have two bipolar outflows emanating from a short-period binary star located in the middle of the ionized disk of the Source I. This is in agreement with what was proposed by Bally et al. (2011) about the binarity of the Source I. One outflow could be moving in a nearly north-south orientation with its blueshifted side in the north and the redshifted side toward the south. The second bipolar outflow, would have an east-west axis, with its blueshifted side to the west, while its redshifted side is to the east. The difference in size of the components could be attributed to the molecular cloud inhomogeneities. The fact that a binary could have a strong precession moving in short time scales, might explain the difference in the redshifted and blueshifted velocities observed at different scales. The SiO masers could be tracing the innermost parts of the two bipolar outflows ejected at the present time (Matthews et al., 2010). However, this hypothesis could not explain satisfactorily well the high velocity tail (with a southwest orientation) observed in the middle of the outflows, and the observations of the single ”cone” outflow found by Plambeck et al. (2009) at their central channel velocities.
4.2. Ballistic ejecta from a rotating disk
We also consider the possibility that the thermal SiO traces gas that was ejected ballistically in the past from the small-scale disk associated with Source I. However, Figure 4 shows that the gas ejected ballistically at small scales from a rotating structure will, at large scales, appears as an expanding structure, with the largest radial velocities overlapping at the center of the structure. This is not what is observed and we rule out this possibility.
4.3. A single expanding wide-angle NE-SW outflow
Another possibility is having a wide-angle expanding outflow that is emanating from the ionized, nearly edge-on, rotating disk reported by Matthews et al. (2010) and Reid et al. (2007). In this case, the SiO masers would trace the innermost parts of the outflow and the thermal SiO emission would be tracing the outer parts of the outflow. The difference in the orientation of the radial velocities at different scales could be attributed to that maybe in the past the rotation of the disk was in a different sense. This could have happened if a large amount of matter fell directly to the disk and changed the rotation sense. This third idea might explain most of the characteristics observed in Figure 3 and those observed at small scales by Matthews et al. (2010) and Plambeck et al. (2009). However, the idea of a disk inverting its rotation direction requires of unusual events during the evolution of the disk and deserves further theoretical and observational studies.
5. Conclusions
In this paper, we have reported SiO (J=5-4; =0) and SiO (J=8-7; =0) observations obtained with ALMA and the SMA. We found a marked “butterfly” morphology along a northeast-southwest axis in the outflow from the Source I. However, the blueshifted radial velocities are found to the northwest, while the redshifted velocities toward the southeast, which is contrary to what is observed at very small scales. We discussed some possibilities to explain this phenomenon, however, any of these hypotheses requires further sensitive, and high spatial resolution observations.
References
- Bally et al. (2011) Bally, J., Cunningham, N. J., Moeckel, N., et al. 2011, ApJ, 727, 113
- Churchwell et al. (1987) Churchwell, E., Felli, M., Wood, D. O. S., & Massi, M. 1987, ApJ, 321, 516
- Ho et al. (2004) Ho, P. T. P., Moran, J. M., & Lo, K. Y. 2004, ApJ, 616, L1
- Genzel et al. (1981) Genzel, R., Reid, M. J., Moran, J. M., & Downes, D. 1981, ApJ, 244, 884
- Goddi et al. (2011) Goddi, C., Humphreys, E. M. L., Greenhill, L. J., Chandler, C. J., & Matthews, L. D. 2011, ApJ, 728, 15
- Gooch (1996) Gooch, R. 1996, Astronomical Data Analysis Software and Systems V, 101, 80
- Gómez et al. (2008) Gómez, L., Rodríguez, L. F., Loinard, L., et al. 2008, ApJ, 685, 333
- Lee et al. (2007) Lee, C.-F., Ho, P. T. P., Palau, A., et al. 2007, ApJ, 670, 1188
- Matthews et al. (2010) Matthews, L. D., Greenhill, L. J., Goddi, C., et al. 2010, ApJ, 708, 80
- Menten & Reid (1995) Menten, K. M., & Reid, M. J. 1995, ApJ, 445, L157
- Palau et al. (2006) Palau, A., Ho, P. T. P., Zhang, Q., et al. 2006, ApJ, 636, L137
- Plambeck et al. (2009) Plambeck, R. L., Wright, M. C. H., Friedel, D. N., et al. 2009, ApJ, 704, L25
- Scoville et al. (1993) Scoville, N. Z., Carlstrom, J. E., Chandler, C. J., et al. 1993, PASP, 105, 1482
- Reid et al. (2007) Reid, M. J., Menten, K. M., Greenhill, L. J., & Chandler, C. J. 2007, ApJ, 664, 950
- Rodríguez et al. (2005) Rodríguez, L. F., Poveda, A., Lizano, S., & Allen, C. 2005, ApJ, 627, L65
- Wright et al. (1995) Wright, M. C. H., Plambeck, R. L., Mundy, L. G., & Looney, L. W. 1995, ApJ, 455, L185
- Zapata et al. (2009) Zapata, L. A., Schmid-Burgk, J., Ho, P. T. P., Rodríguez, L. F., & Menten, K. M. 2009, ApJ, 704, L45
- Zapata et al. (2011a) Zapata, L. A., Schmid-Burgk, J., & Menten, K. M. 2011b, A&A, 529, A24
- Zapata et al. (2011b) Zapata, L. A., Loinard, L., Schmid-Burgk, J., et al. 2011a, ApJ, 726, L12