2012 Vol. 12 No. 9, 1185–1190
22institutetext: Yunnan Astronomical Observatory, National Astronomical Observatories, Chinese Academy of Sciences, Kunmin 650011, China
33institutetext: Key Laboratory for Research in Galaxies and Cosmology, The University of Science and Technology of China, Chinese Academy of Sciences, Hefei, Anhui, 230026, China
44institutetext: Polar Research Institute of China, Jinqiao Rd. 451, Shanghai, 200136, China
\vs\noReceived 2012 June 12; accepted 2012 July 27
Discovery of six high-redshift quasars with the Lijiang 2.4m telescope and the Multiple Mirror Telescope
Abstract
Quasars with redshifts greater than 4 are rare, and can be used to probe the structure and evolution of the early universe. Here we report the discovery of six new quasars with -band magnitudes brighter than 19.5 and redshifts between 2.4 and 4.6 from the YFOSC spectroscopy of the Lijiang 2.4m telescope in February, 2012. These quasars are in the list of quasar candidates selected by using our proposed criterion and the photometric redshift estimations from the SDSS optical and UKIDSS near-IR photometric data. Nine candidates were observed by YFOSC, and five among six new quasars were identified as quasars. One of the other three objects was identified as a star and the other two were unidentified due to the lower signal-to-noise ratio of their spectra. This is the first time that quasars have been discovered using a telescope in China. Thanks to the Chinese Telescope Access Program (TAP), the redshift of 4.6 for one of these quasars was confirmed by the Multiple Mirror Telescope (MMT) Red Channel spectroscopy. The continuum and emission line properties of these six quasars, as well as their central black hole masses and Eddington ratios, were obtained.
keywords:
quasars: general — quasars: emission lines — galaxies: active — galaxies: high-redshift1 Introduction
The number of known quasars has increased steadily in the past four decades since their discovery in 1963 (Schmidt 1963). In particular, a large number of quasars have been discovered in two large spectroscopic surveys, namely, the Two-degree Field (2dF) survey (Boyle et al. 2000) and the Sloan Digital Sky Survey (SDSS) (York et al. 2000). 2dF mainly selected low redshift () quasar candidates with UV-excess (Smith et al. 2005) and has discovered more than 20,000 quasars (Croom et al. 2004). SDSS adopted a multi-band optical color selection method for quasars mainly by excluding the point sources in the stellar locus of the color-color diagrams (Richards et al. 2002) and has identified more than 120,000 quasars (Schneider et al. 2010). 90% of SDSS quasars have low redshifts (), though some dedicated methods were also proposed for finding high redshift quasars () (Fan et al. 2001a,b; Richards et al. 2002).
High-redshift quasars are rare, and those with redshifts greater than 4 represent only 1% in the total quasar population. In the SDSS DR7 quasar catalog (Schneider et al. 2010), only 1248 (392) among 105783 quasars have redshifts greater than 4 (4.5). Since these quasars exist when the universe is at age of 1.57 Gyr, they can be used to probe the structure and evolution of the early universe (Smith et al. 1994; Constantin et al. 2002). In particular, the absorption line spectra of these quasars can give valuable information on the nature of intergalactic medium at high redshift. However, discovering quasars is a big challenge because they are fainter than the low redshift quasars due to their larger distances. Moreover, the Ly emission lines for quasars move to the red end of optical spectra, making them hard to be distinguishable from stars due to similar optical colors. Recently, Wu & Jia (2010) proposed using the criterion to select quasars and using the criterion to select quasars with the SDSS optical and UKIDSS (UKIRT Infrared Deep Sky Survey)111The UKIDSS project is defined in Lawrence et al. (2007). UKIDSS uses the UKIRT Wide Field Camera (WFCAM; Casali et al. 2007) and a photometric system described in Hewett et al. (2006). The pipeline processing and science archive are described in Hambly et al. (2008). near-IR data based on a K-band excess technique (Warren et al. 2000; Hewett et al. 2006; Chiu et al. 2007; Maddox et al. 2008). With these two criteria, we expect to obtain more complete quasar samples than previous ones. Recent optical spectroscopic observations made by the GuoShouJing Telescope (LAMOST) and MMT have demonstrated the success of finding the missing quasars with redshifts between 2.2 and 3 using the Y-K/g-z criterion (Wu et al. 2010a,b; Wu et al. 2011). We also hope to discover some quasars with the J-K/i-Y criterion, which is expect to be applicable for selecting the candidates of quasars with redshifts up to 5 (Wu & Jia 2010).
In this letter, we report our discovery of six new high redshift quasars from the spectroscopic observations with the Lijiang 2.4m telescope and MMT in February, 2012. The successful identifications of these high redshft quasars further demonstrate the effectiveness of using our newly proposed criteria for discovering the missing quasars including high-redshift ones.
2 Target Selection and Spectroscopic Observations
Richards et al. (2009) presented a catalog of about 1million quasar candidates selected from the SDSS DR6 photometric data using Bayesian methods. Photometric redshifts for these candidates were also provided based on the SDSS magnitudes. From this catalog we selected all unidentified candidates with the photometric redshift greater than 3.6, the photometric redshift probability larger than 0.6 and the -band magnitude brighter than 19.5. Then we cross-matched them with the UKIDSS Large Area Survey (LAS) DR7 catalog using a positional offset of 3 arcsec to find the closest counterparts. From this sample with both SDSS data and UKIDSS data, we adopted our criterion (Wu & Jia 2010), namely, (where are the Vega magnitudes and is the AB magnitude) , to make further selection of quasar candidates. We also used our own program to estimate the photometric redshifts of these candidates with SDSS and UKIDSS 9-band photometric data (Wu & Jia 2010; Wu, Zhang & Zhou 2004), and excluded the sources whose photometric redshifts estimated from the 5-band SDSS photometric data in Richards et al. (2009) are inconsistent with ours. After these procedures we obtained a final list of about 20 high-redshift () quasar candidates.
The spectroscopic observations were carried out on February 26-28, 2012, with the Yunnan Faint Object Spectrograph and Camera (YFOSC) instrument of the Lijiang 2.4m telescope in Yunnan Astronomical Observatory. Due to the cloudy weather, nine candidates were observed with YFOSC using a low resolution grism with the central wavelength around , the spectral resolving power of 870, and a long slit with of 2.5′′ width. The typical seeing is around 2′′. In Table 1 we summarize the details of the observations for these 9 candidates. Six of them were idenfied as quasars, one as a G-type star and two as unidentified due to the lower signal-to-noise ratios of their spectra.
| Name | Date | Exposure | Result | |||||||||
|---|---|---|---|---|---|---|---|---|---|---|---|---|
| (SDSS J) | () | |||||||||||
| 075733.86+190403.1 | 2012-02-26 | 2700 | 21.37 | 20.40 | 19.45 | 19.00 | 18.53 | 17.88 | 17.02 | 16.63 | 15.68 | low S/N |
| 085203.84+020437.7 | 2012-02-27 | 6000 | 21.67 | 20.99 | 19.69 | 19.09 | 18.66 | 17.82 | 17.47 | 16.66 | 15.72 | low S/N |
| 092740.04-023347.5 | 2012-02-28 | 4200 | 21.01 | 20.50 | 19.55 | 19.08 | 18.86 | 18.42 | 18.01 | 17.11 | 16.42 | G star |
| 093345.70-020439.5 | 2012-02-27 | 3600 | 23.77 | 20.72 | 19.55 | 19.47 | 19.41 | 19.21 | 18.66 | 18.46 | 17.88 | quasar |
| 095023.74+004419.7 | 2012-02-27 | 6600 | 23.97 | 20.97 | 19.75 | 19.48 | 19.36 | 18.83 | 18.40 | 17.76 | 17.25 | quasar |
| 113816.85+045023.6 | 2012-02-27 | 6000 | 21.26 | 20.70 | 19.67 | 19.27 | 19.06 | 18.30 | 17.96 | 16.90 | 16.46 | quasar |
| 120312.63-001118.8 | 2012-02-28 | 5400 | 25.38 | 22.34 | 20.29 | 19.14 | 18.95 | 18.32 | 18.00 | 17.19 | 16.64 | quasar |
| 125052.11+074919.6 | 2012-02-26 | 5400 | 23.56 | 20.08 | 18.75 | 18.63 | 18.43 | 18.14 | 17.35 | 16.81 | 16.15 | quasar |
| 145115.89+015843.3 | 2012-02-27 | 4800 | 23.72 | 20.42 | 19.30 | 19.23 | 19.09 | 18.61 | 18.02 | 17.56 | 16.92 | quasar |
0.86The magnitudes are given in AB system and the magnitudes are given in Vega system.
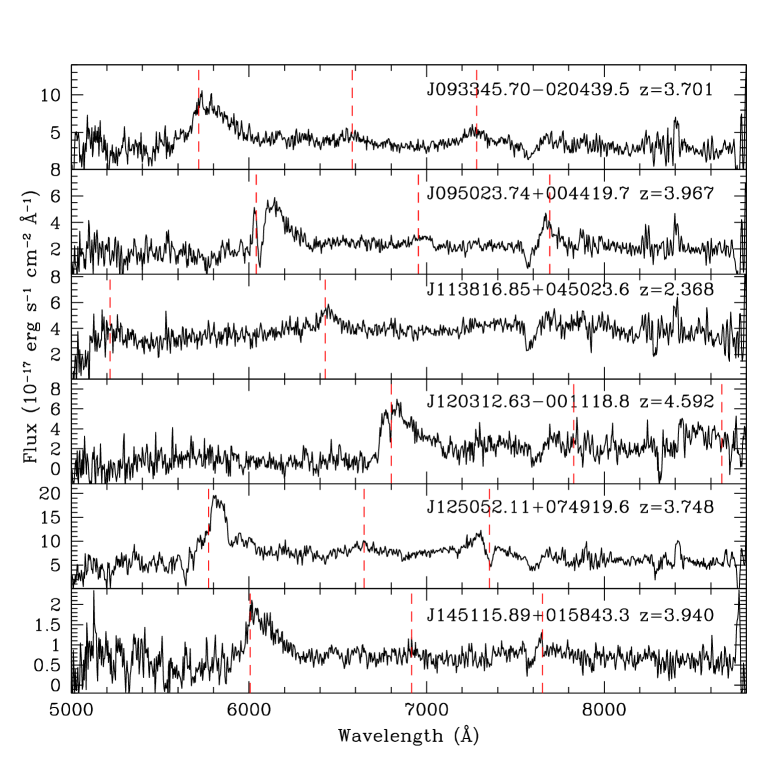
The spectra of six new quasars, after the flat-field correction and both wavelength and flux calibrations, are shown in Fig.1. The strongest emission lines for five quasar are Ly lines, while for SDSS J113816.85+045023.6 the strongest line around is CIII]. The redshifts for these quasars are the average values given mostly by the Ly and CIV lines for five quasar and by the III] and CIV lines for SDSS J113816.85+045023.6.
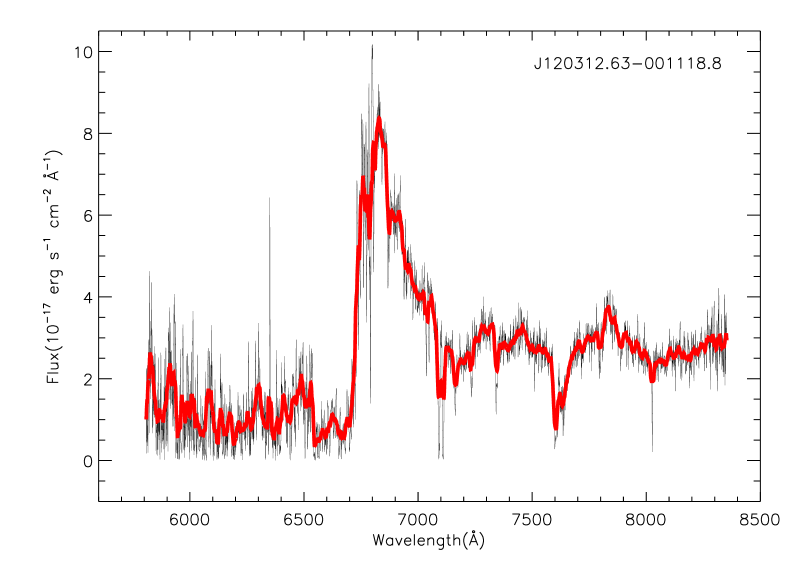
Thanks to the Chinese Telescope Access Program222http://info.bao.ac.cn/tap/, SDSS J120312.63-001118.8 was also observed with the Red Channel Spectrograph on the MMT 6.5m telescope333Observation reported here was obtained at the MMT Observatory, a joint facility of the Univeristy of Arizona and the Smithsonian Institution. at Mt. Hopkins, Arizona, USA on Feb. 29, 2012, with a wavelength coverage of 5100-8600 and a spectral resolution of 1.6Å. It was observed twice, with the exposures of 10 minutes and 15 minutes respectively. The spectrum was processed using the IRAF Echellette package and is shown in Fig. 2. The average redshift estimated from Ly and SiIV (1400Å) emission lines is 4.6010.008, consistent with the result (z=4.5920.048) obtained from the YFOSC observation.
3 Spectral analyses and properties of six high-redshift quasars
The redshift corrected rest-frame YFOSC spectra of six quasars are first corrected for the Galactic extinction using the extinction map of Schlegel et al. (1998). They are then fitted with an IDL code MPFIT (Markwardt , 2009). We fit the spectra with the pseudo-continuum model consisting of the featureless nonstellar continuum and FeII emissions. The continuum is assumed to be a power-law, so two free parameters (the amplitude and the slope) are required. The UV FeII template (Vestergaard & Wilkes 2001; Tsuzuki et al. 2006) is convolved with a velocity dispersion and shifted with a velocity, assuming the line width of FeII lines are same with emission lines in the corresponding wavelength range. During the fitting, the amplitude and slope of the power-law continuum and the amplitude, velocity shift and broadening width of the FeII emission, are set to be free parameters. The initial value of the power-law continuum is obtained by fitting a simple power law to the data in the chosen windows, which are free from emission-line contamination. The initial value of broadening width of the FeII emissions is set to be the line width of the strong emission line CIV. Then we use the pseudo-continuum model to fit a set of continuum windows with strong FeII emissions but no other emission lines, as mentioned in Hu et al. (2008), slightly adjusted interactively for each individual spectrum in order to avoid broad absorption features or extended wings of emission lines.
After constructing the pseudo-continuum, the CIV line should be fitted with two Gaussians, one for the narrow component and another for the broad component. However, except SDSS J095023.74+004419.7, the spectra of other five quasars have low signal-to-noise ratio, so we used only one Gaussian to fit the CIV emission line. Absorption features are evident in the spectra of four quasars, and one more negative Gaussian was added in the fitting. We measure the Full Width at Half Magnitude of CIV line (FWHMCIV), luminosity at 1350 Å() from the spectra (except for SDSS J113816.65+004419.7, where 1350 is not within the wavelength coverage, we estimate the luminosity at 1500 instead). The black hole mass is estimated based on FWHMCIV and with Eq. (7) in Vestergaard & Peterson (2006)(see also Kong et al. 2006). Using a scaling between and bolometric luminosity , , we estimated the bolometric luminosity for the six quasars. Based on the estimated black hole mass and bolometric luminosity, we also estimated their Eddington ratios (). The results are summarized in Table 2. Although the uncertainties of these values are probably quite large due to the low spectral quality and the unusual properties of CIV, we noticed that the overall properties of these six quasars are consistent with those of typical SDSS quasars at high redshift (Shen et al. 2011).
| Name | Redshift | FWHM(CIV) | ||||
|---|---|---|---|---|---|---|
| (SDSS J) | () | () | () | () | ||
| 093345.70-020439.5 | 3.7010.011 | 6749 | 46.457 | 9.621 | 47.122 | -0.588 |
| 095023.74+004419.7 | 3.9670.035 | 4500 | 46.300 | 9.185 | 46.964 | -0.310 |
| 113816.85+045023.6 | 2.3680.011 | 5144 | 46.000 | 9.118 | 46.664 | -0.543 |
| 120312.63-001118.8 | 4.5920.048 | 4865 | 46.431 | 9.323 | 47.096 | -0.316 |
| 125052.11+074919.6 | 3.7480.030 | 5424 | 46.805 | 9.615 | 47.469 | -0.235 |
| 145115.89+015843.3 | 3.9400.006 | 4507 | 45.682 | 8.859 | 46.346 | -0.602 |
4 Discussion
A complete quasar sample is crucial for studying the large scale structure of the universe. The current available quasar samples are mostly biased towards low redshifts () and more efforts are needed to find quasars at high redshift. Wu & Jia (2010) proposed to obtain a large complete quasar sample with redshifts up to five by combining the criterion with the criterion to select quasar candidates. Some recent optical spectroscopic observations have demonstrated the success of finding the missing quasars with redshifts between 2.2 and 3 using the criterion (Wu et al. 2010a,b; Wu et al. 2011). Our discovery of six high redshift quasars (five with ) from the spectroscopic observations with the Lijiang 2.4m telescope and MMT further demonstrates the effectiveness of using the criterion for discovering quasars with redshifts up to five. Moreover, the identification of five quasars with from nine candidates with photometric redshift larger than 3.6 also confirms the robustness of the photometric redshifts estimated by the SDSS and UKIDSS photometric data. We noticed that two among our five new quasars do not meet the SDSS or selection critrion for quasars (Fan et al. 2001a,b; Richards et al. 2002), which suggests that about 40% of such quasars may be missed in the SDSS spectroscopic survey. This obviously needs to be confirmed by future observations of a large sample of quasars.
Our identification of a quasar demonstrates that quasars can be identified with the 2-meter size telescopes in China. We hope more high redshift quasars will be discovered by the future LAMOST quasar survey (Wu 2011), which is aiming at discovering 0.3-0.4 million quasars from 1 million quasar candidates with , by taking the advantages of 4000 fibers and 5 degree field of view of LAMOST (Su et al. 1998; Zhao et al. 2012). The new quasar selection criteria, such as those based on SDSS, UKIDSS and the Wide-field Infrared Survey Explorer (WISE; Wright et al. 2010) data (Wu et al. 2012), will be applied for selecting quasar candidates in the LAMOST quasar survey. This will hopefully provide the largest quasar sample in the next five years for further studies of AGN physics, large scale structure and cosmology.
Acknowledgements.
We thank the referee for a constructive report and Jianguo Wang, Cheng Hu and Zhaoyu Chen for great helps on the spectral analysis. This work was supported by the National Natural Science Foundation of China (11033001). We acknowledge the use of Lijiang 2.4m telescope and the MMT 6.5m telescope, as well as the archive data from SDSS and UKIDSS. This research uses data obtained through the Telescope Access Program (TAP), which is funded by the National Astronomical Observatories, Chinese Academy of Sciences, and the Special Fund for Astronomy from the Ministry of Finance. Funding for the SDSS and SDSS-II has been provided by the Alfred P. Sloan Foundation, the Participating Institutions, the National Science Foundation, the U.S. Department of Energy, the National Aeronautics and Space Administration, the Japanese Monbukagakusho, the Max Planck Society, and the Higher Education Funding Council for England. The SDSS Web Site is http://www.sdss.org/.References
- (1) Boyle B.J., et al., 2000, MNRAS, 317, 1014
- (2) Casali M., et al., 2007, A&A, 467, 777
- (3) Chiu K., Richards G.T., Hewett P.C., Maddox N., 2007, MNRAS, 375,1180
- (4) Constantin A., Shields J.C., Hamann F., et al., 2002, ApJ, 565, 50
- (5) Croom S.M. et al., 2004, MNRAS, 349, 1397
- (6) Fan X. et al., 2001a, AJ, 121, 54
- (7) Fan X. et al., 2001b, AJ, 122, 2833
- (8) Hambly N.C., et al., 2008, MNRAS, 384, 637
- (9) Hewett P.C., Warren S.J., Leggett S.K., Hodgkin S.T. 2006, MNRAS, 367, 454
- Hu et al. (2008) Hu C., Wang J.-M., Ho L., Chen Y.-M., Zhang H.-T., Bian W.-H., & Xue S.-J., 2008, ApJ, 687, 78
- (11) Kong M.Z., Wu, X.-B., Wang R., Han J.L., 2006, \chjaa, 6, 396
- (12) Lawrence A., et al., 2007, MNRAS, 379, 1599
- (13) Maddox N., Hewett P.C., Warren S.J., Croom S.M. 2008, MNRAS, 386, 1605
- Markwardt (2009) Markwardt C. B. 2009, in ASP Conf. Ser. 411, Astronomical Data Analysis Software and Systems XVIII, ed. D. A. Bohlender, D. Daniel, & P. Dowler (San Francisco, CA; ASP), 251
- (15) Richards G.T. et al., 2002, AJ, 123, 2945
- (16) Richards G.T. et al., 2009, ApJS, 180, 67
- (17) Schmidt M. 1963, Nature, 197, 1040
- (18) Schneider D.P. et al., 2010, AJ, 139, 2360
- Schlegel et al. (1998) Schlegel D.J., Finkbeiner D.P., Davis M., 1998, ApJ, 500, 525
- (20) Smith J.D. et al., 1994, AJ, 108, 1147
- (21) Smith J.R. et al., 2005, MNRAS, 359, 57
- (22) Shen Y., et al., 2011, ApJS, 194,45
- (23) Su D.Q., Cui X., Wang Y., Yao Z. 1998, Proc. SPIE, 3352, 76
- Tsuzuki et al. (2006) Tsuzuki Y. Kawara K. Yoshii Y., Oyabu S., Tanab T., & Matsuoka Y., 2006, ApJ, 650, 57
- Vestergarrd & Peterson (2006) Vestergaard M. & Peterson B.M., 2006, ApJ, 641, 689
- Vestergarrd & Wilkes (2001) Vestergaard M. & Wilkes B.J., 2001, ApJS, 134, 1
- (27) Warren S.J., Hewett P.C., Foltz C.B. 2000, MNRAS, 312, 827
- (28) Wright E. L., et al., 2010, AJ, 140, 1868
- (29) Wu X.-B., et al., 2010a, RAA, 10, 737
- (30) Wu X.-B., et al., 2010b, RAA, 10, 745
- (31) Wu X.-B., 2011, NARIT Conference Series, in press (arXiv:1111.0738)
- (32) Wu X.-B., et al., 2011, AJ, 142, 78
- (33) Wu X.-B., et al., 2012, AJ, 144, 49
- (34) Wu X.-B., & Jia Z., 2010, MNRAS, 406, 1583
- (35) Wu X.-B., Zhang, W. & Zhou, X. 2004, ChJAA, 4, 17
- (36) York D.G. et al., 2000, AJ, 120,1579
- (37) Zhao, G. et al. 2012, RAA, 12, 723