Sizing up partially-depleted galaxy cores
Abstract
We have modelled the inner surface brightness profiles of 39 alleged ‘core’ galaxies with the core-Sérsic model, and provide new physical parameters for the largest ever sample of ‘core’ galaxies fit with this model. When present, additional nuclear components were simultaneously modelled and the typical rms scatter of the fits (out to 10) is 0.02 mag arcsec-2. Model-independent estimates of each core’s break radius are shown to agree with those from the core-Sérsic model, and a comparison with the Nuker model is provided. We found an absence of cores in what amounts to 18% of the sample which are reclassified here as Sérsic galaxies with low values of ) and thus shallow inner profile slopes. In general, galaxies with and km s-1 do not have depleted cores. We derive updated relations between core-Sérsic break radii, their associated surface brightness, bulge luminosity, central velocity dispersion, and predicted black hole mass for galaxies with depleted cores. With the possible exception of NGC 584, we confirm that the inner negative logarithmic profile slopes are 0.3 for the ‘core’ galaxies, and for six of these. Finally, the central stellar mass deficits are found to have values typically within a factor of 4 of the expected central black hole mass.
Subject headings:
galaxies: elliptical and lenticular, cD — galaxies: fundamental parameter — galaxies: nuclei — galaxies: photometry— galaxies:structure1. Introduction
The stellar distributions in galaxies have played a valuable role in guiding our understanding of the galaxies themselves. In particular, the accessibility of high-resolution imaging offered by the Hubble Space Telescope (HST) substantially advanced our appreciation of the complexity of galaxy cores (e.g. Crane et al. 1993; Kormendy et al. 1994; Jaffe et al. 1994; Ferrarese et al. 1994; Grillmair et al. 1994; van den Bosch et al. 1994; Lauer et al. 1995; Byun et al. 1996; Gebhardt et al. 1996; Carollo et al. 1997; Faber et al. 1997). For instance, the centers of real galaxies may contain such distinct components as bright active galactic nuclei (AGN), nuclear star clusters, flattened nuclear discs and bars, dust lanes and clouds. On the other hand, giant stellar evacuation zones are also observed. Luminous galaxies with such shallow cores had of course long been known to exist from ground-based observations (e.g. King & Minkowski 1966, 1972; King 1978; Young et al. 1978; Binney & Mamon 1982; see the review by Graham 2012a) but HST enabled us to accurately quantify these.
After studying 14 bright elliptical galaxies with the pre-refurbished HST/WFPC1, Ferrarese et al. (1994) introduced a 4-parameter double power law model to describe the inner surface brightness distributions of bright galaxies. While the (relatively brighter) galaxies in their sample which possessed depleted cores with shallow inner profiles were grouped as “Type I”, the remaining galaxies, labeled “Type II”, had a profile that remained steep all the way into the center. Examining a larger sample of galaxies imaged using the same HST/WFPC1 high-resolution Planetary Camera, Kormendy et al. (1994) and Lauer et al. (1995) largely agreed with the division of galaxies presented in Ferrarese et al. (1994), referring to them as ‘core’ galaxies and ‘power-law’ galaxies, respectively. They also advanced a double power law model which they dubbed the ‘Nuker law’ for fitting the (underlying host galaxy) surface brightness profiles of early-type galaxies. The Nuker model had an additional fifth parameter to moderate the transition between the two power laws — as introduced by Hernquist (1990, his eq. 43) for modelling the internal density profiles of galaxies.
The physical process(es) responsible for the observed difference between the inner surface brightness profiles of ‘core’ galaxies and the fainter ‘power-law’ galaxies (nowadays referred to as ‘Sérsic’ galaxies because these spheroids have Sérsic light profiles rather than power-law light profiles) provide valuable clues about the galaxies’ past history. In bright galaxies, the widely advocated ‘dry’ (i.e. gas poor) galaxy merger hypothesis (e.g. Faber et al. 1997) can result in the gravitational sling shot of central stars (core scouring) due to the coalescence of supermassive black holes (SMBHs) from the progenitor galaxies (e.g. Begelman, Blandford & Rees 1980; Makino & Ebisuzaki 1996; Merritt & Milosavljević 2005; Merritt 2006). It is possible that the sizes and mass deficits of such partially depleted cores may reflect the amount of merging and damage caused by the black holes (after having eroded any pre-existing nuclear stellar components: Bekki & Graham 2010). Having an accurate quantification of the physical parameters defining the centers of galaxies is therefore important. Moreover, reliable break radii , used to denote the sizes of the cores, may even be useful for predicting black hole masses (Lauer et al. 2007a).
While investigating the lack of any connection between the double power-law model and the curved galaxy brightness profiles observed outside of the cores, Graham et al. (2003, see their figures 2–4) revealed that the Nuker model’s break radius, and other parameters, were not robust quantities but are sensitive to the radial range of the surface brightness profile that is fitted. For example, the break radii were shown to vary by more than a factor of three. The parameters’ sensitivity was recognised to arise from the Nuker model’s efforts to fit an outer power-law to what is actually a curved brightness profile. The luminosity profiles of bright (core) galaxies ( mag) — which show a downward deviation from the inward extrapolation of their outer Sérsic (1963, 1968) profile — were subsequently shown to be precisely represented by the core-Sérsic model (Graham et al. 2003; Trujillo et al. 2004).
While Lauer et al. (2005) missed this development, Ferrarese et al. (2006) found the core-Sérsic model to be highly applicable to bright early-type galaxies in the Virgo cluster. Lauer et al. (2007a,b) subsequently wrote that “Graham et al. (2003) have criticized the Nuker as being sensitive to the domain over which the Nuker law was fitted, particularly when the outer limit of the fit extends only slightly beyond . In practice, however, the Nuker laws are fitted over a large radial range that extends well beyond .” However this was not the problem identified by Graham et al. (2003), who had demonstrated that the Nuker model parameters deviated further from the true values as the fitted radial extent was increased.
Based on “work in preparation” Lauer et al. (2007b) refuted that their Nuker break radii were biased “in any way” because their radii reportedly agreed very well with model-independent values of where the curvature in the surface brightness profile was a maximum. This was a surprising claim because these latter values should not be dependent on the radial extent of the data while the Nuker model break radii are a strong function of the fitted radial extent (Graham et al. 2003). Kormendy et al. (2009, their section 4.1) subsequently buoyed the Nuker model and dismissed the core-Sérsic model. Gültekin et al. (2009) then over-looked any and all concerns about the Nuker model which they presented along with Nuker model parameters from Lauer et al. (2005), and encouraged readers to use this data, additionally noting that the surface brightness profiles that were fit with the Nuker model are available at the Nuker web page111http://www.noao.edu/noao/staff/lauer/wfpc2_profs/. Gültekin et al. (2011) continued in this vein, motivating us to further investigate, nearly a decade on, the issue of whether the Nuker model parameters are reliable, physically meaningful quantities, or if instead the core-Sérsic model parameters may be preferable. At stake is not only the accuracy to which we quantify the cores of galaxies, but our subsequent understanding of cores and how they relate to their galaxy at large.
In this paper, we focus on the nuclear structure of galaxies by re-analyzing the surface brightness profiles of all 39 ‘core’ galaxies imaged with the WFC2 / F555W or F606W filter and listed in Lauer et al. (2005) to be a ‘core’ galaxy (see section 2). For reference, Trujillo et al. (2004) modelled only 9 possible ‘core’ galaxies, Ferrarese et al. (2006) modelled 10, and Richings, Uttley & Krding (2011) have very recently modelled 21 ‘core’ galaxies. We are therefore modelling the largest sample of suspected ‘core’ galaxies to date. For comparison’s sake with the Nuker model break radii, we use exactly the same surface brightness profiles as Lauer et al. (2005), available at the previously mentioned Nuker web-page.
We first concentrate on measuring the core size using the core-Sérsic model (see sections 3 and 4). We additionally take the nuclear excess, usually nuclear star clusters or AGN emission, into account while modeling the underlying host galaxy light. In section 5 we use two model-independent core size estimators and reveal that one of these can not be used while the other is consistent with our core-Sérsic break radii. Furthermore, we confirm that the published Nuker model break radii are typically 100% larger than the break in the surface brightness profile determined relative to the inward extrapolation of the outer Sérsic function (Trujillo et al. 2004). We additionally report that ‘artificial’ break radii have been reported in what were alleged to be ‘core’ galaxies but are actually Sérsic galaxies with no break in their Sérsic profile and which thus have no partially depleted core relative to their outer light profile (section 6). Throughout this paper we use terms such as ’actual’, ‘true’ and ‘real’ break radii and cores when referring to galaxies that have inner surface brightness profiles which break downward from (i.e. have lower flux than) the inward extrapolation of the outer Sérsic model which describes their outer stellar distribution.
Sets of structural parameter relations encompassing central as well as global properties are presented in section 7. In particular, equations involving the break radius and associated surface brightness, and the luminosity, are derived. We also investigate the (core size)-(central black hole mass) relation in section 7.2. Using updated data, we find that the break radius can be used to consistently predict the black hole mass when using either the - or - relations for ‘core’ galaxies when coupled with our updated - and - relations. We go on to discuss the detection of additional nuclear components in the full sample of Sérsic and core-Sérsic galaxies in section 8 while section 9 summarises our main conclusions.
2. Sample Selection
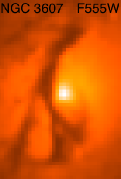
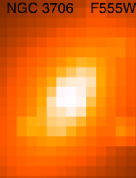
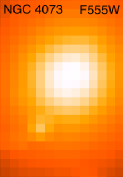
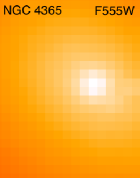
Lauer et al. (2005) analyzed and presented fits to the major-axis surface brightness profiles of 77 relatively bright, nearby, early-type galaxies. Every galaxy in their sample was observed with the Wide Field Planetary Camera 2 (WFPC2: Biretta et al. 2001) onboard the HST and was centered on the PC CCD (which has an image scale of 0″.0456 pixel-1 and a field view of 800 800 pixels). Their sample lacks any characterizing selection criteria and comprises galaxies at distances of 10–100 Mpc. While almost all of the ‘core’ galaxies were imaged with the F555W filter (similar to broadband V), two were not and we use their F606W data (roughly broadband R) instead. We refer the reader to Lauer et al. (2005) for an extensive description of the sample and images, which includes procedures adopted for PSF deconvolution222Some of the merits and disadvantages of image deconvolution are described in Ferrarese et al. (2006)., dust obscuration correction, sky subtraction and background source masking.
Our sample comprises 39 early-type galaxies which are the ‘core’ galaxy subset of the 77 galaxies presented in Lauer et al. (2005). This sample selection enables a direct comparison with the (published) Nuker model’s estimation of the core size and related parameters, and to further achieve this direct comparison we have modelled the same published light profiles1. The global properties of our target galaxies are summarized in Table 1, which presents their morphology, magnitude, updated distance and velocity dispersion. For the six lenticular galaxies plus one Sa spiral galaxy, we have roughly converted their total galaxy magnitudes, reported by Lauer et al. (2007b), into bulge magnitudes using a mean -band bulge-to-disc ratio of 1/3, equivalent to a mean bulge-to-total ratio of 1/4 (Graham & Worley 2008; Laurikainen et al. 2010, their section 6.3 and references therein). The 1 range on this ratio for S0–Sa galaxies is about a factor of 2, corresponding to a 1 uncertainty of 0.75 mag for our bulge magnitudes. In passing we note that for four of these seven disk galaxies (NGC 507, NGC 2300, NGC 3607, and the Sa galaxy NGC 7213), the dust-corrected -band ratios reported by Laurikainen et al. (2010) are 0.33, 0.28, 0.33 and 0.18, respectively, suggesting that we are not too far off with our adopted -band value of 0.25. Laurikainen et al. do however identify NGC 3706 as an elliptical galaxy, while de Vaucouleurs et al. (1991) refer to it as SA0(rs), and we have no comparison ratios for NGC 4382 and NGC 6849. In any event, it should be remembered that these latter three galaxies make up a fairly small fraction of the total sample.
| Galaxy | Type | D | ||
|---|---|---|---|---|
| (mag) | (Mpc) | (km s-1) | ||
| (1) | (2) | (3) | (4) | (5) |
| NGC 0507 | S0 | 306 | ||
| NGC 0584 | E | 206 | ||
| NGC 0741 | E | 291 | ||
| NGC 1016 | E | 302 | ||
| NGC 1374 | E | 183 | ||
| NGC 1399 | E | 342 | ||
| NGC 1700 | E | 239 | ||
| NGC 2300 | S0 | 261 | ||
| NGC 3379 | E | 209 | ||
| NGC 3607 | S0 | 224 | ||
| NGC 3608 | E | 192 | ||
| NGC 3640 | E | 182 | ||
| NGC 3706 | S0 | 270 | ||
| NGC 3842 | E | 314 | ||
| NGC 4073 | cD | 275 | ||
| NGC 4278 | E | 237 | ||
| NGC 4291 | E | 285 | ||
| NGC 4365 | E | 256 | ||
| NGC 4382 | S0 | 179 | ||
| NGC 4406 | E | 235 | ||
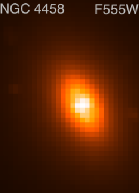
| NGC 4458 | E | 103 | ||
| NGC 4472 | E | 294 | ||
| NGC 4473 | E | 179 | ||
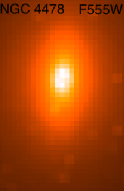
| NGC 4478 | E | 137 | ||
| NGC 4486B | cE | 170 | ||
| NGC 4552 | E | 253 | ||
| NGC 4589 | E | 224 | ||
| NGC 4649 | E | 335 | ||
| NGC 5061 | E | 186 | ||
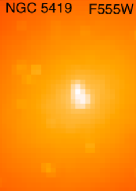
| NGC 5419 | E | 351 | ||
| NGC 5557 | E | 253 | ||
| NGC 5576 | E | 171 | ||
| NGC 5813 | E | 237 | ||
| NGC 5982 | E | 239 | ||
| NGC 6849 | SB0 | 209 | ||
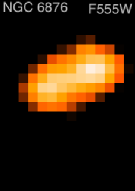
| NGC 6876 | E | 229 | ||
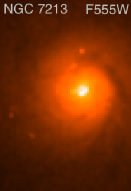
| NGC 7213 | Sa | 163 | ||
| NGC 7619 | E | 323 | ||
| NGC 7785 | E | 255 | ||
| NGC 0596∗ | cD | 151 | ||
| NGC 1426∗ | E | 151 |
Notes.—Col. (1) Galaxy name. Col. (2) Morphological classification from the NASA/IPAC Extragalactic Database (NED)333(http://nedwww.ipac.caltech.edu). Col. (3) Absolute V-band (galaxy or bulge) magnitude obtained from Lauer et al. (2007b) and adjusted using the distance from col. (4). Sources: () Tonry et al. (2001) after reducing their distance moduli by 0.06 mag (Blakeslee et al. 2002); () from NED (3K CMB). Col. (5) Central velocity dispersion from HyperLeda444(http://leda.univ-lyon1.fr) (Paturel et al. 2003). The superscript * is used to indicate two ‘power-law’ galaxies taken from Lauer et al. (2005) and used for illustrative purpose in Fig. 1.
3. The Sérsic and core-Sérsic models
By combining CCD images of early-type Virgo cluster galaxies with deep, large field-of-view, photographic images, Caon et al. (1993) revealed that the Sérsic (1963) model fits the main parts of the profiles of both elliptical and spheroidal galaxies astonishingly well over large ranges in surface brightness (down to 29 -mag arcsec-2). In general, after excluding the nuclear region, the Sérsic R1/n model fits the surface brightness profile of both elliptical galaxies and the bulges of disk galaxies remarkably well over their entire radial range (Caon, Capaccioli & D’Onofrio 1993; D’Onofrio, Capaccioli & Caon 1994; Young & Currie 1994; Andedakis et al. 1995; Graham et al. 1996). In fact, systematic deviations from this model appear to signal either the presence of a central light deficit or an additional nuclear component (Balcells et al. 2003; Graham & Guzmán 2003). Indeed, using CCD images with the extended profiles from Caon et al. (1993) and other photographic data, one of main conclusions noted in Kormendy et al. (2009) was exactly this.
The radial intensity distribution of the 3-parameter Sérsic model, a generalization of de Vaucoulers (1948) 2-parameter model, is defined as
| (1) |
where denotes the intensity at the half-light radius . The quantity , for (e.g. Caon et al. 1993), is a function of the shape parameter , and is defined in a way to ensure that encloses half of the total luminosity. A review of the Sérsic model and its associated expressions can be found in Graham & Driver (2005).
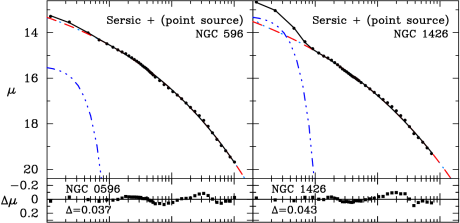
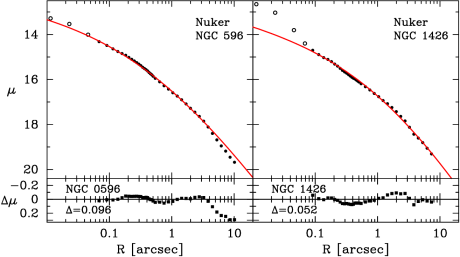
Many, but not all, spheroids fainter than -20.5 -mag contain additional nuclear components. This is illustrated in Fig. 1 where we display a Nuker model and a Sérsic plus point source model fit to the surface brightness profiles of NGC 596 and NGC 1426. The profiles have been taken from the Nuker web-pages, and the fitted Nuker model parameters are from Lauer et al. (2005). Both models agree on the absence of a partially depleted core, and as such the galaxies are classified as Sérsic galaxies. There are, however, considerable differences regarding the quality of the fits. For NGC 596, the 3-parameter Sérsic plus 2-parameter Gaussian model accommodates the entire observed radial range of the brightness profile remarkably well with a smaller root mean square (rms) residual than the 5-parameter Nuker model. The Nuker model fit (taken from Lauer et al. 2005) to this galaxy’s light profile not only excluded the inner most data points but also clearly reveals a significant departure from the profile in the outer region. Similarly, while the Sérsic model plus Gaussian function can represent the entire observed profile of NGC 1426, the 5-parameter Nuker model cannot describe the extra compact light source at the center and has more scatter in the residual profile.
As mentioned previously, the light profiles of luminous (M mag) elliptical galaxies depart systematically from the Sérsic model near their center. It is important to realize that this departure, a downward deviation with respect to the inward extrapolation of the outer Sérsic profile, emanates from a central starlight deficit and is not due to dust (which would result in a dramatic color change). Such stellar distributions can be described using the core-Sérsic model introduced by Graham et al. (2003) and applied in Trujillo et al. (2004). A blend of an inner power-law and an outer Sérsic function, it can be written as
| (2) |
with
| (3) |
is intensity at the core’s break radius , is the slope of the inner power law region, and controls the sharpness of the transition between the inner power-law and the outer Sérsic profile. As in the Sérsic model, is the effective half-light radius of the outer Sérsic function and has the same general definition as before555 One recovers the Sérsic R1/n function from equation (2) when setting Rb and to zero.. In practice, the 6-parameter core-Sérsic model can be reduced to a 5-parameter model by setting to some large constant value. Trujillo et al. (2004) set , so that the transition from Sérsic profile to power law at is infinitely sharp, with no transition region, an approach effectively adopted by Ferrarese et al. (2006). In this paper, as in Richings et al. (2011), we explore and use a range of finite values for .
4. Fitting Analysis
We fit the one dimensional light distributions of the 39 underlying host galaxies using Sérsic and core-Sérsic models, and account for any additional nuclear light components with either a Gaussian or an exponential model. Fits to the full 39 galaxies are available in Appendix A. The quality of the fits, as indicated by the rms given in each panel of Appendix A Fig. 21, is excellent, typically 0.01-0.03 mag arcsec-2.
As can be seen, the 3-parameter Sérsic model proffers a good match to two (NGC 4473 and NGC 5576) of the 39 galaxies666The Nuker model parametrization (Lauer et al. 2005) reported that NGC 4473 and NGC 5576 had break radii of 4.45 and 4.18 arcseconds, respectively. all the way to the HST resolution limit. While these galaxies have shallow central profiles, the profiles do not ‘break’ from the outer envelope — further evidenced by the small values of used with the Nuker model (Lauer et al. 2005). Application of the Sérsic model, along with small inner Gaussian and exponential functions, yields a satisfactory fit to the luminosity profiles of an additional five nucleated galaxies (NGC 1374, NGC 4458, NGC 4478, NGC 4486B and NGC 7213). In what follows, and as noted before, we collectively refer to this class of galaxy without depleted cores as ‘Sérsic’ galaxies, as done by Trujillo et al. (2004) who first reported that NGC 4458 and NGC 4478 are Sérsic galaxies, i.e. they do not display any downward departure from the Sérsic profile at their centres. Kormendy et al. (2009) and Hopkins et al. (2009) also identify central light excesses over the Sérsic function in these two galaxies. Except for NGC 4486B (Lauer et al. 1996) and NGC 7213, the rms residual scatter is 0.032 mag arcsec-2 for these seven Sérsic galaxies. These two exceptions are two of only four galaxies, from the full sample of 39, with complicated structure (see Appendix A Fig. 23). As shown in section 6, these seven galaxies stand out from the ‘core’-galaxies in a number of systematic ways.
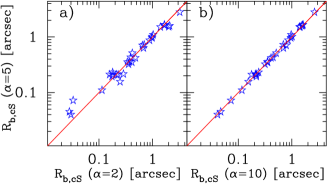
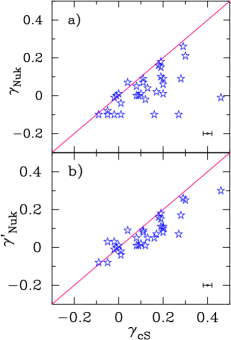
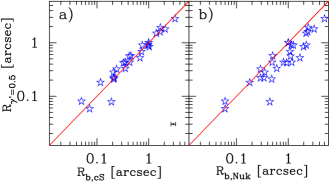
There is some variation in from galaxy to galaxy when using the core-Sérsic model. The role of the parameter is to moderate the sharpness of the transition between the outer Sérsic profile and the inner power-law, with higher values corresponding to sharper transitions and vice versa. The profile of NGC 4291, for example, has a sharper transition and hence requires a larger value of than say NGC 1399. We have set and 2 for matching sharp, moderate and broad transition regions respectively. The change in the core size, i.e. the break radius, while varying has been closely inspected. The robustness of the break radius is illustrated by the plots shown in Fig. 2, which compare the break radii obtained using different values of . The Pearson correlation coefficient () between the core-Sérsic break radius and the core-Sérsic break radius shown in Fig. 2b is 1.0. Although the break radii from the broad-transition model (i.e. using ) has a small amount of scatter in Fig. 2a, this is due to the fact that the majority of our sample galaxies do not prefer the broad-transition model. There are, however, a small handful of galaxies (NGC 1016, NGC 1399, NGC 2300, NGC 3379, NGC 4365, NGC 4649, NGC 5419 and NGC 5813) whose profiles have a broad transition region (see Table 2).
We also estimate the uncertainties of the core-Sérsic model parameters by exploring their stability for different values (i.e. 2, 5 and 10). In agreement with Richings et al. (2011) and Trujillo et al. (2004), for some galaxies, we notice that , and obtained from the best and 10 fits are slightly different from the ones which are obtained using .
In addition, we explore the coupling between the core-Sérsic break radius and the Sérsic index by holding the other parameters constant at their best-fit values (Table 2) and using the distribution, which we normalised at the minimum value. In Fig. 3 we show the 68.3% (1) confidence limits around the optimal and values for the core galaxies using the contours after marginalizing over the remaining core-Sérsic parameters. In general, Fig. 3 indicates the absence of a coupling between and , as seen by the small contours. Overall, we estimate the uncertainties associated with , , and to be roughly 10%, 10%, 15% and 20% respectively. We also note that the errors in the Sérsic parameters could partly be associated with the limited radial extent of our data (see section 4.1).

As noted in passing above, only 4 galaxies are somewhat poorly represented using our models (NGC 4073, NGC 4486B, NGC 6876 and NGC 7213: see Appendix A, Fig. 23). NGC 7213 is a Seyfert (Sa) galaxy with a winding nuclear dust spiral which can be traced all the way to the nucleus (Deo, Crenshaw & Kraemer 2006). It appears that this prominent dusty nuclear feature in the galaxy profile (see Fig. 4), which the core-Sérsic model is not designed to recover, is the likely origin for the residual pattern about the model fit to this galaxy, particularly in the inner R 0.3 region. The cD galaxy, NGC 4073, has an inner ring (Lauer et al. 2005) over the region and we exclude these few data points from the fit. NGC 6876 is a dominant elliptical galaxy in the Pavo group with a possible past or ongoing merger history (Machacek et al. 2005). The residual structures outside the core regions of NGC 4073 and NGC 6876 that are seen in Appendix A’s Fig. 23 seem to be associated with the change in ellipticities of these galaxies as presented by Lauer et al. (2005). Finally, although not apparent from the I and V broadband HST/WFPC2 image, Lauer et al. (1996) remarked on the presence of a double optical nucleus from the deconvolved WFPC2 image of NGC 4486B. This creates a spurious depleted core as noted by Lauer et al. (1996), see also Soria et al. (2006) and Ferrarese et al. (2006).
| Galaxy | Profile Type | Notes | ||||||||||
|---|---|---|---|---|---|---|---|---|---|---|---|---|
| mag arcsec-2 | (arcsec) | (pc) | (mag) | mag arcsec-2 | (arcsec) | |||||||
| (1) | (2) | (3) | (4) | (5) | (6) | (7) | (8) | (9) | (10) | (11) | (12) | |
| NGC 0507 | 16.45 | 0.42 | 130 | 5 | 3.2 | - | ||||||
| NGC 0584 | 14.57 | 0.19 | 18 | 0.46 | 5 | 6.4 | - | |||||
| NGC 0741 | 17.52 | 0.96 | 338 | 5 | 7.4 | - | 22.4 | |||||
| NGC 1016 | 17.21 | 0.68 | 289 | 2 | 5.2 | - | ||||||
| NGC 1374+ | — | — | — | — | — | 2.8 | 14.3 | 0.17 | ||||
| NGC 1399+ | 16.29 | 2.09 | 2 | 4.0 | - | |||||||
| NGC 1700 | 13.64 | 0.07 | 18 | 5 | 8.9 | - | ||||||
| NGC 2300 | 16.85 | 0.98 | 122 | 2 | 4.7 | - | ||||||
| NGC 3379 | 15.66 | 1.03 | 51 | 2 | 4.0 | - | ||||||
| NGC 3607 | 16.42 | 1.52 | 164 | 0.29 | 5 | 5.0 | - | nuclear dust lanes | ||||
| NGC 3608 | 15.10 | 0.21 | 23 | 0.28 | 5 | 5.1 | - | |||||
| NGC 3640 | 14.72 | 0.04 | 5 | -0.02 | 5 | 3.9 | - | |||||
| NGC 3706 | 14.17 | 0.11 | 24 | -0.02 | 10 | 6.3 | - | ring of stars (0″.06-0″.4) | ||||
| NGC 3842 | 17.42 | 0.72 | 320 | 0.19 | 5 | 6.1 | - | |||||
| NGC 4073 | 16.47 | 0.24 | 99 | -0.05 | 10 | 8.4 | - | ring of stars (0″.1-0″.4) | ||||
| NGC 4278 | 15.79 | 0.75 | 56 | 0.20 | 5 | 4.4 | - | 19.4 | ||||
| NGC 4291 | 15.22 | 0.35 | 44 | 0.10 | 5 | 5.3 | - | |||||
| NGC 4365 | 16.56 | 1.40 | 135 | 0.04 | 2 | 4.4 | - | 20.1 | ||||
| NGC 4382 | 15.04 | 0.32 | 28 | 0.08 | 5 | 3.7 | - | |||||
| NGC 4406 | 16.01 | 0.87 | 70 | 0.01 | 5 | 8.4 | - | |||||
| NGC 4458 | — | — | — | — | — | 3.1 | 17.0 | 14.4 | 0.25 | |||
| NGC 4472 | 16.44 | 1.68 | 129 | 0.00 | 2 | 4.3 | - | 22.2 | ||||
| NGC 4473 | — | — | — | — | — | 2.1 | ||||||
| NGC 4478 | — | — | — | — | — | 2.7 | 20.1 | 15.6 | 0.41 | |||
| NGC 4486B | — | — | — | — | — | 3.0 | double optical nuclei | |||||
| NGC 4552 | 15.00 | 0.35 | 25 | 0.01 | 10 | 3.9 | - | 20.5 | ||||
| NGC 4589 | 15.34 | 0.21 | 22 | 0.30 | 5 | 5.5 | - | |||||
| NGC 4649 | 16.92 | 3.23 | 256 | 0.18 | 2 | 3.6 | - | |||||
| NGC 5061 | 14.06 | 0.21 | 33 | 0.13 | 5 | 7.0 | - | |||||
| NGC 5419 | 17.60 | 1.67 | 485 | -0.05 | 2 | 6.6 | - | 19.9 | ||||
| NGC 5557 | 15.31 | 0.16 | 35 | 0.17 | 5 | 3.1 | - | |||||
| NGC 5576 | — | — | — | — | — | 3.5 | ||||||
| NGC 5813 | 16.15 | 0.42 | 64 | -0.09 | 2 | 4.1 | - | |||||
| NGC 5982 | 15.45 | 0.21 | 42 | 0.08 | 5 | 3.3 | - | |||||
| NGC 6849 | 16.72 | 0.22 | 84 | 0.20 | 5 | 6.3 | - | |||||
| NGC 6876 | 16.98 | 0.45 | 119 | -0.01 | 10 | 6.4 | - | double optical nuclei | ||||
| NGC 7213 | — | — | — | — | — | 1.5 | 16.6 | 12.6 | 0.04 | |||
| NGC 7619 | 15.78 | 0.35 | 87 | 0.12 | 5 | 4.1 | - | |||||
| NGC 7785 | 14.94 | 0.05 | 11 | 0.16 | 10 | 5.3 | - |
Notes.—Structural parameters from fits to the -band major-axis surface brightness profiles (Appendix A Figs. 22 and 23). The superscript + is used to indicate that an F606W surface brightness profile is used, rather than an F555W surface brightness profile. Col. (1) Galaxy name. Col. (2)-(7) Best-fit parameters from the core-Sérsic model, equation (2). Col. (8) Indicates the profile classification where c-S = core galaxy described by the core-Sérsic model, and S= Sérsic galaxy described by the Sérsic model. Col. (9) Point source apparent magnitude. Col. (10) Nuclear disk central surface brightness. Col. (11) Nuclear disk scale length. Col. (12) Description of inner additional light components. A “?” indicates a tentative classification.
4.1. Literature comparison of core-Sérsic fits
We have seven galaxies (NGC 1700, 4291, 4458, 4478, 5557, 5576 and 5982) in common with Trujillo et al. (2004) and 10 galaxies (NGC 4365, 4382, 4406, 4458, 4472, 4473, 4478, 4486B, 4552 and 4649) in common with Ferrarese et al. (2006) and Côté et al. (2006). While Trujillo et al. (2004) classified NGC 1700 as a Sérsic galaxy after fitting a profile sampled from 0.1 to , we tentatively identify a small core within . Apart from NGC 1700, our profile classifications are in agreement with Trujillo et al. (2004) and Ferrarese et al. (2006).
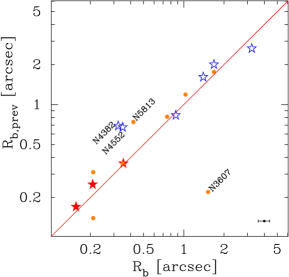
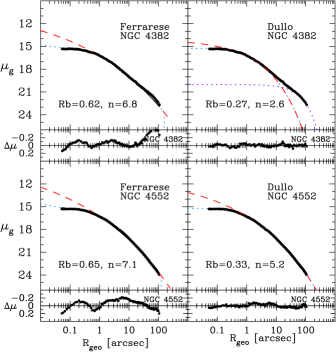
The break radii presented in Trujillo et al. (2004) agree with our values for all 3 ‘core’ galaxies that we have in common. While 4 of the break radii from the 6 ‘core’ galaxies in common with Ferrarese et al. (2006) agree with our values, NGC 4382 and NGC 4552 are discrepant (see Figure 5). As noted by Ferrarese et al. (2006, their section 5.2), the outer disk in the peculiar S0 galaxy NGC 4382 can, if not modelled as a separate component when the data extends into the domain of the disk, bias (high) the Sérsic index that would otherwise be ascribed to the bulge of this galaxy. We have therefore modelled their extended light profile for NGC 4382 with a core-Sérsic plus outer exponential disk to show this. Our break radius, and Sérsic index (see Figure 6), differ from the values presented in Ferrarese et al. (2006) because this galaxy’s outer disk did indeed bias their analysis (Figure 7). Modelling the light profile from Ferrarese et al. (2006) for NGC 4552, we recover their fit when using their published parameters but find that it can be substantially improved upon with a smaller break radii and a value of (Figures 22 and 7). This should be compared with Kormendy et al. (2009, their figure 56) which reports a core radius in excess of 1 arcsecond from their visual inspection. Having accounted for NGC 4382 and NGC 4552, Fig. 4 reveals an excellent agreement between the break radii obtained by us, Trujillo et al. (2004) and Ferrarese et al. (2006). Marginal discrepancies in the break radii may also arise because of the different filters used in each study. While we use data from the F555W filter, Trujillo et al. (2004) primarily used data from a F702W filter, and we have taken the F475W data, rather than the F850LP data, from Ferrarese et al. (2006) as it most closely matches our F555W data.
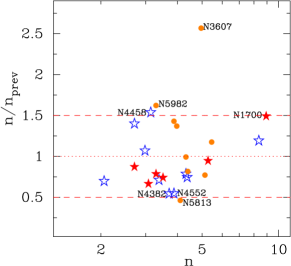
When the radial extent of one’s data does not adequately probe the curvature of a spheroid’s light profile, one may not recover the correct Sérsic index. Graham et al. (2003) noted that truncating a profile from (2-3) to changes the fit parameters by up to 5. Concerned about this, as our data only extends to 10, we have additionally compared our Sérsic indices with those from Trujillo et al. (2004) and Ferrarese et al. (2006) which had a larger radial extent. First, we note that the Sérsic index for NGC 4458 from Trujillo et al. (2004) was biased (high) by the presence of a nuclear disk that was not separately modelled as we have done here. They noted that they were not confident in their analysis of this galaxy and as such we have excluded this one galaxy from Trujillo et al. (2004) in our Figure 6. With the exception of NGC 4552 and NGC 4382, mentioned in the preceding paragraph, the agreement between the Sérsic indices is good to within 50 per cent or better, which in fair agreement with the 1 uncertainty range of 36 percent found by Allen et al. (2006, their figure 15). However, it should also be noted that due to ellipticity gradients, the major-, minor- and geometric-mean axis do not have the same Sérsic index (Ferrari et al. 2004). Their values can disagree by up to a factor of 2 (e.g. Caon et al. 1993, their figure 4). Consequently, some of the scatter seen in Fig. 6, which compares our major-axis Sérsic indices with the geometric-mean axis values from Ferrarese et al. (2006) is because of this.
We have also been able to include a comparison of break radii and Sérsic indices, in Figs 5 and 6 respectively, for 8 core galaxies that we have in common with Richings et al. (2011). In general, the agreement is good, although there are three somewhat discrepant points. For NGC 5982, we suspect that Richings et al. may have missed the core with their Sérsic fit to this large elliptical galaxy with km s-1 and mag. We are also inclined to prefer our core-Sérsic fit to NGC 5813 rather than the core-Sérsic fit of Richings et al. which results in a larger apparent core. However we suspect that the dust ring in NGC 3607, although subtracted, may have still interfered with the optical light-profile from Lauer et al. (2005). As such, we feel that our break radius may be over-estimated for this one galaxy, explaining its outlying nature in the central mass deficit versus black hole mass diagram (see section 7.3).
Recently, Dhar & Williams (2011) noted that surface brightness profiles of elliptical galaxies can be modelled well using the multi-component DW-function (Dhar & Williams 2010), with smaller rms residuals than the Sérsic, Core-Sérsic and Nuker models. Although we fit the profiles (from Lauer et al. 2005) with limited radial ranges, for galaxies that we have in common with Dhar & Williams (2011) — NGC 4365, NGC 4382, NGC 4406, NGC 4458, NGC 4472, NGC 4473, NGC 4478, NGC 4552 and NGC 4649 — our rms residuals are smaller than those obtained with the DW-function (Dhar & Williams 2011, their Table 1) except for NGC 4458 (Appendix A Fig. 22).
5. Break radii measurements
Given that the core-Sérsic model and the Nuker model yield different core sizes, we have included an extended section on the measurement of the break radii via different methods.
5.1. The Nuker model
As noted previously, the Nuker team (Lauer et al. 1995, 2005) used a 5-parameter double power-law model for fitting the inner radial surface brightness profiles of galaxies. Dubbed the “Nuker law”, it can be written as
| (4) |
where is the intensity at the break radius . The negative logarithmic slopes for the inner and outer power-law regions are denoted by and , respectively, while controls the sharpness of the transition. represents both the radius of maximum curvature of this model, and the location where the local gradient of the model equals . One can readily appreciate how fitting this model to a larger radial range, and thus to an increasingly steeper outermost region of what are curved surface brightness profiles, results in larger values of and thus larger values of . When this occurs, the value of is also reduced, to accommodate an (artificially) increasingly broad transition. Having excluded additional nuclear components, Lauer et al. (2005) tabulated their best fitting Nuker model parameters for the galaxies used in this study, see also Lauer et al. (2007a,b), and we refer to those values in some of the following figures.
In their study of the nuclear regions of early type galaxies, Rest et al. (2001) noted that for small values of (i.e. broad transitions), the Nuker model’s parameter is rather a representation of the slope of the brightness profile at radii much smaller than the image resolution limit. They therefore introduced another parameter, , that was the negative logarithmic slope of the Nuker model at , and which was adopted by Lauer et al. (2005, 2007b). Graham et al. (2003) had however noted that because this local logarithmic slope (at ) is a distance dependent quantity, galaxies with identical surface brightness profiles observed at different distances will have different values. That is, this quantity is not a physically robust or meaningful quantity to use.
In Fig. 8 we show how the values from the core-Sérsic model fit to 32 galaxies (having depleted cores relative to the outer Sérsic profile) compare with the (Pearson’s ) and (Pearson’s ) values obtained from the Nuker model. While the latter correlation coefficient is high, it is pointed out that this does not indicate a slope of unity, which would be required if the two parameters were equivalent. Instead, for positive values of , the plots reveal that the (Nuker model)-derived values of and are generally smaller than the core-Sérsic values.
5.2. Model independent approaches
5.2.1 = maximum
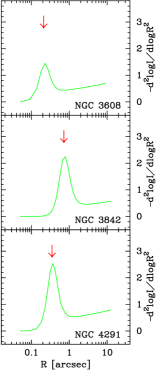
In an effort to obtain a nonparametric estimate of the break radii, we attempt to locate the radius corresponding to the maximum of the second derivative of the observed intensity profile in logarithmic coordinates, independent of any model or any smoothing or alteration of the data. In principle this model-independent radius should mark the break radius. In practice, however, Fig. 9 reveals that there exists several comparable maxima over an extended radial range due to the sensitivity of this approach to the noise in the profile data. Therefore, we were unable to use this technique to acquire accurate break radii. We do however show in Fig. (10, Right) that the core-Sérsic model’s break radius corresponds to the radius where the second logarithmic derivative of this model has its maximum value.
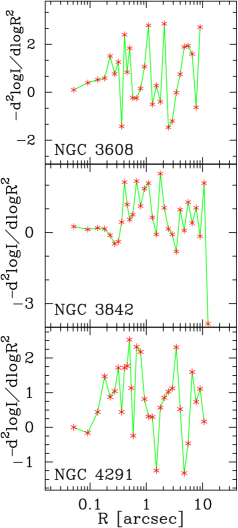
In passing we note that Lauer et al. (2007a, their figure 17) and Lauer et al. (2007b, their figure 16) had reported a strong consistency between their Nuker model break radii and the location of the maximum of the second derivative of the intensity profile, in logarithmic coordinates, acquired from a model-independent approach. This claim was however surprising because it is well established and understood why varies considerably as the fitted radial extent of a galaxy’s surface brightness profile is varied (e.g. Graham et al. 2003, their figures 2-4). As such, while the varying always corresponds to the radius where the fitted Nuker model has the maximum of its second derivative, this typically will not correspond to the radius where the actual data has the maximum in its second derivative. Using the same data as Lauer et al. (2007a,b), we cannot reproduce their result. In Fig.8, we have shown that the second derivative of the observed galaxy brightness profiles has a large point-to-point variation. It is not clear how the result of Lauer et al. (2007a,b) could be obtained without smoothing the data. Furthermore, we continue to reiterate the result of Graham et al. (2003), that the Nuker model fits, especially the break radius, are dependent on the chosen fitting range. In spite of this, that work was the sole basis for their rejection of the concerns about the Nuker model raised by Graham et al. (2003).
5.2.2
In a continued effort to better measure the sizes of partially depleted galaxy cores, this section investigates an alternative model-independent radius that has been used in the literature. This investigation is important if we are to accurately quantify the extent of damage caused by coalescing SMBHs at the centres of galaxies.
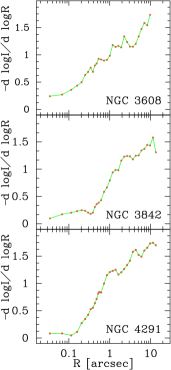
Most ‘core’ galaxies have negative, logarithmic, inner profile slopes less steep than 0.3–0.5 (Glass et al. 2011, and references therein), before they transition to an outer Sérsic profile with a slope typically steeper than 0.5 (Lauer et al. 2005)777As discussed by Graham & Guzmán (2003), pure ‘Sérsic’ galaxies can also have inner profile slopes less steep than 0.5, and whether or not one measures this (underneath any additional nuclear components) simply depends on how small one’s spatial resolution is (see Graham et al. 2003, their Figure 6).. The negative logarithmic slope beyond the core, in the Sérsic portion of the profile, varies as . Graham et al. (2003, their Figure 6) have revealed that this slope is steeper than 0.5 for Sérsic models with –4 once beyond 1% of the effective radius . Given that Côté et al. (2007) have reported that cores extend to 0.02, we can appreciate why the slopes on the outer side of cores are steeper than 0.5. As such, the radius where the negative logarithmic slope of the underlying galaxy surface brightness profile equals (Carollo et al. 1997) can be used to find the transition radius between the inner core and the outer Sérsic profile, and thus approximate the break radius of the core-Sérsic model.
In finding the radius where , when present we avoided data points affected by central light excesses before applying this technique (Fig. 10, Left). We visually inspected individual profiles to double-check these objective break radii estimates and for (only) five galaxies (NGC 3607, NGC 3640, NGC 4406, NGC 4589 and NGC 5557) the data were too noisy; as such we excluded them from the comparison of break radii in the following subsection. The radii where are plotted in Fig. 11 and discussed in the following subsection.
Before proceeding, we note that Lauer et al. (2007a) had also remarked that Carollo et al. (1997) had advocated use of , with , as a core scale parameter. They wrote that “Since is generally well interior to , it is not meant to describe the actual complete extent of the core; it is just a convenient representative scale.” To reduce potential misinterpretation of this comment, it is important to note that the Nuker model’s was also never meant to describe the complete extent of the core. While the published Nuker model break radii occur at large radii where the slope is steeper than (see Fig. 11b), the actual outer edge of the Nuker model’s transition region occurs considerably further out than this, greater than both the Nuker model break radii and the outer edge of the core-Sérsic model. Moreover, due to the curved nature of the outer Sérsic profile, the outer edge of the Nuker model increases as the fitted radial extent is increased.
5.3. The core-Sérsic model
Fig. 11a reveals a strong correlation (Pearson’s ) between the break radii estimated from the model-dependent (core-Sérsic) and the model-independent () quantitative analysis. One can similarly show that the negative logarithmic slope of the fitted core-Sérsic models has a value of 0.5 at a radius very close to the core-Sérsic model’s break radius. This important result has not been noted before. Turning things around, this agreement endorses the use of when the data are not too noisy, albeit with the caveat that even galaxies without partially depleted cores may still have a resolvable radius where . The core-Sérsic model is therefore still recommended for identifying and quantifying cores.
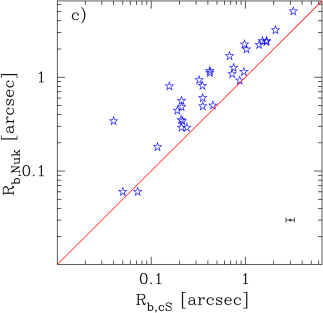
For comparison, Figs. 11b and 12 show that the measurement of the Nuker model’s break radii presented in Lauer et al. (2007a,b) against the model-independent break radii () and the core-Sérsic break radii (). Graham et al. (2003) explained that increasing the fitted radial range of the Nuker model, into the curved profile beyond the core, will increase the slope of the Nuker model’s outer power-law and thus result in the Nuker model’s break radius — corresponding to the location where the model’s slope is the average of the inner and outer power-law slopes and — marching out to larger radii. For this reason the Nuker model’s break radius can be pulled out beyond the actual transition radius between the core and the outer Sérsic profile. On average, the Nuker break radii are 2 times bigger than the core-Sérsic break radii (Fig 13). While Lauer et al. (2007a, their Appendix C) refuted this criticism of the Nuker model, they simultaneously reiterated this very problem and subsequently used . However they did not show how compared with the Nuker model break radii, which is done here for the present galaxy sample that have ‘real’ cores (Fig 11b). The above problem with the Nuker model was, in part, the motivation for the core-Sérsic model. Fig. 13 reveals that there is no correlation between the ratio of the Nuker break radius ( and the core-Sérsic break radius () with either a) (Pearson coefficient , Fig 13a) or b) the core-Sérsic negative inner logarithmic slope (Pearson coefficient = -0.12, Fig. 13b).
From Table 1, we see that the break radii are smaller than 0.5 kpc. It would appear that the 500 pc resolution models by Martizzi et al. (2012, their Figure 7) may have ‘over-cooked’ core-formation in their simulations of galaxies with cores up to 8–10 kpc in size. Similarly, the large 3 kpc cores created by Goerdt et al. (2010) are not observed in real galaxies.
6. Identification of depleted cores, and their slopes
Initially, Kormendy et al. (1994) and Lauer et al. (1995) identified cores if the inner slope of the Nuker model was less than 0.3. Kormendy (1999) subsequently relaxed this criteria to read “galaxies that show a break from steep outer profiles to shallow inner profiles”, with the “outer profile” modelled by the outer power-law of the Nuker model. However this definition of a core, and modelling of the stellar distribution, resulted in a disconnection with the curved outer Sérsic profile that was known to exist (e.g. Caon et al. 1993). Graham et al. (2003) therefore advocated that cores be identified and defined as a central stellar deficit relative to the outer Sérsic profile. Kormendy et al. (2009) quoted and partially embraced this new definition but opted to identify by eye the region to fit the Sérsic model and thus the onset of the break radius, rather than using the core-Sérsic model in an objective analysis. Their visual core classification agrees with our core identification, however, their approach resulted in break radii notably larger than those given by the core-Sérsic model (cf. Graham 2004; Ferrarese et al. 2006) and thus, given the results in the previous section, their break radii do not agree with the model-independent measurement of where the light profile has reached a steep outer profile with negative logarithmic slope equal to 0.5. This arose in part due to the lack of an infinitely sharp transition region. These larger break radii also result in larger estimates of the central mass deficit. Using a model-independent technique based on average profiles, Hopkins & Herquist (2010) reported an upper limit to the mass deficit of 2-4 times the central black hole mass, in agreement with the analysis presented in Graham (2004) using the core-Sérsic model. This is in contrast to the values of 10-20 times the central black hole mass reported by Kormendy & Bender (2009).
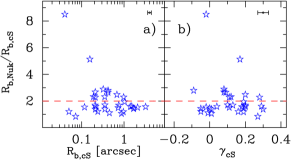
Although all of the 39 galaxies in our sample were tabulated as ‘core’ galaxies by the published analysis using the Nuker model (Lauer et al. 2005, their Table 4)888Although tabulated as having a ‘core’ profile in Lauer et al. (2005), those authors are aware that NGC 4486B is not a ‘real’ core galaxy (Lauer et al. 1996)., in section 4 we effectively reclassified seven as Sérsic galaxies without partially depleted cores. This concern over misidentification in lower luminosity spheroids was first highlighted by Graham et al. (2003), and the discrepancy is fundamentally due to the inclusion of Sérisc galaxies with low Sérsic index (and thus a shallow inner profile slope) that have no depleted core relative to the Sérsic profile which describes the outer galaxy light distribution. The typical value of the Sérsic shape index () for the seven Sérsic galaxies is (Fig. 14).
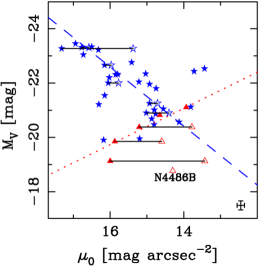
In Figure 15 we have plotted the central surface brightness, , of the galaxies or bulges obtained from the fitted models against their -band absolute magnitude . As with the – diagram (Fig. 14), it is immediately apparent that the seven non-core galaxies are not some random sample from the 39 galaxies. They reside in a region of the – diagram known to be occupied by galaxies without partially depleted cores.
Prior to Lauer et al. (2005), Trujillo et al. (2004) had already revealed that two of these seven galaxies (NGC 4458 and NGC 4478) had no partially-depleted core. Ferrarese et al. (2006) additionally identified that NGC 4473 did not have a depleted core, and Kormendy et al. (2009) subsequently acknowledged that none of these three galaxies have depleted cores but instead have an excess of nuclear flux. In addition to the double-nucleus galaxy NGC 4486B which is known to have a false core (Lauer et al. 1996), we find that NGC 1374, NGC 5576 and NGC 7213 also do not have cores depleted of stars relative to their host spheroid’s (outer) Sérsic profile. NGC 7213 is a rather faint spiral galaxy with mag and is thus not expected to have a depleted core like luminous, boxy spheroids do. NGC 1374 is also not a luminous galaxy; it too has mag, and NGC 5576 is only 0.7 mag brighter.
Besides their distribution in Figs. 14 and 15, it is of interest to examine if there are additional characteristics among these seven galaxies which have cores according to the Nuker model (Lauer et al. 2005) but do not have partially depleted cores relative to their outer Sérsic profile. From the full sample of 39 galaxies, nine have velocity dispersions km s-1 according to HyperLeda, and seven of these nine galaxies are the above Sérsic galaxies. Of the remaining two galaxies, NGC 3640 has km s-1 and a very small, questionable depleted core, and while NGC 4382 has km s-1 according to HyperLeda’s mean value however the most recent measurement of km s-1 (Bernardi et al. 2002) is supportive of a ‘real’ core.
Aside from the above mentioned confirmation by other authors, there are good reasons to suspect that the Nuker model struggles to identify cores which have been depleted relative to the inward extrapolation of the outer Sérsic profile in galaxies and bulges fainter than mag (see Figure 14). While Lauer et al. (2007a) used their Nuker model parameters to determine where the fitted Nuker model has a slope of — which we consider to be a better measurement of the transition from a shallow core to a steep outer profile — one is left with the problem of not knowing which galaxies actually have depleted cores, that consistent with non-parametric identification methods, relative to the smooth inward extrapolation of the outer Sérsic profile. Figure 14 reveals that knowledge of this Sérsic index can help with this diagnosis, but it obviously requires remodelling the light profiles. An additional criteria, which could be better quantified with a larger galaxy sample, is that alleged cores in galaxies with km s-1 are likely not to correspond to a real deficit of stars.
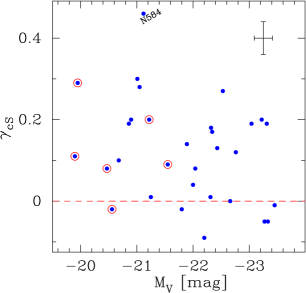
Although our sample is not suitable for testing the bimodality, or lack thereof (Glass et al. 2011, and references therein), in the distribution of host galaxy central surface brightness slopes against absolute magnitude (which, for the reason we have just seen, can not be used as a diagnostic of core identification), we do find that for all (core-Sérsic)-identified core galaxies, with the possible exception of only NGC 584 (where , see Table 2, and Fig. 16). The low-luminosity (low-) Sérsic galaxies without cores can have inner slopes ranging from 0 to 0.5 and steeper depending on the radius where one samples the underlying host spheroid’s Sérsic profile ( Graham & Driver 2005, their section 2.4). Fig. 16 plots the relation between and the -band absolute magnitude for the ‘true’ core galaxies given in Table 2. For the first time using the core-Sérsic model, we find that a number of bright (high ) core galaxies exhibit values of less than 0 (see also Lauer et al. 2005, and references therein for galaxies with Nuker model values of ). Earlier studies with the core-Sérsic model had been confined to reporting . Kandrup et al. (2003) have discussed how black hole binaries may couple with the innermost stars and transport them to a larger radius, resulting in such surface brightness profiles.
7. Structural parameter relations
Having selected a set of cores based on the core-Sérsic model, we intend to obtain radial profiles over a greater radial extent for those 32 galaxies in a future paper. Fig. 14 illustrates the linear correlation between the absolute galaxy magnitude (bulge magnitude in the case of disk galaxies) and the light profile shape, . As noted in section 2, the bulge magnitude for the one spiral (Sa) and six lenticular (S0) galaxies in our sample are obtained using the representative bulge-to-disk flux ratio given in Graham & Worley (2008, their Table 5). Although our galaxies are limited in number and range of absolute magnitude (-18.77 -23.45 mag), the overall distribution in the – diagram is in agreement with that from Caon et al. (1993), Graham & Guzmán (2003; their Fig. 10) and Ferrarese et al. (2006). Given that the Sérsic index is derived from profiles, we do not consider it to be as accurate as possible. Nonetheless, on average, the galaxy ensemble adhere to the established - relation, and are in fair agreement with the indices derived from fits to a larger radial extent (see section 4.1). This gives us some confidence that our Sérsic parameters (which are only used once in this paper to derive a ‘ballpark’ result in section 7.3) are not too far off from the correct values.
7.1. -, -, -, - and - relations
Building on earlier works which explored the connection between early-type galaxy dynamics and isophotal shape (e.g. Davies et al. 1983; Nieto & Bender 1989; Nieto et al. 1991), Faber et al. (1997) highlighted associations between the core structure and global galaxy properties. Bright ellipticals with boxy isophotes, slow rotation and pressure supported dynamics are ‘core’ galaxies, while fainter elliptical galaxies with elliptical or ‘discy’ isophotes and often rotational support are ‘Sérsic’ (‘power-law’) galaxies. They went further to argue that the presence of a ‘core’ is a better predictor of the slow rotation or boxiness than the galaxy absolute magnitude, although we have just learned that some of the Nuker-derived cores are not consistent with core-Sérsic cores or visual classification, i.e. they have been claimed to exist in galaxies with no depleted core. It would be remiss if we did not use our refined core-Sérsic parameters to derive updated scaling relations for galaxies that have central stellar deficits relative to their outer Sérsic profile. That is, we exclude those galaxies having no depleted cores.
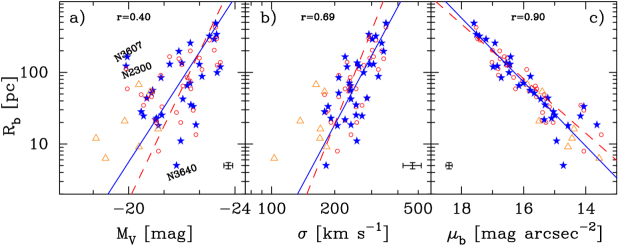
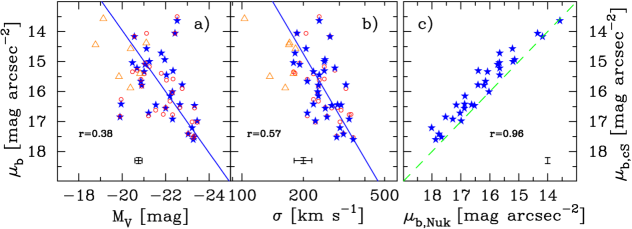
Figs. 17a and 17b display the relation between the core-Sérsic break radius (Table 2) and the published Nuker ‘cusp radius’ (Lauer et al. 2007a), collectively , and a) the V-band absolute magnitude listed in Table 1, and b) the central velocity dispersion (Table 1). Using the ordinary least-squares (OLS) bisector regression (Feigelson & Babu 1992), a fit to the core-Sérsic and yields
| (5) |
and further application of the bisector regression gives the relation between the core-Sérsic and as
| (6) |
Similar trends between break radius and galaxy magnitude were also seen in Faber et al. (1997, their figure 4), Ravindranath et al. (2001, their figure 5a,b), Laine et al. (2003, their figure 9), Trujillo et al. (2004, their figure 9), de Ruiter et al. (2005, their figure 8) and Lauer et al. (2007a, their figure 19, bottom panel). The three outliers in our - relation are: NGC 2300 and NGC 3607— lenticular (S0) galaxies with a big core for their bulge brightnesses— and NGC 3640, a galaxy known for its morphological peculiarity which probably signals an on going or a recent merger (Michard & Prugniel 2004). Shown in Fig. 17c is (core-Sérsic break radius from Table 2 plus Nuker ‘cusp radius’ from Lauer et al. 2007a) as a function of (the V-band surface brightness at the core-Sérsic break radius and the Nuker ‘cusp radius’, from Table 2 and Lauer et al. 2007a respectively). The bisector fit to the core-Sérsic and gives
| (7) |
or
| (8) |
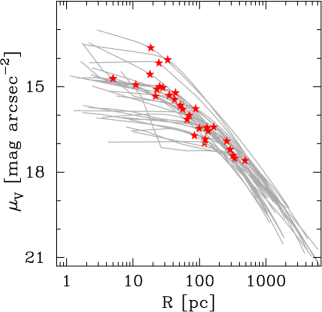
Equations 5, 6 and 8 update the -, - and - relations presented in Lauer et al. (2007a, their equations 13, 14 and 17 respectively). Fig. 18 and Fig. 17c confirm, but re-define the tight correlation between the core-Sérsic core brightness and the core-Sérsic core radius (Faber et al.999Faber et al. (1997) ascribed the tight correlation among the central properties of early-type galaxies to the presence of a “core fundamental plane” (, , ), which is analogous to the global Fundamental Plane — (e.g. Djorgovski & Davis 1987). 1997; de Ruiter et al. 2005, their figure 7; Lauer et al. 2007a, their figure 6). Apparent in Fig. 18 is a roughly universal profile beyond the core of ‘core’ galaxies, out to 1 kpc, which explains the tight relation seen in Fig. 17c.
Fig. 19c plots the core-Sérsic versus the Nuker . In over-estimating the core radii, where , the Nuker model underestimates the associated surface brightness, by typically 1 mag arcsec-2 and up to 2 mag arcsec-2 with respect to the core-Sérsic model. In Figs. 19a and 19b we show relations involving (the V-band surface brightness at the core-Sérsic break radius and the Nuker ‘cusp radius’, from Table 2 and Lauer et al. 2007a respectively) with and . Akin to Fig. 17a, the (core-Sérsic)-identified core galaxies display a correlation between the core-Sérsic and , such that the OLS bisector regression analysis gives
| (9) |
The OLS bisector fit to the core-Sérsic and yields
| (10) |
7.2. Core size versus black hole mass
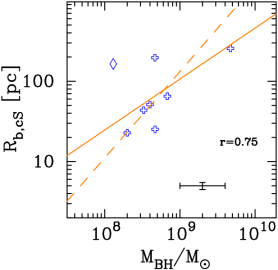
Although the relation between the break radius and the supermassive black hole (SMBH) mass is less fundamental than the relation between the central mass deficit and the SMBH mass (e.g. Graham 2004; Ferrarese et al. 2006, Merritt 2006), de Ruiter et al. (2005) and Lauer et al. (2007a) nonetheless argue for the existence of a good correlation between the former. Shown in Fig. 20 is the core-Sérsic break radius plotted against the black hole mass for 8 core galaxies with direct black hole mass measurements (see Graham 2008b and Graham et al. 2011). The bisector fit to and for these 8 galaxies gives
| (11) |
However, while considering only 7 of the 8 core galaxies, after excluding the only disk galaxy (NGC 3607), the regression analysis of and yields the more certain relation
| (12) |
Given the two widely used black hole mass estimators, the - relation (Ferrarese & Merritt 2000; Gebhardt et al. 2000) and the - relation (Marconi & Hunt 2003), we can construct the - relation from the - and - relations in section 7.1 to further investigate the core size and black hole connection. Combining the - relation from Graham et al. (2011, their final entry in Table 2, acquired using only elliptical galaxies) with the - relation (Eq. 5) we can derive the new - relation
| (13) |
which is in remarkable agreement with Eq. 12. Combining the - relation (Eq. 6) with the - relation for predominantly massive spheroids from Graham (2007, his equation 19) converted to the -band using (Fukugita, Shimasaku & Ichikawa 1995), yields
| (14) |
While the - relation is likely to be non-(log-linear), Graham 2012b, the log-linear relation presented by Graham (2007) is dominated by massive spheroids and thus a good representation of the - relation for the ‘core’ galaxies.
It is worth noting that the scatter in the direct - relation established using the 7 elliptical core galaxies with direct black hole mass measurements (Eq. 12) is large. Although we only have a limited number of galaxies with a measured black hole mass and Eq. 12 is somewhat driven by the highest mass black hole101010Removing the highest mass black hole and excluding the disk galaxy gives a slope of 1.630.75., Eq. 12 is consistent (over-lapping error bars) with the two inferred relations (Eqs 13 and 14). Moreover, in contrast to the discussion in Lauer et al. (2007a, their Eqs 20 and 21), there is a good consistency among the deduced relations (Eqs. 13 and 14). The updated relations are not (i) contaminated by the inclusion of galaxies without cores nor (ii) based on galaxy rather than bulge luminosity for the disk galaxies (an issue discussed by Graham 2008a, his section 6), and (iii) use core-Sérsic break radii.
7.3. Central mass deficit
Galaxy merging is believed to be a common occurrence, responsible for the morphologies of elliptical galaxies. Growing evidence, based on extensive numerical experiment has indicated that the merger remnant of collisions between nearly equal mass spiral galaxies resemble early-type galaxies (e.g. Toomre & Toomre 1972; Hernquist 1993; Somerville & Primack 1999; Cox et al. 2006; Naab et al. 2006; Naab & Ostriker 2009). ‘Dry’ mergers of elliptical galaxies may subsequently build ‘core’ galaxies (e.g. Faber et al. 1997; Khochfer & Burkert 2003).
In ‘core’ galaxies, the inner most stars are thought to have been ejected by inwardly spiraling binary SMBHs in the course of such dry, i.e. dissipationless, galaxy mergers, producing the observed central luminosity deficit, , relative to the inward extrapolation of the outer Sérsic profile. Multiplying this deficit by the appropriate stellar mass-to-light ratio gives the central mass deficit, . More specifically, scattering of stars from the galactic nuclei in three-body interactions (since there is no significant amount of gas which may render dynamical friction) is thought to be the avenue through which the coalescing binary black holes will ‘harden’ and be delivered to the galaxy center (e.g. Begelman, Blandford & Rees 1980; Nakano & Makino 1999; Milosavljević & Merritt 2001). Using N-body simulations, Merritt (2006) showed that core formation is a cumulative process, where the total central mass deficit after dry mergers is such that . Gualandris & Merritt (2011) further discuss the long-term evolution of black hole binaries affecting the central stellar distribution, and scouring out cores having radii bigger than the influence of the binaries.
Here we have a) identified the galaxies with scoured out ‘cores’ (Table 2) and b) quantified how their sizes scale with the final black hole mass (section 7.2). Graham’s (2004) estimation of the central stellar mass deficit () through the employment of the core-Sérsic model yielded , a result later confirmed by Ferrarese et al. (2006). This mass deficit is in accord with hierarchical galaxy formation models, where luminous galaxies are a by-product of about 1 to 2 major dissipationless merger. For reference, based on observations of galaxy pairs, Xu et al. (2011) found that since , massive galaxies have experienced 0.4 to 1.2 major-mergers (see also Bell et al. 2004).
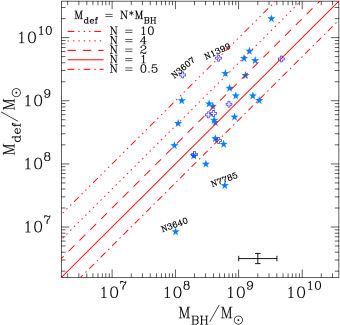
In Fig. 21 we present tentative central stellar mass deficits obtained using our core-Sérsic model parameters and Eq. A19 from Trujillo et al. (2004) plotted against the observed or predicted (Graham et al. 2011) supermassive black hole mass for each core galaxy. While , and are well constrained from our core-Sérsic fits, and may be less well constrained (section 4.1) and as such we caution about over-interpreting the results in Fig. 21. In passing we again note that the break radius and mass deficit for NGC 3607 may be too large, based on HST/NIC2 data analysed by Richings et al. (2011). Here we simply remark that the mass deficits scatter around 0.5 to 4 times the central supermassive black hole mass. ratios less than 0.5 imply that a minor merger event may have taken place (in the absence of loss cone refilling). Note that we follow Graham (2004) and assume a -band stellar mass-to-light ratio of 3.5 (Worthey 1994) to compute the mass deficits. For further reference, using N-body simulations, Kulkarni & Loeb (2011), measure mass deficits which are up to 5 times the mass of the central black hole.
Lauer et al. (2007a) proposed an alternate method to quantify the central stellar mass deficit in terms of a core with zero transition region breaking to an outer power-law profile with negative, logarithmic slope . However, as revealed by Graham et al. (2003), the Nuker model is not a robust quantity but varies with the radial range of the light profile that one tries to model. The range of (mass deficit)-to-(black hole mass) values in Fig. 21 is notably less than the values in Lauer et al. (2007a) which were as high as at (for black hole masses predicted using their - relation). Kormendy et al. (2009, their figure 42) also reported central mass deficits that were some 5 to 20 times greater than the central black hole mass, raising further doubts over their method of analyzing the galaxy light profiles (see the model-independent analysis by Hopkins & Hernquist 2010).
Finally, using Nuker model parameters, Gültekin et al. (2011) report a break radius of for NGC 4382 and a central mass deficit of . Our analysis yields a break radius roughly three times smaller () and a central mass deficit which is also three times smaller ().
Having refined the core galaxy sample in this study, in a follow-up paper we intend to acquire a greater radial range of the light-profiles for these galaxies, enabling a better estimate of the outer Sérsic parameters and thus the central mass deficits. This will allow us to check for a positive correlation with host spheroid mass and , tentatively seen in Fig. 21.
| Rest et al. | Ravindranath | Lauer et al. | Côté et al. | Our result | ||
|---|---|---|---|---|---|---|
| Galaxy | Profile Type | (2001) | et al. (2001) | (2005) | (2006) | |
| NGC 0741 | c-S | — | — | Yes | — | Yes |
| NGC 1374 | S | — | — | No | — | Yes |
| NGC 1399 | c-S | — | — | Yes | — | No |
| NGC 4278 | c-S | — | Yes | Yes | — | Yes |
| NGC 4365 | c-S | No | — | Yes | Yes | Yes |
| NGC 4406 | c-S | — | No | Yes | No | No |
| NGC 4458 | S | — | — | No | Yes | Yes |
| NGC 4472 | c-S | — | No | Yes | No | Yes |
| NGC 4478 | S | No | Yes | Possibly | Yes | |
| NGC 4486B | S | — | — | No | possibly | Possibly |
| NGC 4552 | c-S | — | — | Yes | No | Yes |
| NGC 5419 | c-S | — | — | Yes | — | Yes |
| NGC 6876 | c-S | — | — | No | — | Possibly |
| NGC 7213 | S | — | — | Yes | — | Yes |
8. Additional nuclear components
Additional nuclear light is detected in 12 (31%) of the 39 galaxies. Table 3 presents a comparison of detections of additional nuclear components from different studies; as done by Côté et al. (2006, their Table 3). Although the majority of our sample are core galaxies (82%), 5 of the 12 nucleated galaxies are Sérsic galaxies. We find good agreement with the work of Côté et al. (2006) in assigning the additional nuclear components with only two exceptions (NGC 4472 and NGC 4552). NGC 4552 has a point-source AGN (Renzini et al. 1995; Carollo et al. 1997; Cappellari et al. 1999) with a radio flux 103 mJy at 1.4 GHz (Condon et al. 1998). As for the Sy2 galaxy NGC 4472, at odds with Lauer et al. (2005) but in agreement with Côté et al. (2006), Ravindranath et al. (2001) also did not detect any additional nuclear component (Soldatenkov, Vikhlinin & Pavlinsky 2003). We do however note that this galaxy’s apparent point-source (which has a radio flux 752 mJy at 1.4 GHz: White & Becker 1992) is very faint and the presence of dust can lead to such small irregularities in profiles acquired after image deconvolution.
Lauer et al. (2005) identified the nuclear light excess as a central upward deviation from the best Nuker model fit to the host galaxy surface brightness profile. Their identification is not always consistent with our analysis. The relative faintness and extended nature of the additional nuclear components in NGC 1374 and NGC 4458 are viable explanations as to why our detections are at odds with Lauer et al. (2005). We also do not detect additional nuclear light in our data for NGC 1399 nor NGC 4406. Ravindranath et al. (2001) and Côté et al. (2006) also noted the absence of central light excess in NGC 4406, while Gebhardt et al. (2007) have also reported that NGC 1399 lacks any second component. Lyubenova et al. (2008) do however provide tentative evidence for the existence of a nuclear star cluster (or swallowed globular cluster) in NGC 1399. Lastly, Rest et al. (2001), after adopting a conservative central nuclei assigning approach reported the absence of additional nuclear components in NGC 4365 and NGC 4478, while all successive studies, including ours, identified central light excess in these two galaxies.
Of the 5 Sérsic galaxies with additional nuclear component, only one, NGC 7213 (Véron-Cetty & Véron 1988), has a central light excess associated with nonthermal emission from an AGN. We further note that the remaining 4 nucleated Sérsic galaxies have a nuclear disk, non-AGN central nuclei or both. In contrast, we note the presence of AGN in (at least) 5 of the 7 nucleated core galaxies: NGC 741 (Condon et al. 2002); NGC 4278 (Younes et al. 2010); NGC 4472 (Diehl & Statler et al. 2008); NGC 4552 (Carollo et al. 1997; Cappellari et al. 1999) and NGC 5419 (Capetti & Balmaverde 2005). Such prevalence is in accord with the studies by Balmaverde & Capetti (2006) and Richings et al. (2011), see also Pellegrini (2010). The central light excess in the remaining 2 core galaxies is not AGN related: NGC 4365 has a stellar cluster (Carollo et al. 1997) and NGC 6876 has a double optical nucleus possibly from an inclined disk (Lauer et al. 2002).
9. Conclusions
We have re-modelled the major-axis, surface brightness profiles of 39 alleged ‘core’ galaxies from Lauer et al. (2005), using Sérsic and core-Sérsic models. We have additionally and simultaneously accounted for the point sources and additional nuclear components that were excluded by the Nuker analysis. Consistent with earlier published works, we found that the Sérsic and core-Sérsic models yield a robust representation of the underlying light distributions of Sérsic and core-Sérsic galaxies, respectively, all the way to the resolution limit. The typical rms residual scatter is 0.02 mag arcsec-2.
The main results of this work are:
1. We have identified 7 of the 39 ‘core’ galaxies from Lauer et al. (2005) to be Sérsic galaxies which do not have partially depleted cores relative to the inward extrapolation of their outer Sérsic light profile. This situation tends to arise in galaxies and bulges fainter than mag. Such galaxies with spheroid Sérsic index or velocity dispersion km s-1 are not likely to have partially depleted stellar cores.
2. We provide physical parameters () for the cores of 32 ‘core’ galaxies , derived using the core-Sérsic model.
3. Due to noise or real small scale structure, non-parametric core size estimations obtained by locating the maximum of the second logarithmic derivative of the (non-smoothed) light profile, i.e. the point of greatest curvature, appear to be unreliable (Fig. 9).
4. As with the Nuker model, the break radius of the core-Sérsic model is shown to coincide with the radius where it has a maximum in the second logarithmic derivative (Fig. 9, Right).
5. For the first time, the radius where the negative logarithmic slope of the light profile , considered to be a suitable estimator for the size of the core, is shown to be consistent with the core-Sérsic model break radius (Fig. 11). It should, however, be noted that even galaxies without depleted cores will have a radius where equals 1/2. Therefore, this measurement cannot be used to identify ‘true’ depleted-core radii.
6. We have compared the core-Sérsic break radii with the Nuker break radii. In line with previous works, we found that the Nuker break radii are larger than the core-Sérsic break radii and also : on average, the Nuker break radii are 2 times bigger than the core-Sérsic break radii. Furthermore, the surface brightnesses () at the Nuker model’s break radii are up to 2 mag arcsec-2 fainter than the surface brightness at the core-Sérsic model break radii.
7. We have updated various structural parameter relations after excluding galaxies which do not have ‘real’ cores, and using core-Sérsic parameters. We have also used the bulge magnitude instead of the galaxy magnitude for the disk galaxies. We provide updated -, -, -, - and - relations in section 7.1.
8. In contrast to Lauer et al. (2007a), we found consistency among three linear - relationships (section 7.2). While one of these is obtained directly from and data (Eq. 12), the other two are constructed by combining the - and - relations and the - and - relations.
9. We detected additional nuclear light in 12 of the 39 sample galaxies. While our sample is rich in ‘core’ galaxies (32/39), 5 of the 12 nucleated galaxies are Sérsic galaxies: 1 with nonthermal emission from an AGN and 4 with excess stellar light. Five of the 7 nucleated ‘core’ galaxies have AGN emission. These results are in good agreement with previous estimates (e.g. Rest et al. 2001; Côté et al. 2006).
10. Following Graham (2004), we derived a tentative central mass deficit for our ‘core’ galaxies using Eq. A19 from Trujillo et al. (2004). These deficits are about 0.5 to 4 times the expected central supermassive black hole mass.
10. Acknowledgments
This research was supported under the Australian Research Council’s funding scheme (DP110103509 and FT110100263). This research has made use of the NASA/IPAC Extragalactic Database (NED) which is operated by the Jet Propulsion Laboratory, California Institute of Technology, under contract with the National Aeronautics and Space Administration.
References
- (1) Allen, P.D., Driver, S.P., Graham, A.W., Cameron, E., Liske, J., De Propris, R., 2006, MNRAS, 371, 2
- (2) Andredakis Y. C., Peletier, R. F., & Balcells, M. 1995, MNRAS, 275, 874
- (3) Balcells, M., Graham, A. W., Domíngez-Palmero L., & Peletier, R. F. 2003, ApJ, 582, L79
- (4) Balmaverde, B., Capetti A., 2006, A&A, 447, 97
- (5) Begelman, M. C., Blandford, R. D., & Rees, M. J. 1980, Nature, 287, 307
- (6) Bell, E.F., Wolf C., Meisenheimer K., et al. 2004, ApJ, 608, 752
- (7) Bekki, K. & Graham, A. W. 2010, ApJ, 714, L313
- (8) Bernardi, M., et al. 2002, AJ, 123, 2990
- (9) Binggeli, B., Sandage, A., Tarenghi, M. 1984, AJ, 89, 64
- (10) Binney, J., Mamon, G.A. 1982, MNRAS, 200, 361
- (11) Biretta, J., et al. 2001, WFPC2 Instrument Handbook, Version 6.0 (Baltimore: STScI)
- (12) Blakeslee, J. P., Lucey, J. R., Tonry, J. L., Hudson, M. J., Narayanan, V. K., Harris, B. J., 2002, MNRAS, 330, 443
- (13) Byun, Y.-I., et al. 1996, AJ, 111, 1889
- (14) Caon, N., Capaccioli, M., D’Onofrio, M. 1993, MNRAS, 265, 1013
- (15) Capetti, A., Balmaverde, B., 2005, A&A, 440, 73
- (16) Cappellari, M., Renzini, A., Greggio, L., di Serego Alighieri, S., Buson, L. M., Burstein, D., Bertola, F., 1999, ApJ, 519, 117
- (17) Carollo, C. M., Franx, M., Illingworth, G. D., & Forbes, D. A. 1997, ApJ, 481, 710
- (18) Condon, J.J., et al. 1998, AJ, 115, 1693
- (19) Condon, J.J., et al. 2002, yCat, 8065
- (20) Côté, P., et al., 2006, ApJS, 165, 57
- (21) Côté, P., et al. 2007, ApJ, 671, 1456
- (22) Cox, T. J., Jonsson, P., Primack, J. R., & Somerville, R. S. 2006, MNRAS, 373, 1013
- (23) Crane, P., et al. 1993, AJ, 106, 1371
- (24) Dhar, B. K., & Williams, L. L. R. 2010, MNRAS, 405, 340
- (25) Dhar, B. K., & Williams, L. L. R., arXiv:1112.3120
- (26) Davies, R.L., Efstathiou, G., Fall, S.M., Illing- worth, G., Schechter, P.L. 1983, ApJ, 266, 41
- (27) Deo, R. P., Crenshaw, D. M., & Kraemer S. B. 2006, AJ, 132, 321
- (28) de Ruiter, H. R., Parma, P., Capetti, A., Fanti, R., Morganti, R., Santantonio, L., 2005, A&A, 439, 487
- (29) de Vaucouleurs, G., 1948, Ann. d’Astrophys., 11, 247
- (30) de Vaucouleurs, G., de Vaucouleurs, A., Corwin, H.G., Jr., et al. 1991, Third Reference Catalogue of Bright Galaxies, Springer-Verlag Berlin Heidelberg New York
- (31) Diehl, S., & Statler, T. S., 2008, ApJ, 680, 897
- (32) Djorgovski, S., Davis, M., 1987, ApJ, 313, 59
- (33) D’Onofrio, M., Capaccioli, M., Caon, N. 1994, MNRAS, 271, 523
- (34) Faber, S. M., et al. 1997, AJ, 114, 1771
- (35) Ferrarese, L., et al. 2006, ApJS, 164, 334
- (36) Ferrarese, L., Merritt, D., 2000, ApJ, 539, L9
- (37) Ferrarese, L., van den Bosch, F. C., Ford, H. C., Jaffe, W., & O’Connell, R. W. 1994, AJ, 108, 1598
- (38) Ferrari, F., Dottori, H., Caon, N., Nobrega, A., Pavani, D.B. 2004, MNRAS, 347, 824
- (39) Forbes, D. A., 1994, AJ, 107, 2017
- (40) Fukugita, M., Shimasaku K., & Ichikawa, T. 1995, PASP, 107, 945
- (41) Gavazzi, G., Donati, A., Cucciati, O., Sabatini, S., Boselli, A., Davies, J., Zibetti, S. 2005, A&A, 430, 411
- (42) Gebhardt, K., et al. 1996, AJ, 112, 105
- (43) Gebhardt, K., Bender R., Bower G., et al. 2000, ApJ, 539, L13
- (44) Gebhardt, K., et al., 2007, ApJ, 671, 1321
- (45) Glass, L., et al., 2011, ApJ, 726, 31
- (46) Goerdt, T., Moore, B., Read, J. I., Stadel, J. 2010, ApJ, 725, 1707
- (47) Graham, A.W., 2004, ApJ, 613, L33
- (48) Graham, A.W., 2007, MNRAS, 379, 711
- (49) Graham, A.W., 2008a, ApJ, 680, 143
- (50) Graham, A.W., 2008b, Publ. Astron. Soc. Aust., 25, 167
- (51) Graham, A.W., 2012a, in “Planets, Stars and Stellar Systems”, Springer Publishing (arXiv:1108.0997)
- (52) Graham, A. W., 2012b, ApJ, 746, 113
- (53) Graham, A.W., Driver, S.P. 2005, Publ. Astron. Soc. Australia, 22, 118
- (54) Graham, A.W., Erwin P., Trujillo I., Asensio Ramos A. 2003, AJ, 125, 2951
- (55) Graham, A.W., Guzmán R. 2003, AJ, 125, 2936
- (56) Graham, A.W., Lauer T.R., Colless M.M., Postman M. 1996, ApJ, 465, 534
- (57) Graham, A.W., Onken C.A., Athanassoula E., Combes F. 2011, MNRAS, 412, 2211
- (58) Graham, A.W., Worley C.C., 2008, MNRAS, 388, 1708
- (59) Grillmair, C. J., et al. 1994, AJ, 108, 102
- (60) Grosbøl P., Patsis, P. A., & Pompei, E., 2004, A&A, 423, 849
- (61) Gualandris, A. & Merritt, D. 2011, arXiv1107.4095
- (62) Gültekin, K., Richstone, D. O., Gebhardt, K., et al. 2009, ApJ, 695, 1577
- (63) Gültekin, K., Richstone, D. O., Gebhardt, K., et al. 2011, ApJ, 741, 38
- (64) Hameed, S., Blank, D. L., Young, L. M., Devereux, N., 2001, ApJ, 546, L97
- (65) Hernquist, L., 1990, ApJ, 356, 359
- (66) Hernquist, L., 1993, ApJ, 409, 548
- (67) Hopkins, P. F., & Hernquist, L. 2010, MNRAS, 407, 447
- (68) Jaffe, W., Ford H. C., O’Connell, R. W., van den Bosch, F. C., & Ferrarese, L. 1994, AJ, 108, 1567
- (69) Kandrup, H. E., Sideris, I. V., Terzić, B., Bohn, C. L., 2003, ApJ, 597, 111
- (70) Khochfar, S., Burkert, A., 2003, ApJ, 597, 117
- (71) King, I.R. 1978, ApJ, 222, 1
- (72) King, I.R., Minkowski, R. 1966, ApJ, 143, 1002
- (73) King, I.R., Minkowski, R. 1972, IAU Symp., 44, 87
- (74) Kormendy, J., & Bender, R. 2009, ApJ, 691, L142
- (75) Kormendy, J., Dressler, A., Byun, Y. I., Faber, S. M., Grillmair, C., Lauer, T. R., Richstone, D., Tremaine, S. 1994, in ESO/OHP Workshop on Dwarf Galaxies, ed. G. Meylan & P. Prugniel (Garching: ESO), 147
- (76) Kormendy, J., 1999, in Merritt D. R., Valluri M., Sellwood J. A., eds, ASP Conf. Ser. Vol. 182, Galaxy Dynamics -A Rutgers Symposium, Astron. Soc. Pac., San Francisco, p. 124
- (77) Kormendy, J., Fisher, D.B., Cornell, M.E., Bender, R. 2009, ApJS, 182, 216
- (78) Kulkarni, G. & Loeb A., arXiv1107.0517
- (79) Laine, S., van der Marel, R. P., Lauer, T. R., Postman, M., ODea, C. P., & Owen, F. N. 2003, AJ, 125, 478
- (80) Lauer, T. R., et al. 1995, AJ, 110, 2622
- (81) Lauer, T. R., et al. 1996, ApJ, 471, L79
- (82) Lauer, T. R., Gebhardt, K., Richstone, D., et al. 2002, AJ, 124, 1975
- (83) Lauer, T. R., et al. 2005, AJ, 129, 2138
- (84) Lauer, T. R., et al., 2007a, ApJ, 662, 808
- (85) Lauer, T. R., et al., 2007b, ApJ, 664, 226
- (86) Laurikainen, E., Salo, H., Buta, R., Knapen, J. H., & Comerón, S. 2010, MNRAS, 405, 1089
- (87) Lotz, J. M., Miller, B. W., & Ferguson, H. C. 2004, ApJ, 613, 262
- (88) Lyubenova M., Kuntschner, H., Silva, D. R., 2008, A&A, 485, 425
- (89) Machacek M., Nulsen, P. E.J., Stirbat, L., Jones, C., Forman, W.R. 2005, ApJ, 630, 280
- (90) Makino, J., & Ebisuzaki, T. 1996, ApJ, 465, 527
- (91) Marconi, A., Hunt, L.K. 2003, ApJ, 589, L21
- (92) Martizzi, D., Teyssier, R. and Moore, B. 2012, MNRAS, 420, 2859
- (93) Merritt, D., 2006, ApJ, 648, 976
- (94) Merritt, D., & Milosavljević, M. 2005, Living Rev. Relativ., 8, 8
- (95) Michard, R., Prugniel, P., 2004, A&A, 423, 833
- (96) Milosavljević, M., & Merritt, D. 2001, ApJ, 563, 34
- (97) Morelli, L. et al., 2004, MNRAS, 354, 753
- (98) Naab, T., Jesseit, R., Burkert, A., 2006, MNRAS, 372, 839
- (99) Naab, T., & Ostriker, J. P. 2009, ApJ, 690, 1452
- (100) Nakano, T., & Makino, J. 1999, ApJ, 510, 155
- (101) Nieto, J.-P., & Bender, R. 1989, A&A, 215, 266
- (102) Nieto, J.-L., Bender, R., Surma, P., 1991, A&A, 244, L37
- (103) Paturel, G., Petit, C., Prugniel, P., Theureau, G., Rousseau, J., Brouty, M., Dubois, P., Cambrésy, L., 2003, A&A, 412, 45
- (104) Pellegrini, S. 2010, ApJ, 717, 640
- (105) Ravindranath, S., Ho, L. C., Peng, C. Y., Filippenko, A. V., & Sargent, W. L. W. 2001. AJ, 122, 653
- (106) Renzini, A., Greggio, L., di Serego Alighieri, S., et al. 1995, Nature, 378, 39
- (107) Rest, A., van den Bosch, F. C., Jaffe, W., Tran, H., Tsvetanov, Z., Ford, H. C., Davies, J., & Schafer, J. 2001, AJ, 121, 2431
- (108) Richings, A. J., Uttley, P., & Krding, E., 2011, MNRAS, tmp, 759
- (109) Sérsic, J. L. 1963, Boletín de la Asociación Argentina de Astronomía, 6, 41
- (110) Sérsic, J. L. 1968, Atlas de Galaxias Australes (Cordoba: Observatorio Astronomico)
- (111) Soldatenkov, D. A., Vikhlinin, A. A., & Pavlinsky, M. N. 2003, Astronomy Letters, 29, 298
- (112) Sommerville, R. S., Primack, J. R., 1999, MNRAS, 310, 1087
- (113) Soria, R., Graham, A.W., Fabbiano, G., Baldi, A., Elvis, M., Jerjen, H., Pellegrini, S., Siemiginowska, A., 2006, ApJ, 640, 143
- (114) Tonry, J. L., et al., 2001, ApJ, 546, 681
- (115) Toomre, A., & Toomre, J. 1972, ApJ, 178, 623
- (116) Trujillo, I., Erwin, P., Asensio Ramos, A., & Graham, A. W. 2004, AJ, 127, 1917
- (117) van den Bosch, F. C., Ferrarese, L., Jaffe, W., Ford, H. C., & O’Connell, R. W. 1994, AJ, 108, 1579
- (118) van der Marel, R. P., Franx, M., 1993, ApJ, 407, 525
- (119) Véron-Cetty, M.-P., & Véron, P. 1988, A&A, 204, 28
- (120) White, R.L., Becker, R.H., 1992, ApJS, 79, 331
- (121) Worthey, G. 1994, ApJS, 95, 107
- (122) Xu, C.K., Zhao, Y., Scoville, N., Capak, P., Drory, N., Gao, Y. 2011, ApJ, submitted (ArXiv:1109.3693)
- (123) Young, C. K., & Currie, M. J. 1994, MNRAS, 268, L11
- (124) Younes, G., Porquet, D., Sabra, B., Grosso, N., Reeves, J. N., Allen, M. G., 2010, A&A, 517, 33
- (125) Young, P.J., Westphal, J.A., Kristian, J., Wilson, C.P., Landauer, F.P. 1978, ApJ, 221, 721
11. Appendix A
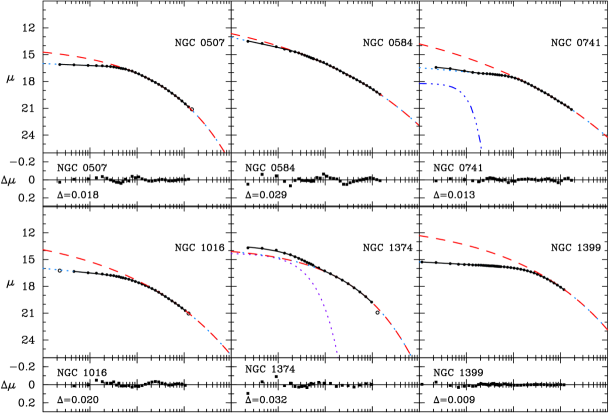
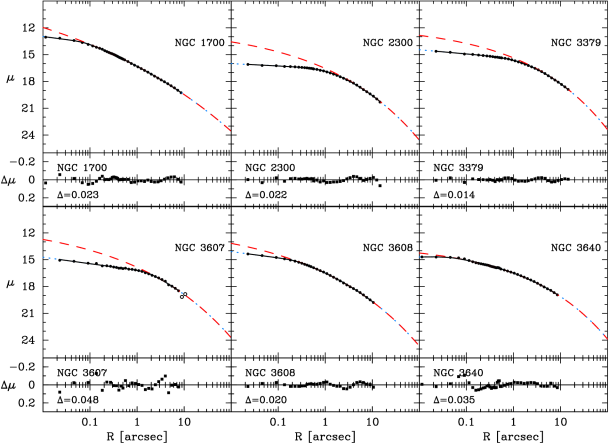
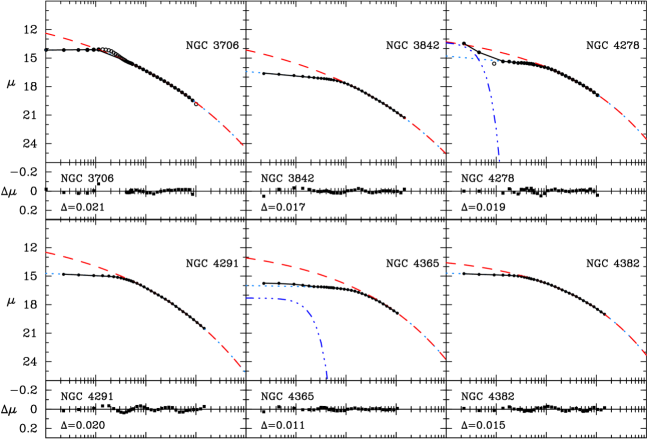
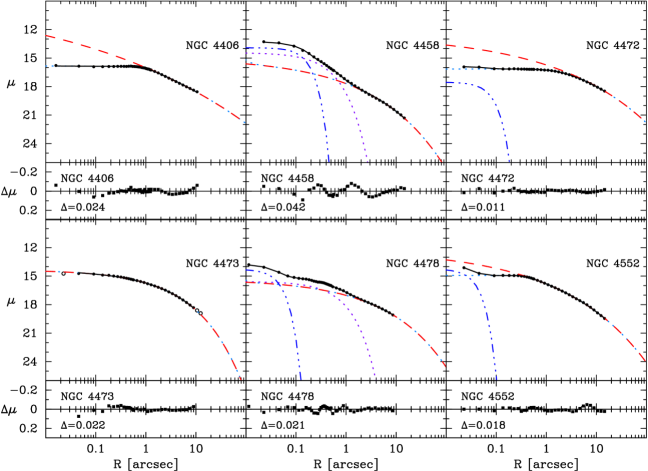
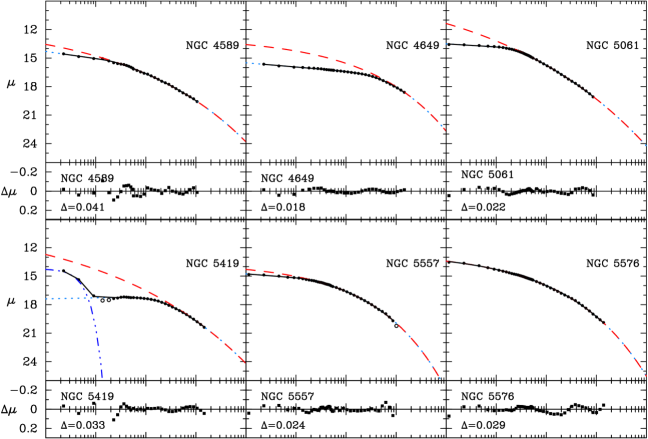
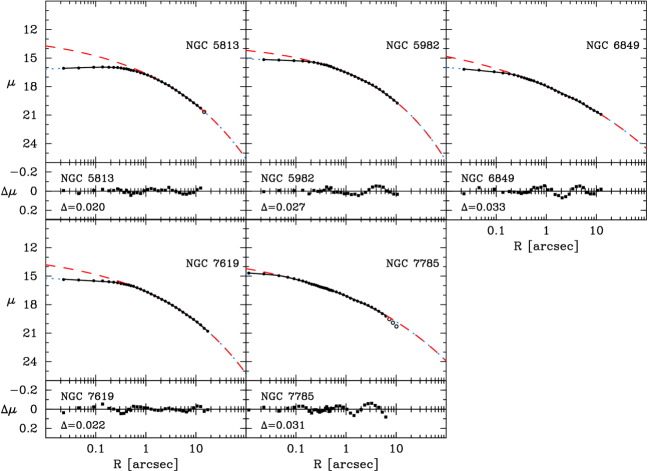
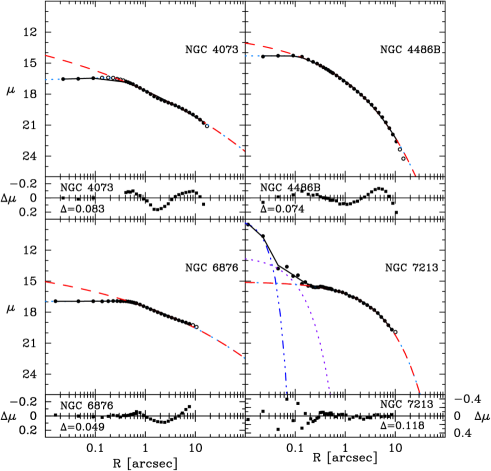
12. Appendix B
12.1. Notes on selected individual galaxies
NGC 584: This galaxy has a depleted core with an inner negative logarithmic slope . Thus, it has as opposed to the core () / power-law () dichotomy (see also Glass et al. 2011).
NGC 1374: This galaxy hosts an elongated inner disk (van der Marel & Franx 1993), which is well fit with a Sérsic model plus an inner exponential function for representing the disk.
NGC 3607: There is vivid evidence for the presence of an inner dust ring (Lauer et al. 2005).
NGC 3640: The galaxy is known for its morphological peculiarity including several sharp and diffuse features (e.g. shells, ripples), which probably signal an ongoing or recent merger (Michard & Prugniel 2004), which makes the underlying host galaxy light difficult to model since our model is not designed to accommodate such peculiarities. An ongoing or recent merger could be the reason for having an unusually small core for a galaxy of this luminosity.
NGC 3706: This galaxy exhibits an obvious inner stellar ring, shifting the peak of the surface brightness to from the photometric center (Lauer et al 2005). The light profile is better modelled with careful omission of the additional ring of starlight from 0″.11 - 0″.4 (see also Capetti & Balmaverde 2005).
NGC 4073: A cD galaxy with a possible history of cannibalism and having similar distinct features as NGC 3706. Lauer et al. (2005) identified an asymmetric central ring of stars noticeable on the brightness profile of the galaxy. Data points from - are excluded from the fit.
NGC 4365: This object is a giant elliptical in the Virgo cluster with a kinematically distinct core (Forbes et al. 1994), that has a slightly elongated inner nuclear excess (Carollo et al. 1997; Côté et al. 2006). The surface brightness profile is well fitted with the core-Sérsic model plus a Gaussian function for the inner nucleus.
NGC 4458: The isophotal contour analysis presented in Trujillo et al’s. (2004) revealed a prominent nuclear disk, see also Morelli et al. (2004). Analysis of the brightness profile indicates the presence of an extended point source (Ferrarese et al. 2006) and an inner disk. A good match to the HST-observed profile is obtained fitting a Sérsic model plus an inner exponential ( disk component and a Gaussian () for the point source.
NGC 4478: Like NGC 4458, there evidence for the presence of a nuclear disk in this galaxy (e.g. Trujillo et al. 2004; Morelli et al. 2004). The only noticeable difference with the light profile of NGC 4458 is that this galaxy has a relatively elongated disk, and a compact point source (Carollo et al. 1997; Ferrarese et al. 2006).
NGC 4486B: Based on the deconvolved HST/WFPC2 I- and V-band images, Lauer et al. (1996) showed the existence of a double optical nucleus in this galaxy. However, the double nuclei are not obvious from most of the archival optical HST images, as noted by Ferrarese et al. (2006), and it may be an artifact of the deconvolution routine. Nonetheless, the plateau in the inner light profile is not due to a relative deficit of stars. Tidal truncation from the interaction with the close companion M87 is apparent from the fit to the surface brightness profile, particularly in the outer part of the profile ( 7 kpc).
NGC 4552: This galaxy hosts a compact point source which is detectable in the optical image (Renzini et al. 1995; Carollo et al. 1997; Cappellari et al. 1999; Lauer et al. 2005).
NGC 5419: There seem to be two compact nuclear point sources, the brighter one at the photometric center, visible in the optical images (e.g. Capetti & Balmaverde 2005; Lauer et al. 2005). A “dip”, in the region 0″.1 to 0″.2, is detected in the light profile of the galaxy. Thus, two data points from are excluded from the fit.
NGC 6876: The dominant elliptical in the Pavo group shows past or ongoing interaction with the large spiral NGC 6872 (Machacek et al. 2005). Furthermore, the archival I- and V-band images of this galaxy indicate the presence of a double optical nucleus (Fig. 4), possibly the semi-digested nuclei of lesser galaxies or the ends of an inclined ring (Lauer et al. 2002). Like NGC 4486B, a core-Sérsic model can fit the surface brightness profile (see Fig. 23). Although, as the nuclei appear only , and equidistant, from the center, they may not explain the core’s structure and break radius of 0.45.
NGC 7213: This galaxy is the only spiral (Sa) in our sample. It hosts a bright Seyfert nucleus (Véron-Cetty & Véron 1988) and an inner disk. Hameed et al. (2001), see also Grosbøl et al. (2004), argue, based on the HI (neutral hydrogen) map, that this a highly disturbed system that may have experienced a past merger. In addition, using the broadband HST images, Deo, Crenshaw & Kraemer (2006) noted nuclear dust features in this galaxy.