Energy and Spectral Efficiencies Trade-off with Filter Optimization in Multiple Access Interference-Aware
Abstract
This work analyzes the optimized deployment of two resources scarcely available in mobile multiple access systems, i.e., spectrum and energy, as well as the impact of filter optimization in the system performance. Taking in perspective the two conflicting metrics, throughput maximization and power consumption minimization, the distributed energy efficiency (EE) cost function is formulated. Furthermore, the best energy-spectral efficiencies (EE-SE) trade-off is achieved when each node allocates exactly the power necessary to attain the best SINR response, which guarantees the maximal EE. To demonstrate the validity of our analysis, two low-complexity energy-spectral efficient algorithms, based on distributed instantaneous SINR level are developed, and the impact of single and multiuser detection filters on the EE-SE trade-off is analyzed.
1 Introduction
Resource allocation (RA) techniques, mainly power optimization, are becoming increasingly important in wireless system design, since battery technology evolution has not followed the explosive demand of mobile devices. The aim in RA is to maximize the sum of utilities of link rates for best-effort traffic. The usual approach consists in treat the problem jointly, i.e., optimize the joint power control and link scheduling, which has been extensively investigated in the literature and is known to be notoriously difficult to solve, even in a centralized manner. Hence, the methodology in [Stanczak et al. 2006, Ch.4-6] consists in identify a class of utility functions for which the power control problem can be converted into an equivalent convex optimization problem. The convexity property is a key ingredient in the development of powerful and efficient power control algorithms.
One of the most interesting way of dealing with power allocation problem is the energy-efficiency (EE) approach [Meshkati et al. 2007, Buzzi et al. 2010, Miao et al. 2010], with aims to maximize the transmitted data per energy unit (measured in bits per Joule) and closely related to green communication techniques [Han et al. 2011]. As pointed out by [Chen et al. 2011], one of the most important trade-offs on green wireless communications is energy efficiency versus spectral efficiency trade-off (EE-SE); the goal consists in balancing these two important conflicting metrics.
Recently, game theory, which has its roots in the economy field, has been broadly applied to wireless communications for random access and power control optimization problems. This work proposes a power control procedure based on the optimized deployment of two main resources scarcely available at the multiple access mobile terminals (MT’s), i.e., spectrum and energy. Importantly, from the analysis of two conflicting metrics, throughput maximization and power consumption minimization, the distributed energy efficiency cost function is formulated as a non-cooperative game. Indeed, the overall EE network depends on the behavior of each single user; so, the power control can be properly modeled as non-cooperative game [Fudenberg and Tirole 1991].
This work also investigates the impact of multiuser detection schemes, motivated by the fact that the gap between optimal-EE and maximal-SE is reduced when the multiple-access interference (MAI) is increased. Since those detectors are capable to reduce substantially the MAI from other users, their deployment could result in more energy-efficient systems, meaning the same SINR can be achieved with less power consumption. In order to demonstrate the validity of the method, two low-complexity energy-spectral efficiency algorithms based on distributed instantaneous SINR level are developed.
1.1 Related works
The energy efficiency power allocation problem with filter optimization was developed for DS-CDMA systems in [Meshkati et al. 2005, Buzzi and Poor 2008, Buzzi et al. 2010], and demonstrate the impact of MuD strategies in the EE maximization. Additionally, [Zappone et al. 2011] introduced cooperative networks in that scenario. For multi-carrier systems, [Miao et al. 2009, Miao et al. 2010] investigates the energy efficiency problem for OFDMA systems, and the EE-SE trade-off for OFDMA systems are investigated in [Miao et al. 2011]. Considering multi-carrier CDMA, [Meshkati et al. 2006] investigates the existence of Nash Equilibrium for the EE optimization problem, and even assuming some simplifications the system can achieve multiple or even none Nash Equilibrium. To reduce the allocated power by non-cooperative games, [Saraydar et al. 2002] develops a linear pricing factor, and demonstrate that this approach is Pareto-dominant over non-pricing solutions.
This paper proposes the EE-SE trade-off analysis in DS-CDMA systems, as developed by [Miao et al. 2011] for OFDMA systems. Based on the conclusions of this analysis, we develop two algorithms to improve the EE of the system by removing EE non-optimal users, putting these users in outage. So far, this approach was not presented in other works. Hence, in previous literature’s works, when a user is not able to achieve the optimal EE, it uses the maximum power to achieve the maximum EE. Since CDMA systems are limited by interference, removing those users it enables to reduce the generated interference and, possibly, increases the energy efficiency.
2 Network System Model
For analysis simplicity, initially we have assumed a single rate uplink direct sequence code division multiple access (DS/CDMA) network. However, the extension for multi-cell multi-carrier multiple access systems is straightforward. The received signal in the base station can be described as:
| (1) |
where is the complex channel gain between the th user and the base station, constant during the chip period111Mobile channel is assumed to be slow and non-selective in frequency., is the th user spreading code with length , representing the processing gain; the modulated symbol is given by , and is the thermal noise, assumed to be AWGN, zero-mean and covariance matrix given by .
The uplink channel gain vector, considering path loss, shadowing and fading effects, between users and the base station, is given by:
| (2) |
which could be assumed static or even dynamically changing over the optimization window ( time slots). The signal-to-interference-plus-noise ratio (SINR) is defined by the received signal power to the sum of interfered power plus background noise, measured after demodulation. In DS/CDMA this ratio depends on the detection strategy. Considering the adoption of linear receivers, the SINR can be expressed, generically, as:
| (3) |
where the channel gain , represents the MAI power level, is the th user pseudo-noise (PN) spreading code, with , and is the dimensional vector representing the receive filter for the th user; denotes transpose operator.
2.1 Matched Filter (SuD)
The simplest filter that can be used is the matched filter (MF), a single-user detection (SuD) strategy. For this receiver, the filter vector is defined as the th user spreading code, and the interference power is considered as a background noise, which limits the system performance, since CDMA systems are limited by the interference level. Hence, the SINR expression in eq. (3) can be re-written considering MF by:
| (4) |
Besides the simplicity, consider the MAI as noise power implies that the system cannot mitigate the interference, and when the system loading becomes higher, the necessary power to keep the SINR level for a specific user becomes higher; as a consequence, this impacts on the whole multiple access system, increasing the overall power level consumption. In order to avoid this behavior, improve the system performance and simultaneously reduce the MAI effect, Verdu developed the idea of multi-user detection (MuD) [Verdú 1984]. In order to detect/decode the signal of the interest user, multiuser receivers deploy MAI information (come from interfered signal users), reducing the necessary power to achieve the same SINR level. The best MuD strategy namely optimum MuD receiver (OMuD) is that this receiver results in an exponential complexity, which reduces the applicability of the optimum receiver.
2.2 Sub-Optimum Linear Multiuser Filters (LMuD)
One of the possible ways to reduce the OMuD complexity, obtaining near-optimal performance, consists in apply linear multiuser filters [Lupas and Verdu 1989], such as decorrelator (DE), zero-forcing (ZF) and the minimum mean square error (MMSE). Linear multiuser filters applies a linear transformation in the MF soft estimation, decoupling the MAI. Besides, LMuDs are useful in power optimization algorithms because the resulting SINR is deterministic, unlike heuristic-based methods, and that is important to find the minimum power to achieve the target SINR.
Among the LMuD filters, the most efficient is the MMSE, because this technique takes into account the amplitude and background noise from the interfered users, which results in a most efficient interference reduction without a large increase in the background noise, as occur for zero-forcing and decorrelator as well [Moshavi 1996]. Besides the efficiency, the MMSE filter requires users’ amplitude matrix, and a distributed implementation becomes complicated – mainly whit the proposed iterative power control algorithm, as described in Section 5, since this matrix will be updated at each iteration.
In order to avoid the aforementioned problems, decorrelator detector has been chosen, which presents slight inferior performance regarding the MMSE detector, but it depends only on the spreading codes () and the correlation matrix () [Meshkati et al. 2005]. Both parameters are constant during the power control algorithm execution, which implies in just one transmission at the beginning of algorithm iterations. The decorrelator filter (after MF) is given by:
| (5) |
Hence, the achieved SINR is given by:
| (6) |
The investigation of the tradeoff between the resource reduction achieved with the MMSE detector (instead of decorrelator), and the needed power and communication overhead to transmit the amplitude information is out of the scope of this work and could be addressed in a future work.
2.3 QoS Requirements
In order to guarantee the quality of service (QoS), a minimum data rate for each user must be provided for the system network service, being an important requirement to be warranted. So, in general, data rate for the th user is assumed to be a function of SINR . To do that, we use a modified version of Shannon capacity equation, given by:
| (7) |
where is given herein by the (4) or (6) and is a gap introduced to describe the limitations and imperfections in real communication systems, such as modulation effects, and so on, to approximate the real data rate [Tse and Viswanath 2010], given by:
and is the maximum tolerable bit error rate by the th user [Goldsmith and Chua 1997]. The spectral efficiency (SE) is obtained from (7):
| (8) |
From (7), the minimum data rate for the th link, , which is able to guarantee the QoS, considering maximum tolerable BER for that service, can be easily mapped into the minimum SINR:
| (9) |
3 Problem Formulation
In a multiple access interference limited communication system, the th user selfish (non cooperative approach) allocates his own transmit power and receive filter strategy (single- or multi-user detection strategy, cancelation, MAI mitigation, zero-forcing and so forth) in order to maximize his own energy efficiency function, expressed by [Goodman and Mandayan 2000]:
| (10) |
where is the number of bits in each transmitted data packet; is the number of information bits contained in each data packet, is the transmission power, is the circuit power consumption, and is the efficiency function, which approximates the probability of error-free packet reception. When no coding technique is used, it can be approximated by
| (11) |
This approximation is widely accepted for BPSK and QPSK modulation.
It is worth noting that both transmission power and circuit power consumptions are very important factors for energy-efficient communications. While is used for reliable data transmission, circuit power represents average energy consumption of electronics devices and circuitry [Miao et al. 2010]. Besides, the SINR for user , , assumes different definition depending on system type, multiple access detection strategy (SuD or MuD, as described in Section 2.1 and 2.2, respectively), spreading sequence type an so forth.
Note that is measured in , which represents the number of successful bit transmissions that can be made for each energy-unit drained from the battery and effectively used for transmission.
In a more general context, we can define the concept of global energy efficiency function as the ratio of the total achievable capacity over the total power transmission consumption:
| (12) |
where , and
3.1 Distributed Non-cooperative EE Power Optimization Game
The network energy efficiency depends on the behaviors of all users; so, the power control can be properly modeled as non-cooperative game [Fudenberg and Tirole 1991]. In the context of non-cooperative power control game
| (13) |
where , and is the strategy set for the th user, with being the maximum allowed power for transmission; the utility functions is performed by one of the energy efficiency functions , such as the basic EE function, eq. (10).
Consider the power allocation for the th user, and denote the respective power vector of other users (interfering users):
| (14) |
Hence, given the power allocation of all interfered users, , the best response of the power allocation for the th user can be expressed as:
| (15) |
where is given by (10), and is called the th best response function.
Finally, the problem for distributed energy-efficiency with power constraint under non-cooperative game perspective can be posed as:
| (16) | |||||
which solution consists in adopting the best-response strategy for user . Indeed, the best-response strategy consists in obtain the best user utility function (EE) individually for each user, as posed by (15). Hence, applying the derivative on eq. (16), regarding , we have:
which, under certain conditions, represents the best response power allocation strategy for each user, given the interfered power vector .
3.2 Best SINR Response for SuD and LMuD Filters
Given the context of medium or high SINR, the power allocated for th can be approximated by
| (17) |
The first derivative of EE function (16) regarding to is equivalent to take the derivative of EE function regarding to :
| (18) |
Hence, the optimal SINR for the th user, , in terms of EE-SE tradeoff is obtained finding the solution of (maximization point), admitting fixed the normalized multiple access interference . This condition is equivalent to solve function (19) regarding .
| (19) |
In order to guarantee that eq. (19) has only one maximizer, we introduce the concept of quasiconcavity, defined as [Miao et al. 2011]:
Definition 1 (Quasiconcavity).
A function , that maps a convex set of n-dimensional vectors into a real number is quasiconcave if for any
| (20) |
Lemma 1 (Quasiconcavity of ).
The utility function is quasiconcave in
This result is very important in the proof of existence and uniqueness of the system equilibrium. However, due to space limitation all proofs are not developed herein.
4 Increasing Interference Effect and Nash Equilibrium on EE-SE Trade-off
In this section we present a trade-off between non-cooperative energy-efficient and spectral-efficient power control schemes. This trade-off is determined by the multiple access interference level, which is responsible by the gap among the maximal EE and the optimum SE (only attainable with infinity power allocation). In realistic interference-aware systems the increasing number of active users brings an increasing on system capacity; therefore, the SE of the system increases accordingly. The gap among the max-EE and the opt-SE, , can be reduced when the interference level increases. In order to quantify this effect, let us define the coupling network parameter:
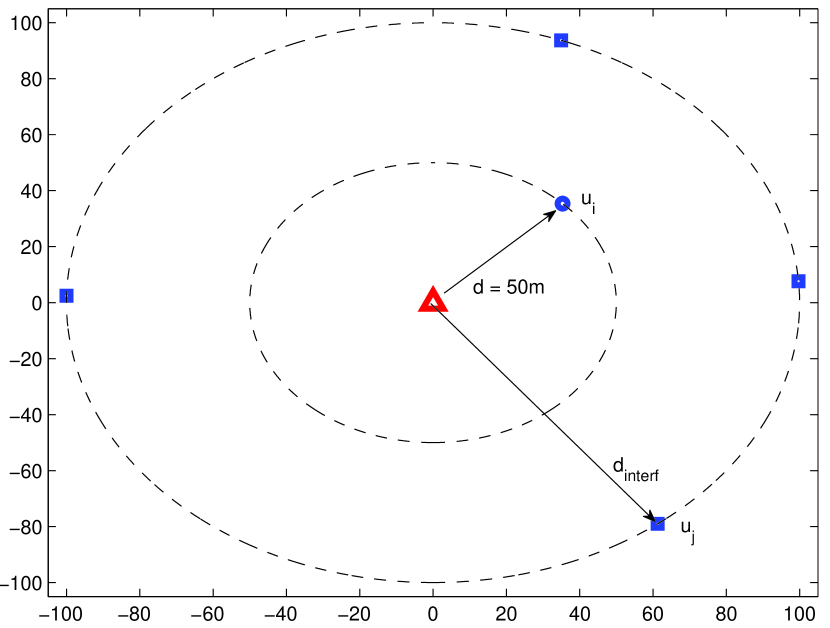
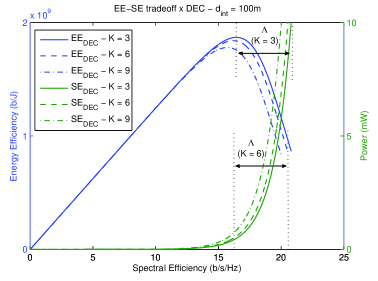
where is the operator temporal average. Furthermore, defining the cell geometry and the placement of the interfering users, as well as the th interest user in the way of Fig. 1.a, the max-EE and the opt-SE behavior are obtained in terms of , Fig. 2. It is clear the gap reduction between the max-EE and the asymptotic-SE when the interference level increases, considering conventional detector. For decorrelator, the main components are the distance (since increases path loss) and spreading-code correlation, since bigger correlation implies in bigger noise amplification. Fig. 1.b shows the system parameters used in this simulation scenario.
| Parameters | Adopted Values |
|---|---|
| DS/CDMA Optimal Power Allocation | |
| Noise Power | [dBm] |
| Processing Gain | |
| Max. power per user | [dBm] |
| # mobile terminals | |
| Interest user distance | [m] |
| Interfering users distance | [m] |
| Packet size | [bits] |
| Data bits | [bits] |
| Maximum BER | |
| Circuit Power | [dBm] |
| Bandwidth | [Hz] |
| Channel Gain | |
| Path loss | |
| Fading coefficients | Rayleigh distribution |
| mean over 5000 samples | |
| Verhulst PCA | |
| Convergence factor | |
| # iterations | |
When circuit power consumption is much smaller than the transmitted power (), an interesting result emerges: the optimum SINR obtained from the EE optimization problem in (19) is the same for any MAI level, while the asymptotic SINR necessary to the SE maximization still remains related to the interference power level, .
Hence, under this hypothesis, the best SINR for max-EE criterium depends only on the system parameters, such as maximal tolerable BER (QoS), modulation level, coding and packet coding size. It is worth to note that when the MAI increases, the transmitted power becomes higher and, indeed, the condition holds, as one can see from the left side plots of Fig. 2.a) to c), i.e., when distance is reduced.
a)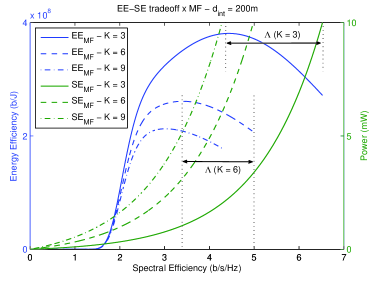
b) 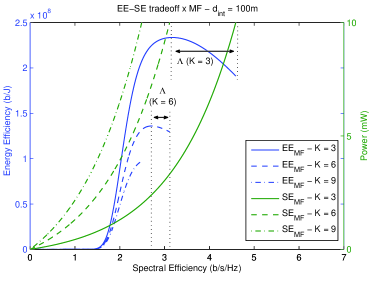
c) 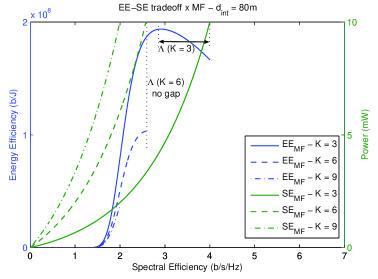

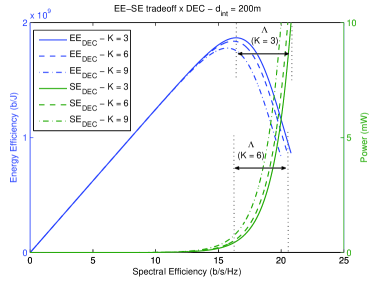
In order to corroborate those conclusions and to determine the impact of the MAI in the energy efficiency problem, this work analyzes the impact of linear multiuser filter deployment, specially the use of decorrelator multiuser detector. Hence, the achieved SINR with decorrelator filter, eq. (6), does not depend on the interference level, but the equilibrium point is changed by the position of the mobile terminals (i.e. the path-loss, which impacts on the channel gain, ), the instantaneous fading and the active users’ spreading codes correlation (as one can be seen on the right side plots of Fig. 2). This way, the expectation is that the EE is almost the same for any system loadings when multiuser filter is deployed at receiver side.
5 Proposed EE-SE Algorithms
The proposed algorithm to implement the optimal EE-SE tradeoff solution is described in Algorithm 1 and is based on Verhulst power control algorithm [Gross et al. 2011]. On the other hand, in order to avoid users’ outage, in which users are not able to achieve the optimal SINR in terms of EE (due to constraint), but are able to maintain the minimum data rate, , an alternative algorithm is proposed in Algorithm 2.
Algorithm 1 and 2 are closely related. It’s easy to see that when the necessary SINR to achieve the minimum rate criterion (and the associated ) is greater or equal than the optimum SINR (), Algorithm 2 reduces to Algorithm 1, since the second condition to be inserted in is always true for the non-optimum users.
After defining the algorithms, we need to investigate the existence and uniqueness of the achieved equilibriums. Given that the equilibrium is defined by , the Nash equilibrium can be defined as:
Definition 2 (Nash Equilibrium).
An equilibrium is said to be a Nash equilibrium if and only if any user cannot unilaterally improve their response by changing the optimum value. In the context of the energy-efficiency problem, this affirmation is equivalent to the fact that any user cannot improve their utility value by changing the optimum power for any other value:
| (21) |
The uniqueness of the Nash equilibrium for both non-cooperative games is summarized in Lemma 2.
Lemma 2.
When the equilibrium is achieved without removing any user, this Nash equilibrium is unique. When is needed to remove any user, multiple equilibriums will exist, depending on the adopted criterion. For our adopted criterion, the equilibrium is also unique.
6 Numerical Results
System parameters are indicated previously in Fig. 1.b with some changes. Analysis in this section assumes a ring geometry, with internal radius m and external radius m, with mobile users uniformly distributed on this ring area with radius , and the base station in the center of the ring. The processing gain was assumed ; number of mobile terminals . For simplicity, identical parameters of QoS were adopted for all users, i.e., maximal tolerable , and minimum data rate [kbps]. Fading is modeled as flat Rayleigh distribution (module), simulated by a complex Gaussian random process, with zero mean and variance given by . In order to analyze the average network behavior, numerical results were taken as the average over 2000 network realizations, including random (uniform) users distribution, pseudo-noise spreading codes and channel gains; but all algorithms and filters have deployed the same statistical parameters. Furthermore, it was assumed that the mobile transmitter has perfect channel state information (CSI) available, but the measurement of other mobile users’ CSI can only be carried out by the base station through quantized transmitted bits. To corroborate the results, we compare the two proposed algorithms with the classical approach adopted in literature, defined by eq. (16) [Meshkati et al. 2005, Buzzi and Poor 2008].
Figs. 3 and 4 bring four metric figures in order to analyze and to quantify performance gain of the two proposed algorithms, i.e., attainable sum rates of all users, , sum of power level consumption, including the circuit power, , the general energy efficiency (EE), obtained from the two algorithms for the two considered filters and, finally, the number of users put in outage.
From Fig. 3 a) one can conclude that the problem defined in literature achieves the best result in terms of sum rate maximization, mainly when the system loading increases, since no user was put in outage, followed by Algorithm 2, since a user is dropped only when the rate attainable by this user remain lower than the minimum rate value . As a consequence, the power consumption is increased, because users that don’t achieve the optimum SINR try to achieve it using maximum power allowed, increasing remarkably the interference level. Since the decorrelator is more efficient than the matched filter on the MAI mitigation, the system is able to support more users under decorrelator multiuser filter. Besides, any sum power or sum rate performance difference between the two proposed algorithms could be noted, despite the evident efficiency increasing of both algorithms, since the achieved rate is larger and simultaneously the allocated power is smaller than those attainable with the matched filter.
a) 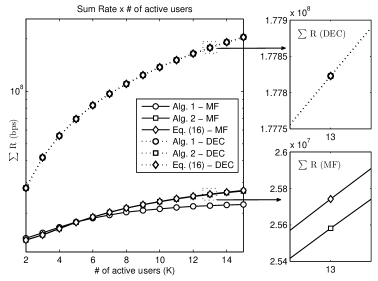 b)
b) 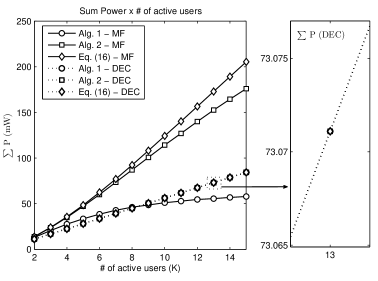
Fig. 4 a) indicates the EE behavior against increasing system loading (when the number of active users increases). When , despite of the sum rate improvement obtained by the Algorithm 2 and the problem defined in eq. (16) with matched filter over Algorithm 1 with matched filter too, as one can see from Fig. 3, this improvement is obtained at cost of the system’s energy efficiency degradation, Fig. 4. This behavior is justified by the fact that there are users transmitting with non-optimal powers in Algorithm 2 and in the problem defined by the literature. Besides, the best response in terms of EE is achieved by Algorithm 1, but incurs in more users in outage. Although there is a marginal power-rate trade-off difference among the two proposed algorithms, both are more efficient than the classical approach, mainly when system loading increases. As pointed out before, the multiuser decorrelating detector is more efficient than the MF for the two proposed algorithms, thanks to its improved capacity to provide multiple access interference mitigation.
a) 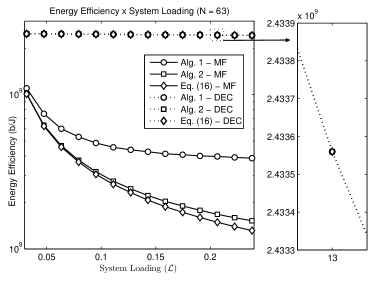 b)
b) 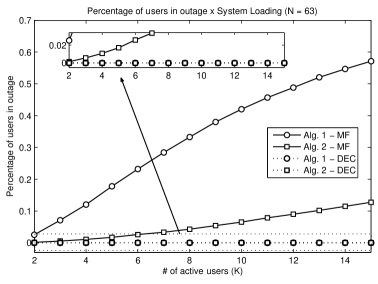
Fig. 4 b) shows the impact of the MAI into receivers equipped with matched and decorrelator filters based systems. System loading was confined in the interval . Hence, even under low system loading (around – %), Algorithm 1 based system is not able to achieve the maximum energy efficiency point for all users, since the required power to achieve the optimum SINR increases as the interference increases and then the maximum power available is overcame very soon. On the other hand, since Algorithm 2 allows users to transmit over a non-optimum power level scenario (as long as the minimum rate criterium is reached), the outage probability will be smaller. Again, thanks to the MAI mitigation characteristics of the decorrelator filter, the outage probability will be smaller than for MF. However, under extremely low loading (under 15%), Algorithm 2 with MF presents lower outage probability than Algorithm 1 with DEC filter; of course, with increasing system loading the outage probability becomes higher than Algorithm 1 with DEC.
It is worth to note that the performance gaps among the two proposed algorithms – mainly deployed with matched filter based systems – can be explained by the numerical value for the minimum rate adopted, which requires a low spectral efficiency () to be achieved, while allow a better visualization of the performance difference. Adopting a higher value for the minimum rate criterion, the expectation is that the outage probability will be increased for the two filters (MF and DEC), while the performance difference among the Algorithm 1 and 2 will be decreased.
To corroborate the efficiency of decorrelator and the conclusions about rate criterium, we simulate the same metric figures (Figs. 5 and 6) now at full-loading () and with two different rate criteria ( kbps and Mbps). For the first two metrics (sum-rate and sum-power, Fig. 5) the results demonstrate that Algorithm 1 obtains the best results in terms of sum-rate and sum-power, followed by Algorithm 2 and the algorithm described by eq. (16). Note that the bigger the minimum rate criterium, the closer Algorithm 2 results are from Algorithm 1.
a) 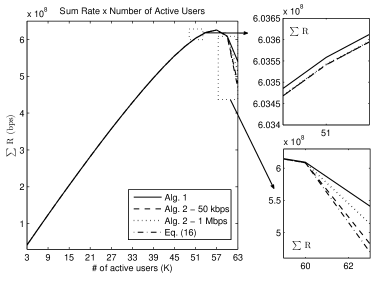 b)
b) 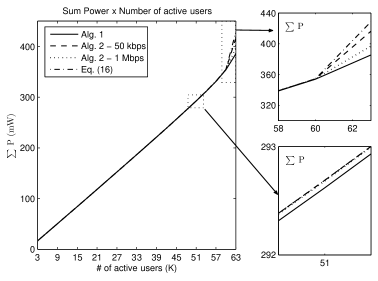
From Fig. 6 a), we can see that the achieved energy efficiency decreases when system loading increases, but still bigger than the obtained for MF in low system loading. Again, Algorithm 1 is the most efficient, followed by Algorithm 2 and the literature common approach. For outage probability, Fig. 6 b) demonstrate again that Algorithm 1 presents the higher probability, but even at full loading this probability are lower than the obtained by MF at lower loadings. Again, higher the minimum rate, closer Algorithm 2 is from Algorithm 1 and lower the minimum rate, closer Algorithm 2 is from literature’s common approach.
a) 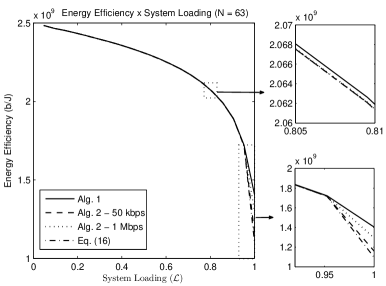 b)
b) 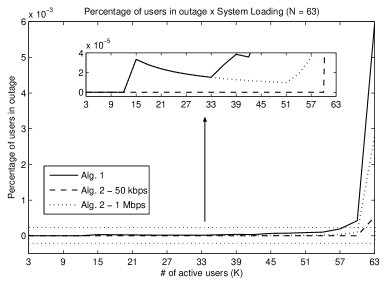
7 Conclusions
In this work we have analyzed the distributed energy efficiency (EE) cost function from the perspective of two conflicting metrics, throughput maximization and power level consumption minimization, as well as the impact of multiuser filter deployment over EE-SE trade-off.
We have found that SINR under the max-EE point equilibrium is almost the same whatever the level of multiple access interference becomes, mainly if interference level is medium or high. For MF, the best energy-spectral efficiencies trade-off consists in allocating to each node the necessary transmit power to achieve the best SINR response, which guarantees the maximal EE, while SE can be determined by the attainable rate in each node gives by the Shannon capacity equation.
Employing different figures of merit, numerical results indicated that deploying both proposed power allocation algorithms the linear multiuser filter is much more efficient than conventional matched filter receiver.
Finally, since the decorrelator detector is more efficient in providing MAI mitigation, new formulation for the max-EE versus opt-SE trade-off problem, considering multi-objetive techniques would be proposed as a new research direction in the field.
References
- [Buzzi and Poor 2008] Buzzi, S. and Poor, H. (2008). Joint receiver and transmitter optimization for energy-efficient cdma communications. Selected Areas in Communications, IEEE Journal on, 26(3):459 –472.
- [Buzzi et al. 2010] Buzzi, S., Poor, H., and Zappone, A. (2010). Transmitter waveform and widely linear receiver design: Noncooperative games for wireless multiple-access networks. Information Theory, IEEE Transactions on, 56(10):4874 –4892.
- [Chen et al. 2011] Chen, Y., Zhang, S., Xu, S., and Li, G. (2011). Fundamental trade-offs on green wireless networks. Communications Magazine, IEEE, 49(6):30 –37.
- [Fudenberg and Tirole 1991] Fudenberg, D. and Tirole, J. (1991). Game Theory. MIT Press, USA.
- [Goldsmith and Chua 1997] Goldsmith, A. J. and Chua, S. G. (1997). Variable-rate variable-power mqam for fading channels. IEEE Transactions on Communications, 45(10):1218–1230.
- [Goodman and Mandayan 2000] Goodman, D. J. and Mandayan, N. B. (2000). Power control for wireless communication. IEEE Personal Communication Magazine, 7(4):48–54.
- [Gross et al. 2011] Gross, T. J., Abrao, T., and Jeszensky, P. J. E. (2011). Distributed power control algorithm for multiple access systems based on verhulst model. International Journal of Electronics and Communications (AEÜ), 65:361–372.
- [Han et al. 2011] Han, C., Harrold, T., Armour, S., Krikidis, I., Videv, S., Grant, P., Haas, H., Thompson, J., Ku, I., Wang, C.-X., Le, T. A., Nakhai, M., Zhang, J., and Hanzo, L. (2011). Green radio: radio techniques to enable energy-efficient wireless networks. Communications Magazine, IEEE, 49(6):46 –54.
- [Lupas and Verdu 1989] Lupas, R. and Verdu, S. (1989). Linear multiuser detectors for synchronous code-division multiple-access channels. Information Theory, IEEE Transactions on, 35(1):123 –136.
- [Meshkati et al. 2006] Meshkati, F., Chiang, M., Poor, H., and Schwartz, S. (2006). A game-theoretic approach to energy-efficient power control in multicarrier cdma systems. Selected Areas in Communications, IEEE Journal on, 24(6):1115–1129.
- [Meshkati et al. 2005] Meshkati, F., Poor, H., Schwartz, S., and Mandayam, N. (2005). An energy-efficient approach to power control and receiver design in wireless data networks. Communications, IEEE Transactions on, 53(11):1885 – 1894.
- [Meshkati et al. 2007] Meshkati, F., Poor, H. V., , and Schwartz, S. C. (2007). Energy-efficient resource allocation in wireless networks: An overview of game-theoretic approaches. IEEE Signal Processing Magazine, 24:58–68.
- [Miao et al. 2009] Miao, G., Himayat, N., Li, G., and Talwa, S. (2009). Low-complexity energy-efficient ofdma. In Communications, 2009. ICC ’09. IEEE International Conference on, pages 1 –5.
- [Miao et al. 2011] Miao, G., Himayat, N., Li, G., and Talwar, S. (2011). Distributed interference-aware energy-efficient power optimization. Wireless Communications, IEEE Transactions on, 10(4):1323 –1333.
- [Miao et al. 2010] Miao, G., Himayat, N., and Li, Y. (2010). Energy-efficient link adaptation in frequency-selective channels. IEEE Trans. Commun., 58(2):545–554.
- [Moshavi 1996] Moshavi, S. (1996). Multi-user detection for ds-cdma communications. Communications Magazine, IEEE, 34(10):124 –136.
- [Saraydar et al. 2002] Saraydar, C., Mandayam, N., and Goodman, D. (2002). Efficient power control via pricing in wireless data networks. IEEE Trans. Commun., 50(2):291–303.
- [Stanczak et al. 2006] Stanczak, S., Wiczanowski, M., and Boche, H. (2006). Resource Allocation in Wireless Networks: Theory and Algorithms. Springer-Verlag Berlin Heidelberg, Germany.
- [Tse and Viswanath 2010] Tse, D. and Viswanath, P. (2010). Fundamentals of Wireless Communications. Cambridge University Press, Inglaterra, online edition.
- [Verdú 1984] Verdú, S. (1984). Optimum Multiuser Signal Detection. PhD thesis, University of Illinois.
- [Zappone et al. 2011] Zappone, A., Buzzi, S., and Jorswieck, E. (2011). Energy-efficient power control and receiver design in relay-assisted ds/cdma wireless networks via game theory. Communications Letters, IEEE, 15(7):701–703.