Spectroscopic Observations of Fe XVIII in Solar Active Regions
Abstract
The large uncertainties associated with measuring the amount of high temperature emission in solar active regions represents a significant impediment to making progress on the coronal heating problem. Most current observations at temperatures of 3 MK and above are taken with broad band soft X-ray instruments. Such measurements have proven difficult to interpret unambiguously. Here we present the first spectroscopic observations of the Fe xviii 974.86 Å emission line in an on-disk active region taken with then SUMER instrument on SOHO. Fe xviii has a peak formation temperature of 7.1 MK and provides important constraints on the amount of impulsive heating in the corona. Detailed evaluation of the spectra and comparison of the SUMER data with soft X-ray images from the XRT on Hinode confirm that this line is unblended. We also compare the spectroscopic data with observations from the AIA 94 Å channel on SDO. The AIA 94 Å channel also contains Fe xviii, but is blended with emission formed at lower temperatures. We find that is possible to remove the contaminating blends and form relatively pure Fe xviii images that are consistent with the spectroscopic observations from SUMER. The observed spectra also contain the Ca xiv 943.63 Å line that, although a factor 2 to 6 weaker than the Fe xviii 974.86 Å line, allows us to probe the plasma around 3.5 MK. The observed ratio between the two lines indicates (isothermal approximation) that most of the plasma in the brighter Fe xviii active region loops is at temperatures between 3.5 and 4 MK.
1 Introduction
The Parker nanoflare model is perhaps the most widely studied theory of coronal heating (e.g. Parker, 1988). In this model turbulent motions in the photosphere drive the braiding of magnetic field lines which leads to the formation of current sheets and the release of energy through magnetic reconnection. A central component of this concept is the formation of high-temperature (10 MK) emission during the impulsive phase of the reconnection (e.g., Cargill, 1994; Klimchuk & Cargill, 2001; Cargill & Klimchuk, 2004).
Considerable observational effort has gone into searching for the high temperature emission associated with nanoflares. Recent work with the X-Ray Telescope (XRT, Golub et al. 2007) on Hinode by Schmelz et al. (2009a, b) and Reale et al. (2009, 2009a), for example, has reported significant emission at temperatures near 10 MK. Other work that has focused on observations with the EUV Imaging Spectrograph (EIS, Culhane et al. 2007) on Hinode has found more sharply peaked emission measure distributions (Warren et al., 2011; Winebarger et al., 2011) although significant emission around 6 MK is reported by Ko et al. (2009). Winebarger et al. (2012) has argued that even in combination EIS and XRT are capable of setting only relatively high upper limits on the active region (AR) emission measure above 6 MK. The highest temperature emission line observed by EIS during non-flaring conditions is Ca xvii, which has peak formation temperature111Temperature at the peak of the ionization fraction from CHIANTI (Dere et al., 2009) ionization equilibria. () around 5.6 MK. For XRT the broad temperature response makes it difficult to identify high temperature, low emission measure plasma if there is cooler emission along the line of sight.
Spectroscopic observations of emission lines formed at high temperatures would greatly facilitate the determination of the emission measure beyond 6 MK in solar ARs. Most of the emission lines formed at these temperatures, however, lie at soft X-ray wavelengths where it is difficult to achieve high spatial resolution. Observations with limited spatial resolution taken with the Flat Crystal Spectrometer on the Solar Maximum Mission suggested relatively narrow temperature distributions. Isothermal fits to the observed spectra typically yielded temperatures of around 3 MK (e.g., Saba & Strong, 1991; Schmelz et al., 1996). The 94 Å channel of the Atmospheric Imaging Assembly (AIA: Lemen et al., 2012) on the Solar Dynamics Observatory images Fe xviii 93.94 Å, but this wavelength range also includes strong emission lines formed at million degree temperatures (e.g., O’Dwyer et al., 2010; Testa et al., 2012), making it difficult to use quantitatively. However, structures dominated by Fe xviii 93.94 Å, emission are observed in AR cores (Testa & Reale, 2012).
The forbidden transition of Fe xviii at 974.86 Å ( MK) is a potentially useful diagnostic for high temperature AR emission. This transition has the highest photon flux per unit emission measure of all of the Fe xviii lines. It has been observed in late-type stars with the EUV Explorer and appears to be unblended (e.g., Redfield et al., 2003). This line lies within the wavelength coverage of the Solar Ultraviolet Measurements of Emitted Radiation (SUMER, Wilhelm et al., 1995) instrument aboard (SOHO), but had not been observed on the disk previously because the high photon fluxes from the nearby H i Lyman 972.54 Å and C iii 977.07 Å lines in ARs would have affected the detectors’ lifetime.
In November 2011, a special SUMER campaign was organized to observe Fe xviii at 974.86 Å in an AR on the disk. Fortuitously, NOAA-11339, one of the largest ARs of the current solar cycle, emerged during this time and in this paper we present an initial analysis of some of the available SUMER, AIA, and XRT data. We confirm that the Fe xviii at 974.86 Å shows no detectable blends. Solar emission at this wavelength is nearly identical to XRT images in the thickest filters. We find that it is possible to remove contaminating blends in the AIA 94 Å channel and form relatively pure Fe xviii images that are consistent with the spectroscopic observations from SUMER. An initial effort at de-blending the AIA 94 Å channel has been presented by Reale et al. (2011), but here we are able to present a procedure optimized to reproduce the spectroscopic observations from SUMER.
2 Observations and data analysis
SUMER: The observations at the center of this work were taken on 2011 November 8 between 14:52 and 18:02 UTC by SUMER. In mid-2009, a loss of the gain of the multichannel plates was found in the center of the detector’s active area. As a consequence, to prevent an excessive current leading to a run-away effect in the multichannel plates, it was necessary to reduce the high voltage. As a result, the overall gain was reduced and in the central, KBr-coated, part of the photocathode the gain dropped below detectable thresholds. Only the two uncoated areas of the detector (about 200 pixels each) remain usable. The reduced gain, and some likely degradation of mirror reflectivity, has led to an estimated loss in the radiometric response of a factor of 2. In the past, observations of very bright areas were forbidden because of the high amount of charge they would extract from the detector (reducing the lifetime of the multichannel plates) but also because non-linearity effects started to affect the data at high count rates by locally depleting the detector gain to an extent that becomes unrecoverable above 50 count/s. SUMER detectors electronics also produces an electronic ghost effect appearing like an echo that becomes visible 2.11 Å red-ward of bright lines. This last point is particularly relevant to observations of the Fe xviii 974.86 Å line because of the bright H i line at 972.54 Å.
The progressive failure of the detector electronics, and the reduced-gain operation, has removed all constraints on the bright targets and the SUMER team decided to point for the first time at a very active region with high flaring probability: NOAA-11339.
SUMER is described in detail in the instrument paper (Wilhelm et al., 1995). Here we just mention that the spectra were recorded by imaging the slit with detector-B (the only operational after 2006) having an image scale around 960 Å of 44.1 mÅ/pixel and /pixel, respectively. Data were decompressed, reversed, corrected for response inhomogeneities (flat-field), dead-time and local gain effects and for the geometrical distortion induced by the read-out electronics.
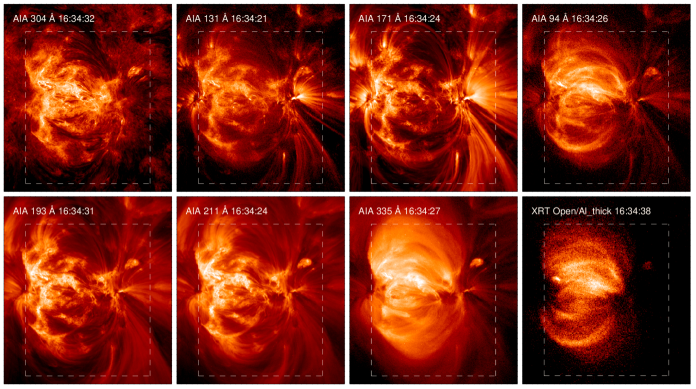
The observations discussed here consists of a raster of the target area. The study was designed to cover a 300 area in 132 steps of 2.2′′ (6 elementary steps) for a total of 133 spectra (85.5 s exposures). However, the scan mechanism is now loosing up to 40 % of the commanded elementary steps. Fortunately, the loss (verified through encoder readings) is roughly regular and the scan could be re-sampled to a regular grid of 70 positions in 3.04′′ steps. The effective field of view of the raster is of about (pixels at the extremes of the 300′′ slit are lost when correcting for geometrical distortion) and it is shown in Figure 1 overlaid 222Since November 2010 the SOHO spacecraft has not maintained the axis of its optical reference frame aligned to solar North but to the ecliptic North, causing solar images to roll between that must be accounted for. to AIA and XRT images of NOAA-11339. All spectra within from each grid location were summed together. The number of summed spectra goes from a minimum of one to a maximum of 4. Total counts are used in line fitting to provide the correct error budget (photon noise). Data were further binned over three pixels along the slit before fitting the profiles with a single Gaussian plus a linear background leading to the final resolution of the SUMER images.
AIA: Images from AIA are used to provide context at different temperatures (see Figure 1). The channel at 94 Å is of particular interest to this study because it should be dominated by Fe xviii emission but has also significant contribution from cooler (million degree) lines. Thus, a comparison between SUMER and AIA 94 Å data can help evaluate the spectral purity of the latter.
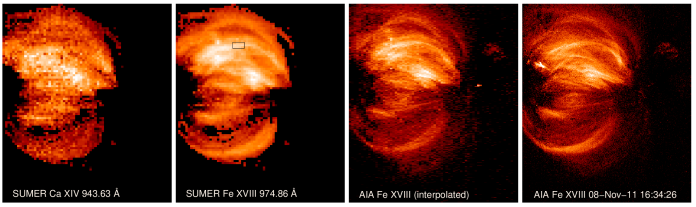
The contribution of warm (million degree) emission to the AIA 94 Å channel can be represented by a linear combination of the 171 Å (Fe ix) and 193 Å (Fe xii) AIA channels and can be evaluated using the technique described by Warren et al. (2012). The difference between the observed 94 Å AR images and the warm image inferred from the 193 and 171 Å is the AIA Fe xviii.
We have applied this algorithm to each set of 94, 193, and 171 Å AIA images during the SUMER observations. For each SUMER intensity we have interpolated to the nearest position and time in the AIA Fe xviii data. The resulting image, which is degraded to the SUMER spatial resolution, is shown in Figure 2. For comparison, we also show a full resolution AIA Fe xviii image taken around mid-time of the SUMER raster.
3 Spectral purity of the Fe xviii 974.86 Å and Ca xiv 943.63 Å lines
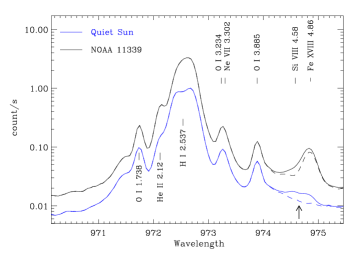
Electronic ghost: It is first necessary to assess blending with the electronic echo produced by the H i 972.54 Å line around 974.65 Å. Figure 3 shows the average recorded spectrum over NOAA-11339 and over a quiet Sun area observed on November 10 with the same instrumental setting. Since no detectable emission from Fe xviii is expected from the quiet Sun, these data are particularly useful for the evaluation of the electronic blend. Analysis of several datasets acquired over the years with SUMER shows that, to a first approximation, the ghost can be modeled as 1/200 of the ghosting line shifted 2.11 Å red-ward 333This is only a rough approximation as the shape of the ghost also depends on the signal level and there is a distribution of counts all the way from the ghosting line to the peak of the ghost. Moreover, the scaling also depends on the level of local gain correction applied to the ghosting line.. The result of subtracting such signal from the observed spectra is shown by dashed lines in Figure 3. It can easily be seen that no relevant spectral feature is left around 974.86 Å in the quiet Sun spectrum. We comment here that the spectral feature, apparently formed by two un-identified spectral lines, visible in quiet Sun and coronal hole spectra around 974.6 Å in Curdt et al. (2001) can be explained by electronic ghosting from the H i 972.54 Å line. In the AR, however, the electronic ghost significantly affects the blue wing of the Fe xviii line and would hamper velocity measurements unless the H i line is located outside the detector. Here we would like to stress that the purpose of this correction is only to show that no relevant spectral features are present in quiet Sun spectra after accounting for the electronic ghost and to provide a first order correction to the Fe xviii line radiance. The correction is not good enough to safely analyze the line profile, particularly its blue wing. No electronic ghost affects the Ca xiv line at 943.63 Å as there are no bright lines around 941.5 Å.
Line blends: The SUMER off-limb coronal atlas (Curdt et al., 2004) shows a line at 974.58 Å that is identified as due to Si viii (Kink et al., 1999). Other lines from the same - transitions are observed at 982.16 Å, 983.56 Å, 988.21 Å and 994.59 Å (Feldman et al., 1997) and can be reliably used to check the relevance of the 974.58 Å line. However, these lines were not acquired when observing NOAA-11339 and we make a comparison with the Si viii line at 944.34 Å. According to (Curdt et al., 2004) the Si viii 944.34 Å line is 60 to 100 times stronger than the 974.58 Å line, while the latter is similar within a factor 2.5 to the 982.16 and 983.56 Å lines (a factor 3 in laboratory data from Kink et al. (1999).
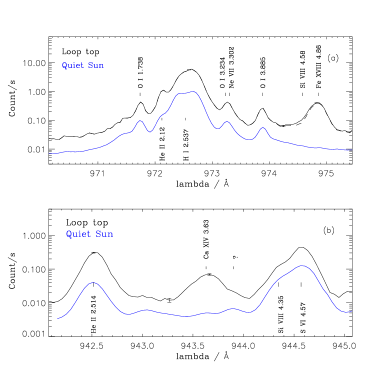
All the above lines are present in the CHIANTI atomic database (Dere et al., 2009) although no experimental data are available for the 974.58 Å line. According to CHIANTI the 974.58 Å line is hundreds of times weaker than the 982.16 and 983.56 Å lines but observations tell us that it should be of a similar intensity, suggesting problems with the atomic data. On the other hand, the 982.16 and 983.56 Å lines seem to be in agreement with observations and more than 100 times weaker than the 944.34 Å line. Thus, we can expect a a value between 50 and 100 also for the 944.34/974.58 Å ratio, as indeed shown by (Curdt et al., 2004). Figure 4 shows Fe xviii 974.86 Å and Ca xiv 943.63 Å spectra from a selected region at the top of the bright loop system of NOAA-11339. Figure 4b shows also the Si viii 944.36 Å line, telling us that only a negligible signal is expected in the Si viii 974.58 Å line. Similar results are obtained in different parts of the raster. In summary, it can be stated that the Si viii line at 974.58 Å does not contribute anything above few percents (if any) to the Fe xviii 974.86 Å line in most of the places where the latter is detectable.
We also note that two lines from Ar vii are listed by NIST at 974.48 and 974.83 Å. However, no Ar vii at those wavelengths have been observed in the experimental work of Borges et al. (2005) and Katai et al. (2007).
Figure 4b shows that also the Ca xiv 943.63 Å line seems substantially unblended. In this spectrum, the unidentified line around 943.9 Å, is only about 3 %, of the Ca xiv line and distant enough to be negligible when applying a single Gaussian fitting. On the other hand, the blue wing is slightly enhanced (although Gaussian within the uncertainties). Forcing a third component to the blue wing would results in a line placed around 943.453 for which we have not found any potential candidate in atomic databases and line lists. In any case, the difference in the intensity of Ca xiv line from a triple and a single Gaussian fitting is of 8 %. Values not larger than 10 % are also found at other locations in the inner part of the AR.
4 Summary and discussion
The Fe xviii 974.86 Å and the Ca xiv 943.63 Å are unblended spectral lines with formation temperatures of about 7.1 and 3.5 MK, respectively. As such they allow probing the plasma dynamics at these temperatures and are critical to establishing the amount of emission at high temperatures; aspects that are essential to constrain coronal heating models.
Our observations show Fe xviii emission from most of the core area of NOAA-11339. On the other hand, Testa & Reale (2012) find that bright emission in the AIA 94 Å channel and in the EIS Ca xvii line is observed only in small areas of two other active regions. The very high activity level of NOAA-11339 is most likely the reason for this difference.
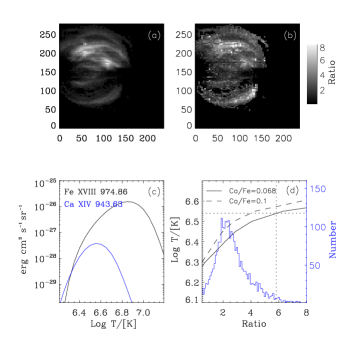
A quantitative analysis of the amount of emission at high temperatures would require additional spectral lines (i.e., EIS spectra) to perform a DEM analysis and a revision of the SUMER absolute radiometric calibration, both aspects that are beyond the scope of this work. However, it seems unlikely that the relative calibration has changed across the small 943 to 975 Å spectral range, where the radiometric calibration curve is particularly flat. This allows some considerations on the Ca xiv 943.63 over Fe xviii 974.86 Å ratio that is, of course, strongly temperature sensitive. Since the two ions have similar first ionization potentials and charge-over-mass ratios, there are no immediate reasons to expect substantial variations of their abundance ratio with respect to the value measured in the corona (0.068, Feldman et al., 1992) and in the photosphere (0.069, Asplund et al., 2009). However, larger values around 0.1 have also been measured in flares (Doschek et al., 1985, e.g.,). The observed ratio is shown in Figure 5b. We plot the contribution functions of the two lines as calculated by CHIANTI (assuming the CHIANTI ionization equilibria and the coronal abundances of Feldman et al. (1992)) in Figure 5c and their ratio (Fe xviii 974.86 over Ca xiv 943.63) in Figure 5d together with the observed ratio distribution. In this panel the ratio obtained for Ca/Fe is also plotted. The ratio distribution peaks at values around 2.5, corresponding to temperatures between 2.5 and 3 MK, with most of the pixels above these values. The brighter areas in Fe xviii show the largest ratios, with values up to 6. As an example, in the area marked by the black box in Figure 2, we measure a ratio of about 5.8 that indicates that most of the plasma in that region is at temperatures between 3.5 and 4 MK. We notice that the above value is consistent with the results obtained by Warren et al. (2012) in a an nearby area of the same loop system, were the above authors find a DEM (from EIS and AIA data) peaking at log /[K] .
Although the ratio analysis has intrinsic limitations in the very likely case of a multi-thermal plasma, the ratios indicate that there is very little plasma at temperature larger than 4 MK (log /[K]6.6).
In summary, the 940 to 980 Å spectral range has high potential for the diagnostics of plasmas in the 3.5 to 6.3 MK temperature range and, particularly, for unprecedented measurements of plasma dynamics at 6.3 MK through spectroscopic analysis of the strong and unblended Fe xviii line at 974.86 Å.
The SUMER observations presented here make use of a effective area 0.074 cm2 (without considering the aforementioned further loss of sensitivity under investigation) that requires long integration, hence scanning times, that prevent addressing dynamic phenomena. Future instrumentation with larger effective areas and detectors better capable of handling high fluxes will certainly provide ground-breaking observations of the hot plasma above ARs.
The Fe xviii 974.86 Å line will be observed with improved capabilities by the SPICE spectrograph aboard the Solar Orbiter mission of ESA. Moreover, the LEMUR spectrograph (Teriaca et al., 2011), proposed for the Japanese Solar-C mission, will observe these lines in one of its four simultaneous spectral bands with a 100 times larger effective area (7.2 cm2) and with higher spatial sampling (), certainly contributing to a significant step forward in our understanding of the solar corona.
References
- Asplund et al. (2009) Asplund, M., Grevesse, N., Sauval, A. J., & Scott, P. 2009, ARA&A, 47, 481
- Borges et al. (2005) Borges, F. O., Bredice, F., Cavalcanti, G. H., et al. 2005, European Physical Journal D, 36, 23
- Cargill (1994) Cargill, P. J. 1994, ApJ, 422, 381
- Cargill & Klimchuk (2004) Cargill, P. J., & Klimchuk, J. A. 2004, ApJ, 605, 911
- Culhane et al. (2007) Culhane, J. L., Harra, L. K., James, A. M., et al. 2007, Sol. Phys., 243, 19
- Curdt et al. (2001) Curdt, W., Brekke, P., Feldman, U., et al. 2001, A&A, 375, 591
- Curdt et al. (2004) Curdt, W., Landi, E., & Feldman, U. 2004, A&A, 427, 1045
- Dere et al. (2009) Dere, K. P., Landi, E., Young, P. R., et al. 2009, A&A, 498, 915
- Doschek et al. (1985) Doschek, G. A., Feldman, U., & Seely, J. F. 1985, MNRAS, 217, 317
- Feldman et al. (1997) Feldman, U., Behring, W. E., Curdt, W., et al. 1997, ApJS, 113, 195
- Feldman et al. (1992) Feldman, U., Mandelbaum, P., Seely, J. F., Doschek, G. A., & Gursky, H. 1992, ApJS, 81, 387
- Golub et al. (2007) Golub, L., Deluca, E., Austin, G., et al. 2007, Sol. Phys., 243, 63
- Katai et al. (2007) Katai, R., Morita, S., & Goto, M. 2007, Plasma and Fusion Research, 2, 14
- Kink et al. (1999) Kink, I., Engström, L., & Feldman, U. 1999, ApJ, 512, 496
- Klimchuk & Cargill (2001) Klimchuk, J. A., & Cargill, P. J. 2001, ApJ, 553, 440
- Ko et al. (2009) Ko, Y.-K., Doschek, G. A., Warren, H. P., & Young, P. R. 2009, ApJ, 697, 1956
- Lemen et al. (2012) Lemen, J. R., Title, A. M., Akin, D. J., et al. 2012, Sol. Phys., 275, 17
- O’Dwyer et al. (2010) O’Dwyer, B., Del Zanna, G., Mason, H. E., Weber, M. A., & Tripathi, D. 2010, A&A, 521, A21
- Parker (1988) Parker, E. N. 1988, ApJ, 330, 474
- Reale et al. (2011) Reale, F., Guarrasi, M., Testa, P., et al. 2011, ApJ, 736, L16
- Reale et al. (2009a) Reale, F., McTiernan, J. M., & Testa, P. 2009a, ApJ, 704, L58
- Reale et al. (2009) Reale, F., Testa, P., Klimchuk, J. A., & Parenti, S. 2009, ApJ, 698, 756
- Redfield et al. (2003) Redfield, S., Ayres, T. R., Linsky, J. L., et al. 2003, ApJ, 585, 993
- Saba & Strong (1991) Saba, J. L. R., & Strong, K. T. 1991, ApJ, 375, 789
- Schmelz et al. (2009a) Schmelz, J. T., Saar, S. H., DeLuca, E. E., et al. 2009a, ApJ, 693, L131
- Schmelz et al. (1996) Schmelz, J. T., Saba, J. L. R., Ghosh, D., & Strong, K. T. 1996, ApJ, 473, 519
- Schmelz et al. (2009b) Schmelz, J. T., Kashyap, V. L., Saar, S. H., et al. 2009b, ApJ, 704, 863
- Teriaca et al. (2011) Teriaca, L., Andretta, V., Auchère, F., et al. 2011, Experimental Astronomy, 135
- Testa et al. (2012) Testa, P., Drake, J. J., & Landi, E. 2012, ApJ, 745, 111
- Testa & Reale (2012) Testa, P., & Reale, F. 2012, ApJ, 750, L10
- Warren et al. (2011) Warren, H. P., Brooks, D. H., & Winebarger, A. R. 2011, ApJ, 734, 90
- Warren et al. (2012) Warren, H. P., Winebarger, A. R., & Brooks, D. H. 2012, ArXiv e-prints
- Wilhelm et al. (1995) Wilhelm, K., Curdt, W., Marsch, E., et al. 1995, Sol. Phys., 162, 189
- Winebarger et al. (2011) Winebarger, A. R., Schmelz, J. T., Warren, H. P., Saar, S. H., & Kashyap, V. L. 2011, ApJ, 740, 2
- Winebarger et al. (2012) Winebarger, A. R., Warren, H. P., Schmelz, J. T., et al. 2012, ApJ, 746, L17